


 Inglés (pdf)
 Articulo en XML
 Referencias del artículo
 Enviar articulo por email
 Citado por SciELO
  Citado por Google
  Similares en
SciELO
Similares en
SciELO  Similares en Google
 Permalink
Introduction
In economic thinking, the study of the high-tech industry (HTI) can be traced back to classical economists, who argued that industry arises from improved production and the intense division of labor. This improves the specialization and optimum use of factors. They also believed that the division of labor and market size are interdependent (Smith, 1958). The neoclassical economists concluded that industry showed increasing returns to scale due to the constant improvement of production and productive factors, which reduces production costs and increases efficiency. These concepts derived in the analysis of internal and external economies (Marshall, 1931), the influence of terms, the division of labor and market size.
According to the theory, the industrial sector defines the pattern of economic development because its growth affects the whole economy (Kaldor, 1966), is a determining factor of a complex structure in the inter-sectoral economic system (Leontief, 1986), and constantly pushes for innovation and technological changes, which modify the productive apparatus. In addition, the industrial sector defines patterns of consumption and investment in the circular flow of actors in the system (Schumpeter, 1978).
The study of the HTI is a special feature of the analysis of the industrial sector but, since it produces and employs highly complex factors, is decisive for the economic growth in the long term (ONUDI, 2015). The HTI allows to evaluate and diagnose the level of development of economies. Using the study of multisector models, it has been possible to answer interesting questions of the HTI on the economic structure. Some authors have broken down the effects of output growth of by changing the use of raw materials in the production process in Europe (García, Aroche, & Ramos, 2007), in accordance with the groups defined as high-tech and low-tech. The results pointed out that the high-tech group has the greatest impact on growth. More recently, it has been found that, in North America (Marquez, 2016), the HTI coordinates the interindustry networks of the productive structure from the trading block and that it conditions his way; however, this generality does not apply to three economies that form the economic zone.
The HTI is a subset of the total number of divisions. These divisions have been widely recognized because they coordinate processes among countries forming global chains of production, depend mainly on the current state of technology and the use of constant innovations to create assets, and use factors such as capital and highly specialized (Shapiro & Varian, 1999). The HTI has reduced transaction costs, streamlined the reproduction of the real and financial spheres of the economy, and impacted the productivity and development of countries.
This work uses the International Standard Industrial Classification of All Economic Activities, Revision 3 (ISIC, Rev. 3) that identifies the divisions of high technology such as: 1) chemicals, except medical and pharmaceutical products; 2) manufacture of machinery and equipment n.e.c., , manufacture of electrical machinery and apparatus n.e.c.; 3) manufacture of office, accounting and computing machinery, manufacture of radio, television and communication equipment and apparatus, manufacture of medical, precision instruments and optical instruments, watches and clocks, manufacture of furniture; manufacturing n.e.c., recycling; and 4) manufacture of motor vehicles, trailers and semi-trailers, building and repairing of ships and boats, manufacture of aircraft and spacecraft, manufacture of railway and tramway locomotives and rolling stock, manufacture of transport equipment n.e.c.
The objective of this study is to evaluate the role of the HTI in spreading innovations within the interindustry networks of the Colombian and Mexican economic structures using a Qualitative Input-Output Analysis (QIOA). This is due to the results of other studies that found that the Colombian economy has greater internal integration than the Mexican one (Marquez, 2018). The assumption behind this objective is that, despite the structural heterogeneity of Colombia and Mexico, weak HTI innovations spread in networks involving purchases of domestic inputs to outputs. This means that the effect of HTI innovation is truncated in the production of national goods that serve as components of the output of other industries, having a low impact on production; however, the spread of HTI innovations grows as the productive apparatus uses raw materials produced abroad, as is the case of the Mexican economy.
This research is composed of four sections. Section one presents the input-output model (IOM) and the study of innovation expansion. Section two shows the techniques of the QIOA that will be used for the study of Colombia and Mexico. Section three describes the dynamics and results of investment in research and development and innovation spending (RDI). Finally, the document points out some of the conclusions of spreading HTI innovations in the study case.
The Input-Output Model and Innovation Spreading
The IOM understands the economy as a set of divisions that belong to a sector (primary, secondary or tertiary sectors) and produces a type of used value that is consumed as a commodity to meet the needs of economic agents that constitute the demand, or as an intermediate input, i.e. as a component to develop another output, and therefore, it is highly complex. No matter the level of disaggregation, the model assumes that each division creates a homogeneous well using specific technology, which determines the demand of raw materials used as well as the amount of capital and labor; in other words, it determines the number of factors not produced in the economic system and those produced inside the IOM.
The IOM employs three tables that form the input-output tables (IOTs) to study the production structure. The first one is a double-entry table which records sales and purchases of inputs among divisions, defined as the array of intermediate transactions. Intermediate consumption is calculated as the sum of columns, i.e. the total of intermediate purchases, and intermediate demand as the sum of rows, i.e. the sales of finished products used by other industries as intermediate goods. The second table is final demand, disaggregated by economic activity and for economic factors such as families, the Government or the external sector. Finally, the added value table is used, which contains the payment of productive factors. So, the IOTs consider the value of the output of each division as the sum of intermediate demand and final demand (Equation 1) or the sum of intermediate consumption and value added (Equation 2); that is to say, by the side of the demand and supply, so that the IOTs is an accounting balance (Miller & Blair, 2009).
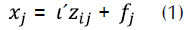
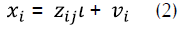
In Equations 1 and 2, i indicates row and i column, which represent the disaggregation of the lOTs; χ is the gross value of production; z ij is the matrix of intermediate transactions; ί is the vector line unit; and f j vi are the vectors of final demand and value added, respectively.
One assumption of the IOM is that production functions are linear and homogeneous, and have constant returns to scale; therefore, the coefficients or parameters of the IOM are constant or fixed (Leontief, 1986). Still, as the lOTs represents a point in time, technology does not change; only the cost of the inputs used to produce an industry is known.
According to Equation 1, the technical coefficients are defined as the proportion of input per unit of output generated. In this way, beyond doubling the production, it doubles the use of inputs but preserves the same proportion of each input regarding output (Leontief, 1986). Nevertheless, the set of technical coefficients are defined as:
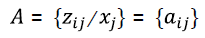
Therefore:
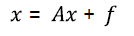
Thus, the gross value is defined as:
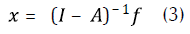
The entries in the array (I -a ) -1 are direct and indirect requirements among divisions and expresses how many units of inputs are required to produce the total output of the economy. This matrix is also called matrix of multipliers or Leontief-inverse and expresses the impacts caused by the change of an element of both final demand and added value, but also by other exogenous variables such as investment on research, development and innovation spending (RDI), government consumption, exports, etc.
From the IOM, the propagation of innovations leads to changes in the composition of technical coefficients as part of the resources obtained in the production process must be directed to the acquisition of new methods and applications to create new values in use. Thus, the use of innovations modifies interindustry relations that can be interpreted as a technological change, implying the emergence and disappearance of certain industries in the long term. Yet, new industries change the proportion of inputs and factors used in production in the short term. Innovation and technical changes in a sector of the economy modify the columns of matrix A (Aroche, 2006; So-nis, Hewings, & Guo, 1996), but may also be by altering the proportions of inputs that are not created in the system, such as labor and capital or some combination of the above. In general, innovation means a transformation of the way in which sectors are interrelated; that is, a metamorphosis of the productive structure.
Innovation and technical change have been studied through various measures with reference to the analysis of comparative statics (Sakurai, Papaconstantinou, & Loannidis, 1997). It is to compare the use of primary inputs, the effect on growth, structural change, in final demand, and the change of factors such as capital and labor, in addition to the use of primary inputs. Precisely, it is the change in endogenous variables and exogenous to the model, which in both cases benefit from the level of production.
Another area in which the analysis has been made is impact analysis using the concept of a National Innovation System (NIS). The NIS is a representation of how to propagate RDI in an economy; these disbursements are aimed at forming human capital and creating new capital goods. Nonetheless, each of them contains items that make up an innovation system within each process, there are different agents that stimulate innovation and development. In this way, the concept of NIS can be incorporated based on the spending to stimulate the invention and development of tools for the production process from the interdependence of economic divisions (Schnabl, 1995). The payment for these purposes comes from the funds of companies and the budgets of public institutions.
The Qualitative Input-Output Analysis in the Study of Innovation Spreading
The qualitative input-output analysis (QIOA) seeks to highlight the main connections that exist in the productive system according to certain features of the relations among divisions. The predecessors of this approach can be traced back to the fifties when Whitin (1954) linked the concept of economic structure to network; however, the person who defined this approach as known today was Czayka (1972, as citied in Schanbl, 1979), because his methodology was mostly used in analyzing the set of interindustry relations from the theory of networks or graphs.
The analysis of networks is explained by the patterns of connections among agents, who make up networks with certain structures (Bon, 1989). Thus, the network of relationships among divisions is a resource that facilitates the study of interdependence of a phenomenon such as the use of new innovations; however, since the way in which network is the strength of the fluidity among divisions of the productive fabric. Several studies have used the theory of networks to study economic phenomena, which have to do with industrial organization (Aroche, 2001; Czamansky & Ablas, 1979; Duque, Rey, & Gómez, 2009), trade (Hidalgo & Hausmann 2009, Shi, Zhang, & Yang, 2014), etc. This work has employed two techniques to analyze networks: the Minimum Flow Analysis (Schnabl, 1995) and the Important Coefficient Analysis (Aroche, 1996).
The Minimum Flow Analysis (MFA) studies a part of the economic system, a concept originally proposed by Sraffa (1960) and Pasinetti (1973) related to the search for the pattern and vertically integrated vector; that is, each division directly demands a set of productive factors such as capital and labor employed in creating the inputs required. The MFA is used to analyze the impacts of the RDI on the output by selecting the entries in the technical coefficients matrix that are equal to or lower than the average of the multipliers of the RDI, as follows:
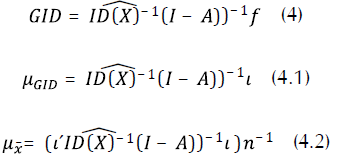
Equation 4 indicates the equality of the RDI from the IOM and  is the diagonal matrix of the vector of RDI coefficients. Equation 4.1 expresses the vector of multipliers of the RDI and Equation 4.2 is the value of the criterion for selectingthe entries of the technical coefficient matrix, where η i1 the number of productive divisions.
The qualitative transformation a in w validates the fact that complies with the properties of the similarity matrix equivalent to the input-output model, as follows:
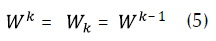
W stands for the representative flows of the impact of the RDI, which can be understood as the flow of innovations. W can also be obtained through the known sensitivity analysis developed by Scherman and Morrison (1949) in which it is assumed that both for a matrix is not singular and its inverse, if one element of the array changes, it produces changes in the inverse of one or more elements in accordance with the change of that item (Scherman & Morrison, 1949). In the IOM, the goal is to change inputs to facilitate the output of at least one sector; nonetheless, it is expected that not all changes in the entries of the coefficients ahave similar effects on the entries of the vector χ. Based on this analysis, important coefficients (ICS) have been defined as those changes in productive inputs that cause more variation in the entries for the output (x) (Forsell, 1988).
ICs are those in which the terms of trade of inputs between two sectors (i and j) imply a greater number of indirect relations among divisions, through the connection αij In this way, a change in this entry involves many divisions and, therefore, modifies the output of at least one sector.
ICs ate detected by means of the tolerance limits that are defined as follows (Shintke & Stâglin, 1988):
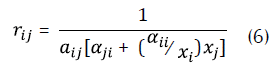
Where α ij are elements of the matrix a,α ij are elements of the Leontief-in-verse matrix, and x¡ is the gross value of production.
The identification of ICs contributes to the analysis of the key sectors of the economy constitute the fundamental structure (Jackson, 1991), which are distinguished between the estimate of error coefficients and the change of technical coefficients (Miller & Blair, 2009) that simulate a change generally considered to be 10 % of the output. Each r
ij
that is less than or equal to 10 % of the output is an important input of the matrix A. In this way, the values of 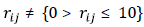 implies an entry that is not important. Important entries are transformed in some and the rest to zeros, which results in a new matrix w.
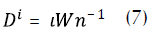
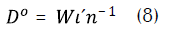
Using array w of the criterion of MFA and the ICs, innovation spreading is identified by the concept of complexity to measure the degree of absorption and propagation of innovations. Equations 7 and 8 show the degree of complexity that arises in the delivery and reception of innovations of a network. Also, the degree of over all complexity can be understood as the absorption and dissemination in the whole structure, calculated as the weight of the real links in the network among the total of possible links. This measure shows the degree of direct and indirect propagation between two divisions when they receive or deliver innovations.
Applications for Colombia and Mexico
Developed economies devote extensive resources to the promotion of RDI as a part of the development strategy followed by these economies. According to the Organization for Economic Cooperation and Development (OECD), the percentage of RDI with respect to gross domestic product (GDP) for the member countries was 2.4 % in 2015, while in Japan was 3.4 %, Switzerland 3.2 %, Australia and China 3 %, Denmark 2.9 %, Germany 2.8 % and the United States 2.7 %; however, in economies such as China, South Korea and Taiwan also intended considered amounts of RDI (2.1, 4.3 and 3 per cent, respectively) but in the case of Colombia and Mexico intended low amounts with respect of GDP, both economies share the goal of 1 % of GDP.
Figure 1 reveals that, in 2014, the Mexican economy was 0,3 percentage points above the investment that makes Colombia, as well as the forecasts by the Technological Development and Innovation Business of the National Council of Science and Technology (Consejo Nacional de Ciencia y Tecnología [Conacyt], 2013), the Colombian Observatory of Science, Technology and Innovation, and the National Administrative Department of Statistics (Departamento Administrativo Nacional de Estadística [DANE], 2015). For this type of investment expectations of the expenditure incurred by the countries will remain around 0.19 % for Colombia and 0.47 % for Mexico.
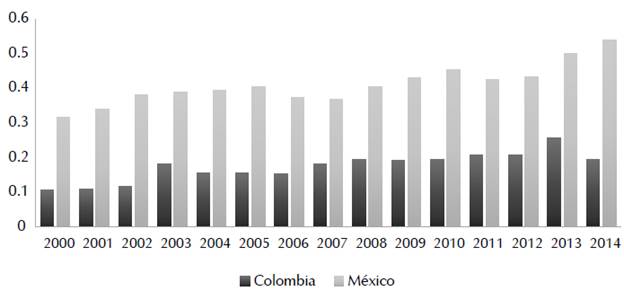
Figure 1 Percentage of research, development and innovation spending with respect to gross domestic product. Prepared by the authors with data from the World Bank (2017).
According to the World Bank, the average share of the RDI investment for the period between 2000 and 2014 in Colombia was 0.17 % while in Mexico was of 0.41 %. This investment has been provided mainly by government resources; for example, in the case of the Mexican economy, it is estimated that 60 % of RDI investments are made by the public sector and 40 % by private initiative. This investment represents 10 % of the potential impact on the product (Conacyt, 2013), while in the case of the Colombian economy, the government investment is 66.45 % and 33.55 % reaches the private sector (DANE, 2015).
The average growth of RDI investment for the period between 2000 and 2014 in Colombia was 10.4 % and in Mexico 6.3 %. Yet, as shown in Figure 2, Colombia had a spectacular fall in 2004 and 2014 and Mexico in 2006 and 2011. In the fall of RDI investment, the area affected has been research centers and the creation of specialized capital in both countries, covering about 80 % of expenditure; for example, according to the DANE (2015), the latter is focused on social and human sciences, followed by exact and natural sciences. Still, scientific production in the country only grows at a rate of 13 %.
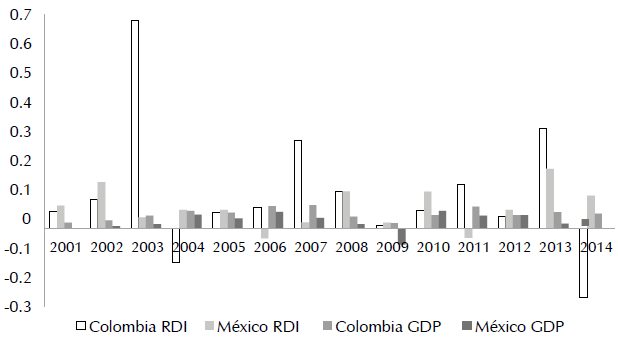
Figure 2 Growth of gross domestic product and investment in research, development and innovation. Prepared by the authors with data from the World Bank and the OECD (2017).
In the case of the Mexican economy, the investment being made in universities and research centers has been targeted to innovation strategic sectors such as telecommunications, energy production, and distribution and transport. Like Colombia, it maintains the distribution of scientific areas, as pointed out by Conacyt (2013); the supply of social and human sciences reaches 67.9 % of the total number of offers for scientific research, development and innovation.
Furthermore, according to the data published by the OECD measured in national currency, Colombia has an average output growth rate that almost doubles that of the Mexican economy (4.3 and 2.3 %, respectively). When considering the statistical correlation between output growth and RDI investment of each country, it seems that there are independent variables in Colombia since the correlation is 73 %, while in Mexico is 90 %. These results suggest that, in addition to output, there are other variables that affect the amount of RDI investment; for example, the political cycle.
Size differences between the economies determine growth and a stable and inverse relation between them, thus maintaining the axiom that a developed economy grows at a lower rate than other economies (Solow, 1956). In addition, as shown in Figure 2, the level of output of both countries dropped with the Great Recession, and the Mexican economy suffered the impact of such a phenomenon.
Output growth can be explained by the high share of the services sector, followed by the manufacturing sector, and a very small primary sector in both countries. Table 1 presents the growth rate and average output contribution for the 2003-2014 period broken down by sector in both economies. As it can be seen, the least significant sector in both cases is the primary sector.
Table 1 Output by Economic Activity. Constant Price for 2010 in National Currency
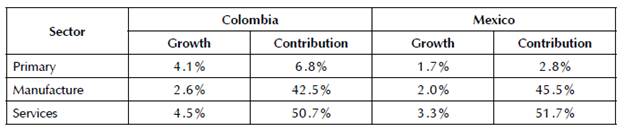
Note. Prepared by the authors with data from the OECD (2017).
According to Márquez (2010), a structural change in the Mexican economy has meant a loss in the share of the primary sector due to an increase in services; such increase is also explained by the loss of share of the industrial sector. Even though Colombia shows the same trend as Mexico, the Colombian primary sector grows and brings more to the output than Mexico.
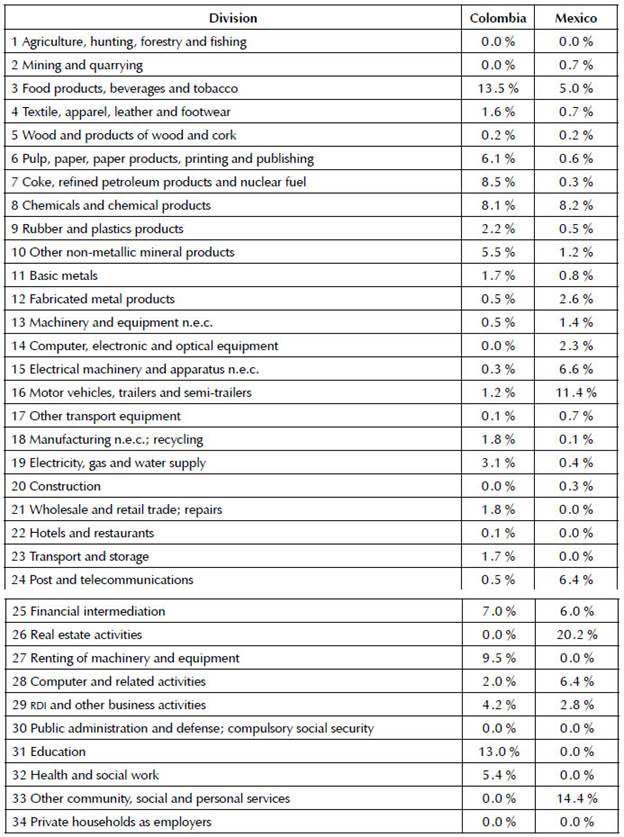
The RDI investment data disaggregated by divisions are shown in Table 2 for 2014, according to OECD data and DANE surveys to the manufacturing and service sectors. The information in Table 2 reveals that both Colombia and Mexico have five industry divisions that are above the average RDI investment; in the services sector, the Colombian data are more distributed and highlight six divisions of this sector with a high investment percentage.
In Mexico, the disaggregated RDI data of the services sector are not complete and the existing data highlights five divisions. Nevertheless, considering the subgroup of HTI, it turns out that only the division of chemical and pharmaceutical products in Colombia intended extensive resources in RDI, while in Mexico, the divisions Machinery and equipment and Computer, electronic and optical equipment consume large amounts of RDI.
Interindustry Networks and Innovation Spreading
To identify interindustry networks, this work used the IOTS published by the OECD for both countries in 2011. One advantage of using this database is that they have the same criterion to define economic divisions and the same level of disaggregation. According to the information in Table 2, the impact of RDI investment output has been simulated and the results are shown in Table 3 by total and internal transactions. Roughly, the economic structure of Mexico has a larger number of divisions than RDI investment allocations to above-average impact of the structure.
Table 3 Impacts of Research, Development and Innovation Spending in 2014 on Gross Domestic Product
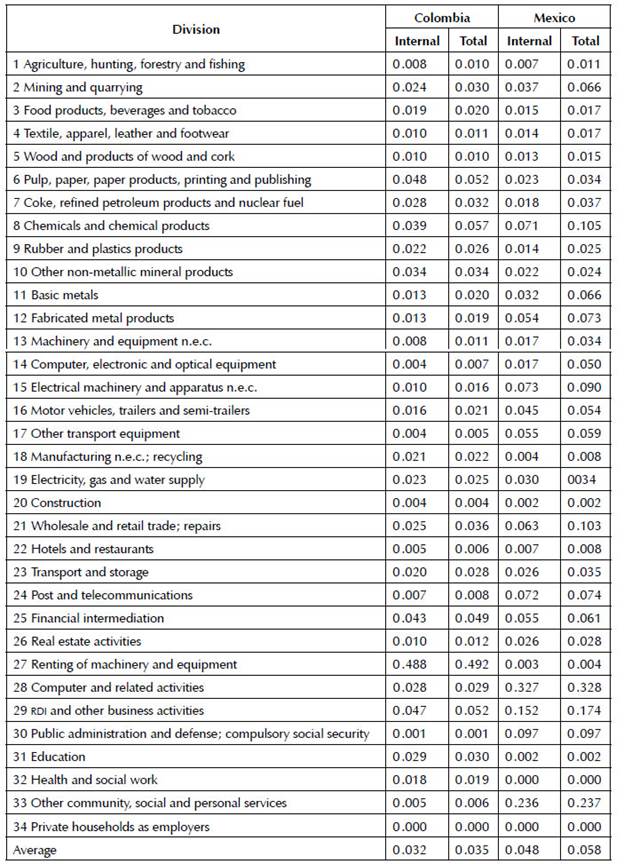
Note. Prepared by the authors with data from IOT 2011 by the OECD and DANE and the OECD RDI Spending 2014.
In the case of HTI, the impacts of RDI on the output highlights the division of chemical and pharmaceutical products in Colombia, with 0.06 cents per peso invested, while in Mexico it is 0.11. In addition, there are divisions of electrical equipment (0.09) and other transport equipment (0.06). The average impact of RDI investment in Mexico is greater than in Colombia by 0.023 cents per peso.
The results in Table 4 show the distribution of the sensitivity index, to identify ICS. The number of these and is that which is in the first limit of tolerance of the Table 4 and it indicates that Colombia expands the effects of a change to a greater number of divisions in proportion of inputs on the growth that Mexico, for a total of 1,156 entries in each type of transaction. Colombia has 137 more entries and Mexico 71.
Table 4 Distribution of the Sensitivity Index
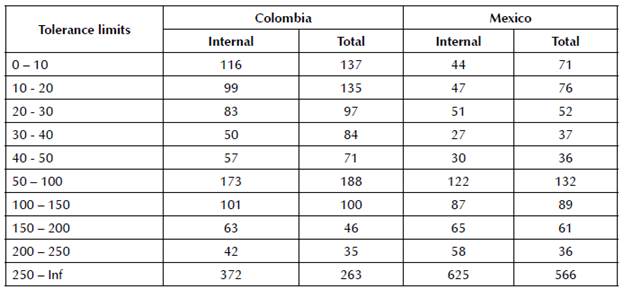
Note. Prepared by the authors with data from IOT 2011 by the OECD.
The qualitative results of the RDI impact on output and the change in the use of intermediate inputs are illustrated in Figures 3 to 6 in the case of total transactions since economies reach a higher degree of complexity in such transactions. Each of the networks represents the interaction of divisions in innovation spreading with different paths; however, the networks generally show that the Colombian economy has a more complex structure when spreading innovation and technological change and even the results of the two methodologies employed are similar (Figures 3, 4, 5, 6).
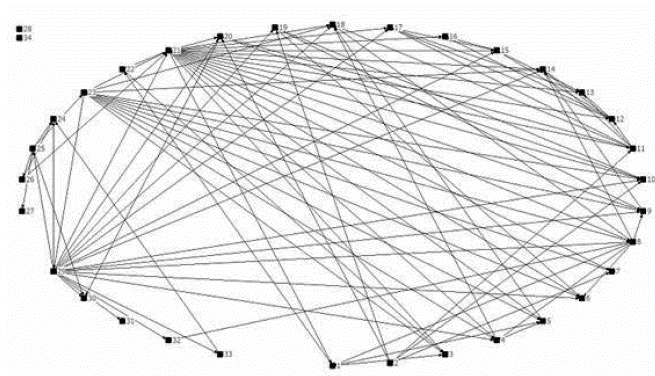
Figure 3 Propagation of research, development and innovation in Colombia. Prepared by the authors with data from IOT 2011 by the OECD.
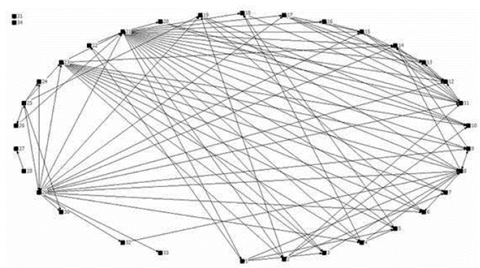
Figure 4 Propagation of input change in Colombia. Prepared by the authors with data from IOT 2011 by the OECD.
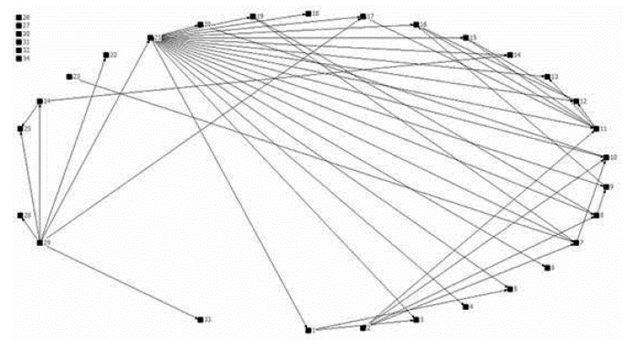
Figure 5 Propagation of research, development and innovation in Mexico. Prepared by the authors with data from IOT 2011 by the OECD.
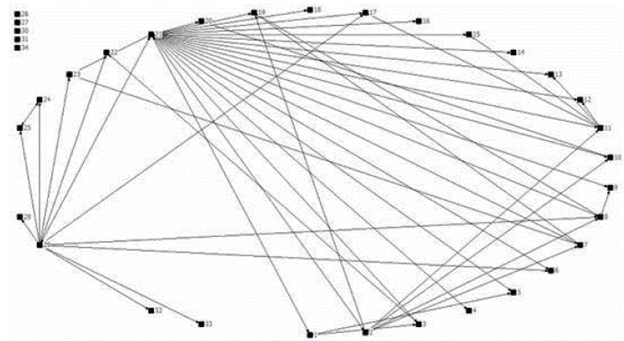
Figure 6 Propagation of input change in Mexico. Prepared by the authors with data from IOT 2011 by the OECD.
Table 5 and Table 6 specify the spreading of each division in the networks obtained in accordance with the MFA criteria and the ICS for internal exchanges and totals in Colombia and Mexico, respectively. As stated above, global spreading in Colombia with both procedures is similar. In Colombia, Division 29 Trade and 21 Research and development are the most influenced by innovations in the RDI propagation network. Using the IC approach, both innovation reception and dissemination are included among the ten largest ones.
Table 5 Degree of Innovations Spreading in Colombia
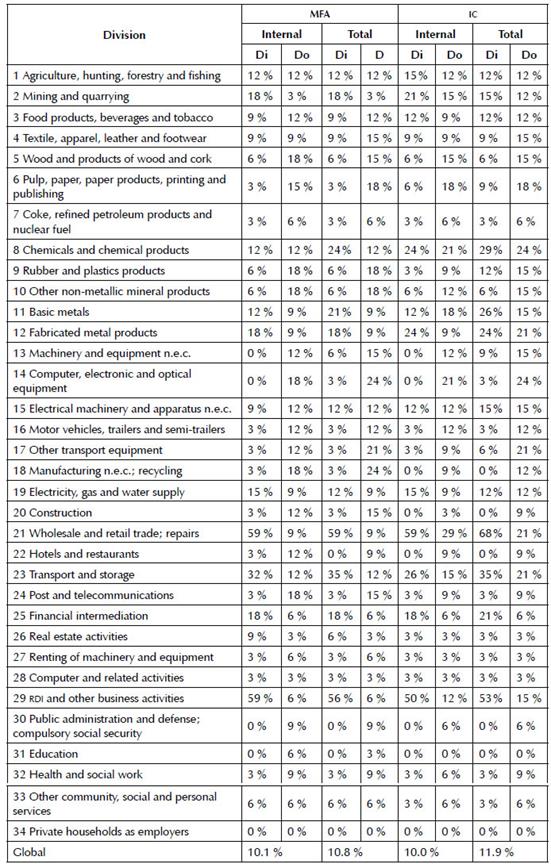
Note. Prepared by the authors with data from IOT 2011 by the OECD.
Table 6 Degree of Innovations Spreading in Mexico
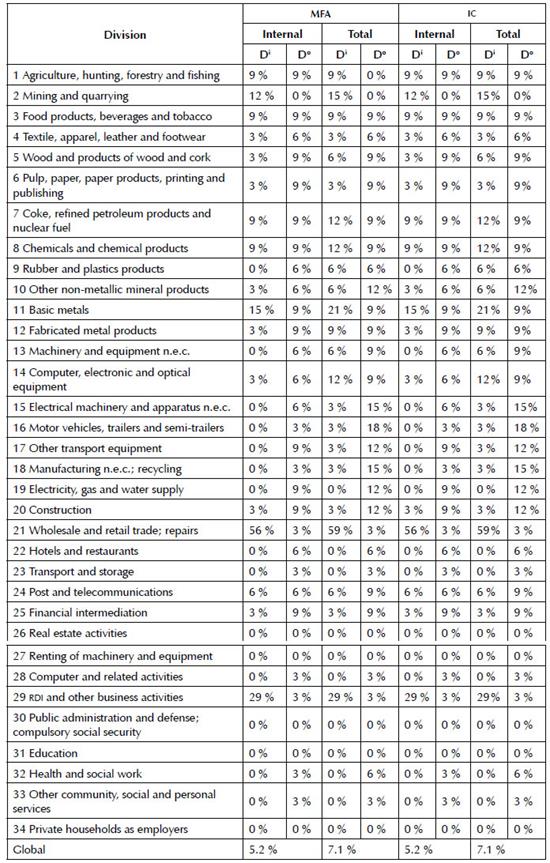
Note. Prepared by the authors with data from IOT 2011 by the OECD.
The RDI propagation network shows that the divisions of industry are those that disseminate the efforts of innovation, within the ten, divisions 1 Agriculture, farming and fishing, 8 Chemicals and pharmaceuticals (of the HTI group), and 23 Transport and storage in the reception and dissemination of innovations, in domestic transactions, while in the total, not stand out in spreading. In the case of the networks identified with ICS, if they meet such criteria, divisions 11 Basic metals and 15 Electrical equipment (HTI group) are added.
The results suggest that the HTI in Colombia spreads innovation prominently with other divisions of industry toward the primary and services sectors; however, in addition to the mentioned divisions of the industrial sector, 3 Food, beverages and tobacco and 12 Manufacture of fabricated metal products, except machinery and equipment are influenced.
In the case of Mexico, the overall dissemination rate indicates that, on average, each division sends or receives innovations with other two, half of which is happening in Colombia. Nonetheless, the divisions that stand out in innovation reception and dissemination are 1 Agriculture, farming and fishing; 3 Food, beverages and tobacco; 7 Petroleum products and nuclear energy; 8 Chemicals and pharmaceuticals (of the HTI group); and 12 Manufacture of fabricated metal products, except machinery and equipment. HTI diffusion in the networks reviewed stands out only in the case of imported inputs.
The results show that, in the Colombian and Mexican economies, innovation flows in the HTI little affect the productive structure. In both countries, division 8 Chemicals and chemical products has a spreading effect into the strategic economy since it receives and disseminates innovations; however, the rest of the HTI group is different in structure between the two countries. The results of total transactions in Colombia reveal that, in the HTI, dissemination occurs in division 14 Computer, electronic and optical equipment (to eight divisions), 17 Other transport equipment (to seven divisions), 13 Machinery and equipment (to five divisions), and finally, divisions 15 Electrical machinery and 16 Motor vehicles, trailers and semitrailers (to four divisions). In Mexico, these two divisions are the most widespread (to five and six divisions), followed by division 17 Other transport equipment (to four divisions), and finally, divisions 13 Machinery and equipment and 14 Computer, electronic and optical equipment (to three divisions).
These results reveal that, in Mexico, there is a less integrated structure and, like Colombia, the effects of RDI investment does not respond to interindustry linkages. In both cases, the HTI is composed of divisions whose companies have oligopolistic market structures. The strategic enterprises of division 8 Chemicals and chemical products are made up of transnational corporations such as Pfizer, Sanofi, Bayer, and Novartis (García, 2014; Ardila, 2014), which exploit the benefits of each economy. The effects of RDI investment on the HTI are differentiated across industries and countries.
The results of innovation diffusion are due to the different processes of opening economies, which generally respond to the corporate behavior of transnational corporations, the state of the host economy, and the international environment (Ramírez de la O, 1983), as the Mexican economy has experienced in the face of the current U.S. administration.
Conclusions
The premise with which this work began is appropriate and explains the results of the economies analyzed since they have revealed that HTI does not play a relevant role in coordinating the process of spreading innovation, as expected to happen with developed economies. Although, for both economies the analyzed economic networks reflect low levels of complexity, i.e. limited intersectoral linkages in the productive fabric, impact size and RDI investment amounts in respect of each country are similar.
Using the input-output analysis, it is possible to identify the path followed by a change in the conditions of final demand or payment of productive factors, as well as a change in the technical conditions per unit of output. The main techniques developed in the QIOA do not differ from the results; however, the Intermediate Output method seems to be more appropriate to spread innovations and, to a greater extent, technological change as this procedure is based on internal information of the productive structure. Moreover, MCFP depends on an exogenous variable, which may vary from one year to another. This occurs with the identification of the Intermediate Output.
Without a doubt, because of the low levels of RDI investment, both economies require to encourage such investment and stimulate funding by private initiative through taxable base incentives or other instruments. Even when economies are in a context of global production managed by transnational corporations, they should undertake efforts to increase RDI.
In addition to size differences in each economy, the dissemination of RDI investment is more extensive in the Colombian economic structure and, like the Mexican structure, most industrial divisions have considerable effects on the RDI diffusion of innovations. In the particular case of HTI, the Mexican economy spreads more products by innovation than Colombia but in no case receives innovations from other divisions, except when productive processes incorporate imported intermediate inputs.
In Mexico, the primary and service sectors play a dual role in spreading innovations and technological change: they deliver and receive innovations, while in Colombia receives more innovations. Consequently, this country also needs to focus efforts on creating innovations in such sectors. If the goal that economies pursue is to have greater effect on RDI investment, it will be necessary to increase the allocated amounts and incorporate a greater number of divisions so that their flow is greater and the impacts on output spread across more activities.

