


 Inglés (pdf)
 Articulo en XML
 Referencias del artículo
 Enviar articulo por email
 Citado por SciELO
  Citado por Google
  Similares en
SciELO
Similares en
SciELO  Similares en Google
 Permalink
1. Introduction
Climate change, which is a consequence of global warming, has caused worldwide concern and prompted the signing of international agreements aiming to reduce greenhouse gas (GHG) emissions due to the combustion of fossil fuels for generating electricity, heat, transport and a wide range of anthropogenic activities.
During 2010, 71% of the global GHG emissions was originated from the generation of electricity, the manufacture and construction sector, transport, combustion of other fuels and unintentional emissions.
Moreover, 13% of these emissions came from the agriculture and livestock sector and 6% from land-use changes (e.g., deforestation, afforestation and reforestation). According to the United Nations Economic Commission for Latin America and the Caribbean (CEPAL), at 2010 Colombia was the fifth largest contributor to carbon dioxide emissions in Latin America, which accounted for 0.39% (174,000 t CO2e) of the total global emissions (4,454,2000 t CO2e) [1].
Despite Colombia's low contribution to greenhouse gas emissions, the Colombian government proposed a regulatory framework (the Colombian Low Carbon Development Strategy - CLCDS), which was included in the National Development Plan 2010-2014 [2].
The objective of this framework is to achieve environmental sustainability by reducing GHG emissions caused by the currently expanding economic sectors. In this strategy, the oil palm agro-industry is of global importance in the Colombian economy despite the environmental impacts caused by its high water consumption, effects on flora and fauna during sowing, and the generation of effluents rich in organic matter and atmospheric pollution during the extraction process.
Estimating the Carbon Footprint (CF) is the first step to make in order to carry out a plan to reduce GHG emissions.
In this way, it allows the company (among other advantages) to improve their brand image, to respond to client, consumer and investor requests, to reduce the costs resulting from operational inefficiencies or noncompliance with environmental laws, and to identify possibilities of accessing new markets [3].
When GHG emissions information is used for the internal management of a company, the efficiency is improved because it enables the identification of processes and materials that require adjustments or should be replaced. Energy is one of the most important aspects in this regard; moving toward more efficient energy usage allows a company to reduce its carbon footprint and costs.
In the agriculture sector, profits are directly related to business sustainability because reducing GHG emissions mitigates the effects of climate change, thus maintaining favorable conditions for certain crops in specific locations over longer periods [1].
Literature on this subject presents different methodologies to assess the value of a CF indicator, taking into account the targeted application. The estimation can be conducted either as the Corporative CF, focused on the operational activities of the Company, or as the Product CF, through a Life-Cycle Analysis.
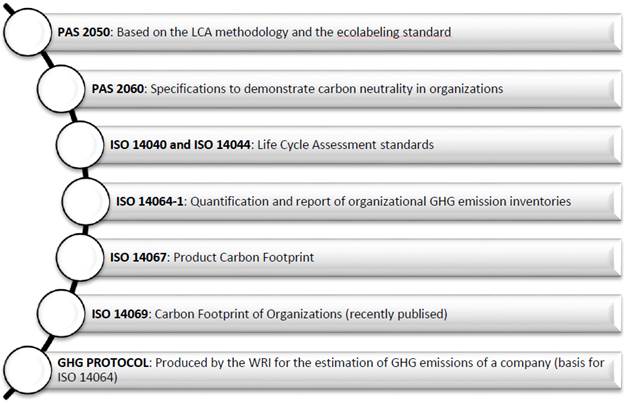
Figure 1 Methodologies to estimate the carbon footprint. Source: Own authorship, information from [4].
Figure 1 shows a number of standard protocols applied worldwide to accurately estimate the CF, according to information availability and the type of operations executed at a Company's facilities. In the case of the palm oil industry, scarce information lead us to choose the Corporative CF to conduct our estimation.
The oil palm is of African origin, but is currently cultivated in different regions of the world. The largest producers are Indonesia and Malaysia, which accumulate approximately 85% of the world supply. The Greenhouse gas emissions associated with processing of palm oil biodiesel are mainly caused by the discharge of 90% of the effluent from oil mills with high chemical oxygen demand (COD) values, which emit large amounts of methane [5].
There are some studies about the estimation of CF of Oil palm processing. For example [6] estimated GHG emissions o f an oil palm processing plant in Malaysia, using IPCC's emission factors. They included biodiesel production, transport within the value chain and electricity co-generation using natural gas. GHG emissions from wastewater treatment facilities were also included, with an emission factor of 33.6 m 3 CH4/t of crude palm oil CPO.
In Southeast Asia, [7] estimated that the CF of an oil extraction plant is in the range of 2.8 - 19.7 kg CO2e/kg CPO, including land use change, fossil fuel combustion and wastewater treatment in their analysis.
In Colombia, about 232 tonnes of crude oil per hour can be extracted from the fresh fruit bunches (FFBs) RFFs. In recent years the proportion of palm oil that is processed locally for biodiesel is increasing. Currently, the installed capacity of biodiesel plants is 486,000 tons per year [8]. The expanding national and international biofuel market has stimulated much interest in biodiesel production in Colombia, especially given that the government has the goal of producing biodiesel, by replacing 20% of diesel with biofuels by 2020 [2], that is why the government has promoted the expansion of oil palm plantations in several areas with a subsidy program [9]. In this way, it is important to investigate about the CF of this process.
In this way, we estimated the CF of a processing plant that produces CPO using the methodology established by the GHG Protocol Corporate Standard and the development of computer tools based on the mathematic equations defined by the Intergovernmental Panel on Climate Change [10]. In this way, the first step toward the proposed national strategy for low-carbon development can be achieved by the company.
This work aims to contribute, through a case of study, with an estimation of GHG emissions from palm oil extraction in Colombia given its importance for the value chain. It will also be useful for the palm oil industry to make environmental sustainability decisions, increasing their possibility to access new markets that require this indicator.
2. Materials and Methods
The CF was estimated of a processing plant that produces crude palm oil (CPO). The agro-industrial company is located in the Meta Department in Colombia, around 230 km east of Bogotá. This is one of the leading companies in the sector of oil palm and citrus fruit plantations in the country. The company owns a processing plant for producing palm oil, palm kernel and palm kernel cake. The processing capability of the plant is 36 t/h.
To quantify the emissions generated by the company during 2011, an approximation based on the corporate carbon footprint (CCF) was used. This estimation allows the company management to make decisions for improving the extraction process of palm oil and to reduce GHG emissions. Unlike the product carbon footprint, which corresponds to the total GHG emissions of a product during its life cycle, the CCF includes GHGs generated during the main operations conducted by an organization and its subsidiaries and the processes linked to those operations [11]. The different approaches for obtaining an estimate are defined in the Greenhouse Gas Protocol. The scope and the data required for each approach are different. However, according to the IPCC, there are no differences between these approaches with regard to the equations proposed for estimating GHG emissions
The CF estimated for the studied palm oil processing plant is based on standardized approaches and principles that are internationally adopted, such as the GHG Protocol, which is accepted by companies, non-governmental organizations (NGOs), governments and other entities. The protocol was developed by the World Resources Institute (WRI) and the World Business Council for Sustainable Development (WBCSD) [12].
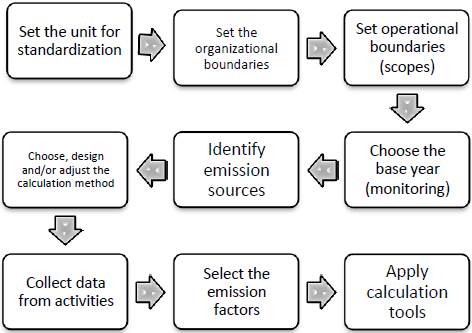
The GHG Protocol is used as a guideline to define the objectives and the scope of the study and to adapt decision trees in accordance with the information available for the company. From the review of the GHG protocol, a methodology is adapted to obtain a GHG emission inventory that can be used as an easy guide to quantify the CCF of similar organizations (Figure 2). This methodology entails reviews of the literature, the use of secondary information and the gathering of data from emission sources, which enable the application of equations adjusted for individual case studies.
Unit for standardization: Due to the size of the figures used in the Colombian palm oil sector and in order to facilitate the calculations at each stage of the process, it was proposed to establish the ton of carbon dioxide equivalent (tCO2e) as the functional unit.
This unit allows the comparison and analysis between the amount of emissions generated in the different activities of the process, regardless of the type of gas emitted or the fuel used.
2. 1 Organizational Boundaries
The GHG Protocol allows establishing two different approaches to generate consolidated corporate reports on GHG emissions: Stock Ownership Approach and Control Approach. This latter approach allows the company to account for 100% of its GHG emissions, attributable to the operations on which it exercises control. It should not account for GHG emissions from operations of which the company owns a stake but does not have control of them.
For this study, the operational control approach was taken into account for the emission inventory of the three selected activities, taking into account that the benefit plan is under its control, and information on the three activities selected is available for the base year.
2.2 Operational Boundaries
The protocol defines three approaches in order to classify direct and indirect emissions, improve transparency and provide utility in setting business goals. Scope 1 is related to direct emissions that occur from sources that are owned or controlled by the company. For example, emissions from combustion in boilers, furnaces, vehicles, etc. As part of the application of the tools developed, reference was made exclusively to the accounting of the emissions of this scope, taking into account the availability of the information. Scope 2 is associated with indirect GHG emissions from electricity consumption, which includes emissions from the generation of electricity purchased and consumed by the company.
These emissions occur physically in the plant where the electricity is generated and are classified as a special category of indirect emissions, reasons for which were not taken into account in this study. Scope 3 (other indirect emissions) is an optional reporting category that allows for the inclusion of all other indirect emissions
Fugitive emissions Direct CO2 emissions from biomass combustion should not be included in Scope 1 and should be reported separately. However, for the purposes of the work developed, the consumption of waste by the boiler was included, in order to have a more complete indicator.
2.3 Base year
For this study, the base year was taken as 2011, since there was information related to the fuel consumption of the transport fleet and the electricity generating plants. In addition, for that year had data of the treatment system of waste water and an estimate of the consumption of fiber and husk by the industrial boiler.
2.4 Emission Sources
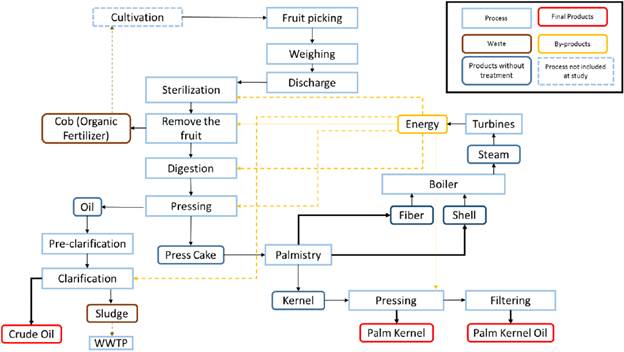
The estimation was applied to the required processing activities for fresh fruit bunches (FFBs) harvested from the plantations. This includes all activities from transportation to the treatment of wastewater generated during the production process (Figure 3). Next, the contribution of each source to the total emissions was obtained.
It is important to clarify that the study system does not include palm crop because the cultivation of oil palm in areas with relatively low carbon reserves (i.e., agricultural or grazing land), like in Meta, generates an increase in carbon stocks and therefore greenhouse gas emissions are avoided. In addition, the availability of company information and the operational boundaries were taken into account in determining the emission sources.
These emissions are mainly the result of the following types of activities carried out by the company: - Generation of electricity, heat or steam - Physical or chemical processes -Transport of materials, products, waste and employees [5].
The main sources of emissions was identified in the visit to the palm oil extraction process, in order to facilitate the collection of data during the field work inside the benefit plant.
2.5 Data Collection
A review of the Colombian emission factors was carried out, so that the estimation of HCC was carried out in the most correct way possible. The FEs proposed by the Mining and Energy Planning Unit from Colombia for its acronym in Spanish UPME for some fuels were taken and the data proposed by the IPCC were revised, taking into account that they are reference values and can be used for generic estimations when the information is not available.
Once the Emission Factors were selected, 3 visits were scheduled between the months of August and November, to know the administrative structure and the processes carried out within the company. Information capture formats were developed for each of the emission sources identified in oil palm extraction, and interviews were conducted with management and operational staff.
In this study only mechanical transport was considered. The average distance of transport by truck and tractor is 19 and 2.6 km, respectively [8].
Fuel consumption is determined by periodically measuring the volume required for each equipment. In the case of the boiler, the fiber and palm kernel shell (PKS), which are burnt for 10 min in normal production conditions, are sampled. In the power plants were consulted the formats containing the daily consumption of biodiesel B7, a blend of 7% palm biodiesel with 93% petroleum diesel.
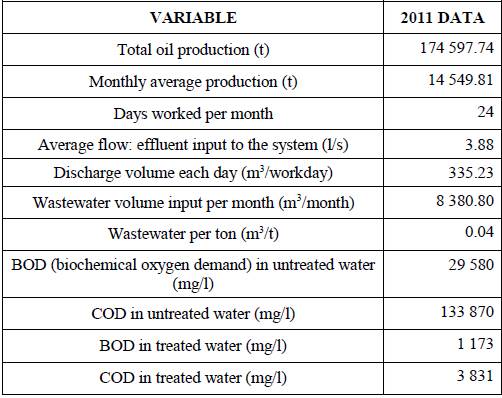
The fraction corresponding to the total generated amount of each waste is obtained considering the fruit yield (2/3 from the total amount of waste generated corresponds to PKS and 1/3 to fiber). This information is obtained from [13], which has been endorsed by Fedepalma, the National Federation of Oil Palm Growers and Cenipalma, the Corporation Research Center in Palm Oil in Colombia [14]. The information gathered from field research is shown in Table 1.
2.6 Calculating the Carbon Footprint CP
The equations and parameters recommended by the IPCC in 2006 are revised to develop calculation tools based on balance equations that use the information available from the database and national entities as inputs and that consider the features of Colombian fuels.
The equivalent CO2e emissions from cars and heavy machinery used at the processing plant are determined as follows:
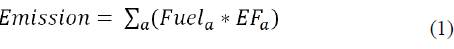
Emission: CO2, N2O, and CH4 emissions (kg)
Fuel a : Amount of energy in the fuel consumed (TJ)
EF a : Emission factor (kg/TJ); equivalent to the carbon content in the fuel multiplied by 44/12 emissions of N2O and CH4 requires to use the value of global warming potential for each of them.
Type of fuel: Gasoline, diesel, or natural gas.
7. Fixed sources of combustion
To determine the methane and nitrous oxide emissions, the equations proposed by the IPCC for level 2 are applied. In this case, information related to the physicochemical properties of the fuel, the type of vehicle and the emission control technology are used,taking into account the following:
Determine the amount of fuel consumed per type of fuel for land transport, using national data or, alternatively, International Energy agency (IEA) or United Nations (UN) international data sources (all values must be declared in terajoules).
For each fuel type, multiply the amount of fuel consumed by the appropriate CH4 and N2O default emission factors. The default emission factors can be found in Section 3.2.1.2 (Emission Factors).
Emissions of each pollutant are added to all types of fuel.
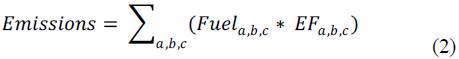
Emission: N2O, and CH4 emissions (kg)
Fuel a,b,c : Amount of energy in the fuel consumed (TJ) related to the activity of a specific mobile source
EF a : Emission factor (kg/TJ); equivalent to the carbon content in the fuel multiplied by 44/12
EF b : Type of vehicle (e.g., automobile, light-duty truck, heavy-duty truck, or bus)
EF b : Emission control technologies (such as non-controlled catalytic converters)
From data gathered by field research, the emissions from combustion sources are estimated by accounting for the fact that the lower heating value (LHV) of each fuel type (diesel, fiber and PKS) must be used to determine the emission factor:

Emission: Greenhouse gas emissions for each gas and fuel (kg GHG)
Fuel a : Energy from fuel burned (TJ)
EF a : Default emission factors for each greenhouse gas in each type of fuel (kg gas/TJ); in the case of CO2, the oxidation factor of carbon is included and assumed to be 1. Type of fuel: Gasoline, diesel, natural gas, or biomass
The LHV is defined as the maximum heat that can be released from a fuel when it has been completely burned and
2.8 Wastewater Treatment System
The wastewater treatment system is the final step in the process flow of the processing plant and represents a source of GHG emissions due to the methanogenic activity conducted in the anaerobic lagoons. After obtaining the area and volume of the open lagoons, the system capacity and the COD are determined using:

TOW i : Total degradable organic load in industrial wastewater i (kg COD/year)
Pi: Total industrial production of company i (t/year)
Wi: Wastewater generation (m3/t product)
COD i : Chemical oxygen demand (industrial degradable organic component in wastewater; kg of COD/m3) The following equation, which was proposed by the IPCC, is used to determine the EF for methane in the oxidation lagoons by accounting for their depths:

EF j . Emission factor for each wastewater treatment system and/or disposal system (kg CH4/kg COD)
B0: Maximum capacity for methane production (CH4/kg of COD)
MCF j . Methane correlation factor (fraction).
j: Wastewater treatment system and/or disposal system
The company under study uses 3 anaerobic lagoons and 2 facultative lagoons, all of which exceed a depth of 2.5 m. Moreover, the following equation links the results obtained ttein Equation 5 with the estimated emission factor and can be used to obtain the organic degradable load
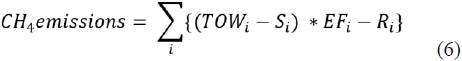
CH 4 emissions: CH4 emissions for the inventory year (kg CH4/year)
TOW i . Total degradable organic matter in wastewater generated by industry i during the inventory year (kg COD/year)
S i . Organic fraction removed as sludge for the inventory year (kg COD/year)
EFi. Emission factor for industry i (kg CH4/kg COD) corresponding to the wastewater treatment system and/or disposal system used in the inventory year; if a company uses more than one treatment system, this factor corresponds to the weighted average
R i . Amount of methane recovered for the inventory year (kg CH4/year)
i. Industrial sector
In the case of the degradable organic matter in the wastewater, the sludge removed from the lagoons should be included, which, for the present study, is determined to be 0 because this information is unavailable for 2011.
Furthermore, the CH4 recovered by the treatment system should be considered when estimating the emission factor. However, there is no methane recovery in these lagoons, and the gas is emitted entirely into the atmosphere. For this reason, Ri is considered to be 0.
To estimate the GHG emissions using Equations 1 to 6, all the data obtained during the visits to the processing plant are entered into an MSExcel® spreadsheet. The emission factors used are those obtained by the Mining Ministry and the Mining and Energy Planning Unit. This information is available via the web through the Colombian Mining Information System SIMCO; Methane emissions must be converted to CO2e with the global warming potential [3].
An assessment of the emission sources at the processing plant during 2011 resulted in an estimate of the CCF, i.e., 115352 t of CO 2 e.The contributions of each stage of the process are summarized in Table 3.
3. Result and Discussion
The visits to the plant enabled the identification of 4 different types of emission sources (Table 2).
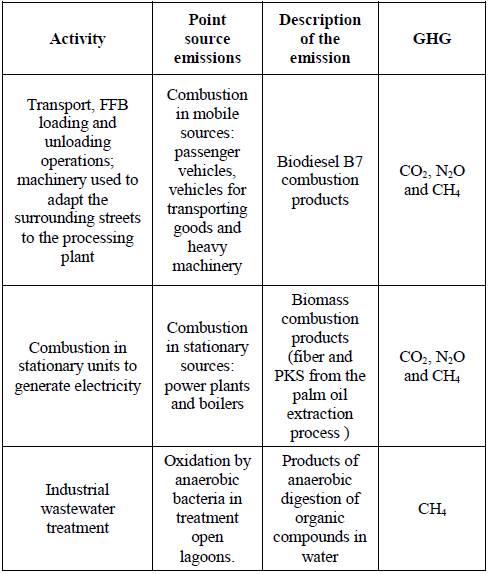
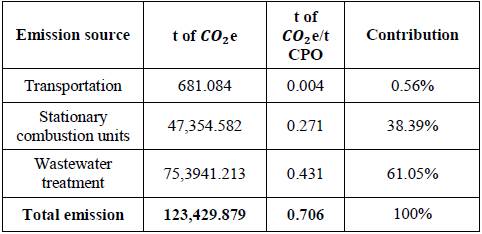
The main contribution to the CF corresponds to emissions from the wastewater treatment system because methane gas is emitted by anaerobic oxidation through this process. This gas has a global warming potential that is 25 times higher than that of carbon dioxide.
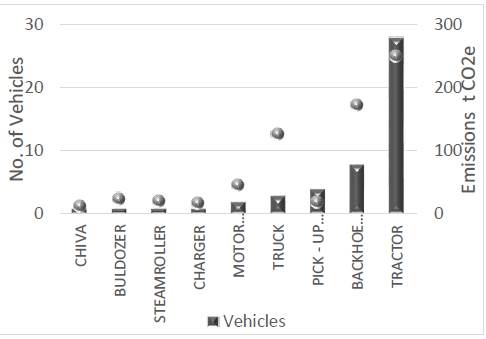
Considering the biodiesel B7 consumption in 2011 for vehicles of the company, the transportation fleet emitted a total of 681 t CO2e in the year considered. Figure 4 shows the transportation fleet emissions in relation to the number of each type of vehicle owned by the company
Tractors are responsible for the highest GHG emissions related with movil sources. because they are the largest vehicles in the transportation fleet and their daily operations are essential for fundamental activities of the processing plant.
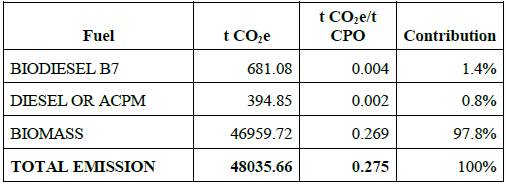
The results demonstrate that the total emission from the boiler is 46,960 t [(CO)]_2e for stationary combustion sources. By comparing the emissions for different fuels (Table 4), the biomass combustion in the boiler accounts for 98% of the emissions from fuel consumption inside the processing plant, which results in 269 kg of GHG per ton of produced CPO.
It is important to clarify that direct CO2 emissions from biomass combustion should not be included in Scope 1 and should be reported separately. However, for the purposes of the work developed, the consumption of waste by the boiler was included, in order to have a more complete indicator.
A total of 395 t of CO2e was released from power plants during 2011. Expressed as a percentage, the Caterpillar C27 power plant accounted for 55% of the total emissions from this equipment. Moreover, the Perkins engines power plant accounted for 19% of the total emissions only because they are able to generate less electricity.
With these results, a comparison between the amount of CO2 storage in oil palm plantations and the total emissions released during the palm oil extraction process can be used to obtain the amount of CO2 absorbed or released into the atmosphere, which can be addressed by further research.
The carbon footprint of the plant was found to be 115.352 t CO2e, which is equivalent to 660 kg CO2e/t CPO. Figure 5 compares this result to results obtained by other authors.
In Thailand, [17] performed an assessment of the process from bunch reception to oil extraction in 14 processing plants. The sampling accounted for 34.6% of the total palm oil production in that country. The following variables were analyzed in their study: the acquisition of raw materials, the chemicals used, the energy used, transport and the handling of wastewater. They found that the average GHG emission for the 14 plants wasn1.198 kg CO2e/t CPO. The results for each scenario were as follows (expressed as kg CO2e/t CPO): i) extraction with biogas recovery: 750; ii) extraction without biogas recovery: 1087; iii) average for Thailand: 871; and iv) best case scenario: 440.
Furthermore, [18] gathered data from a 14000 ha plantation in Colombia. They conducted an analysis of the life cycle using SIMAPRO® 7.1 (PRé Consultants, Amersfoort, Netherlands). Based on a sensitivity analysis, they determined the GHG emissions for different scenarios and timescales. They also assessed the following variables: land-use changes, the use of fertilizers, oil extraction and wastewater treatment systems. Finally, [6] in Malaysia and [7] in southern Asia obtained emission values for lagoons. Their results were 33.6 m3CH4/t CPO and 2.8 - 19.7 kg CO2e/kg CPO, respectively.
To improve the analysis, it is important to compare the emissions obtained for the anaerobic oxidation open lagoons in the present study with the results obtained for Malaysia, considering that this source is the primary source of GHG emissions. Considering a density of0.668 kg/m3 for methane under standard conditions (i.e., temperature and pressure of 25°C and 101 325 Pa, respectively), the volumetric emission is 23.1 m3CH4/t CPO. This value is less than that obtained by [6].
In the present study, wastewater treatment was carried out using 3 anaerobic lagoons, which were analyzed to obtain the total emissions for the system (facultative lagoons were not included). This value is considered to be very low if the amount of oil processed in the plant is considered. Using the information provided by the company, the system has a capacity for treating effluents of 0.58 m3/t CPO, whereas in Malaysia [6], the system receives 3 m3/t CPO of generated effluents.
4. Conclusions
By identifying, measuring and calculating the GHG emissions from mobile and stationary combustion sources and from the anaerobic oxidation process in wastewater treatment, a carbon footprint of 660 kg CO2e/t CPO was determined for the studied palm oil processing plant in 2011.
Based on the variables considered for estimating the CF, the GHG emissions from the studied company are slightly lower than the average GHG emissions from the palm oil sector in other countries. Emissions from the conversion of land to oil palm plantations and the use of agrochemicals were not included in this study. However, these sources should be evaluated in future years.
Biomass is the fuel responsible for the highest emissions inside the processing plant (46 959 t CO2e).This fuel comes from the waste produced during the stripping of palm fruits. The fiber consumption accounts for 68% (32 020 t CO2e) of the emissions from the boiler, while the PKS account for 32% (14 939 t CO2e).
After quantifying the carbon footprint, the company should analyze and propose strategies to reduce their emissions, especially during the wastewater treatment process because the methane generated in the open lagoons can be used to generate electricity via cogeneration. Periodic sludge removal will also reduce their emissions.
Based on a comparative analysis of the emissions from the oxidation lagoons, it is necessary to assess the ability of the system to process wastewater generated during FFB processing because higher amounts of effluent per ton of produced CPO have been reported in Malaysia.

