


 Inglés (pdf)
 Articulo en XML
 Referencias del artículo
 Enviar articulo por email
 Citado por SciELO
  Citado por Google
  Similares en
SciELO
Similares en
SciELO  Similares en Google
 Permalink
INTRODUCTION
The central palm zone of Colombia is located in the departments of Santander and Cesar and covers approximately 129,112 ha (Fedepalma, 2013). The area exhibits wide variations in topography, climate, and soils, which are reflected in differences in crop yield potential (González-Orozco and Pesca, 2022). However, on average, the region experiences a temperature of 26°C, an annual precipitation between 2,000 and 4,000 mm, 1,607 h of sunshine, and a relative humidity of 77.2% (Romero, 2007).
In this region, the diversity in soil formation processes has resulted in a wide variability in soil characteristics. There are soils with incipient development, such as Inceptisols, as well as soils with a high degree of weathering, such as Oxisols (González-Orozco and Pesca, 2022). This diversity in soils affects their chemical and physical properties, which affects their potential for oil palm cultivation and productivity (Yeo et al., 2020).
The main objective of oil palm mineral nutrition is to achieve increased production through efficient fertilization management (Dassou et al., 2022). To reach this goal, it is necessary to accurately determine the impact of production limitations (Cantarutti et al., 2007). In oil palm cultivation (Elaeis guineensis Jacq.), as with other agricultural land uses, productivity and profitability are closely linked to soil characteristics on which plantations are established (Yeo et al., 2020) and potential crop yield can only be achieved through proper management of mineral nutrition (Nair, 2019).
Usually, oil palm yield responds positively to fertilizer application. However, significant differences in development and yield are observed among areas with different soil and climatic characteristics, as well as differences in the nutritional requirements of mature and immature states (Nair, 2019).
Currently, accounting for almost 30% of maintenance expenses (Guzmán and Betancourt, 2007), it is essential to develop knowledge to build tools that can help identify accurately limitations and reduce these costs through the application of appropriate quantities, at the right time and according to their location, to enhance production (Pardo and Ocampo-Peña, 2019).
The development and the use of diagnostic methods have been very useful in agriculture to understand the nutritional needs of crops and achieve maximum economic yield. For proper fertilizer recommendation, it is necessary to identify which nutrients are most limiting for production (Pardo and Ocampo-Peña, 2019). According to Crespo-González et al. (2020), soil and foliar analysis results can be used to identify nutrient deficiencies and excesses, which serve as the basis for economically based fertilizer recommendations.
Leaf mineral content analysis is a diagnostic tool for assessing the nutritional status of oil palm and plays a key role in managing fertilizer application in commercial-scale cultivation (Mirande-Ney et al., 2020). Leaf tissue analysis provides specific information on element concentration (Marschner, 1995). It helps to anticipate any deficiencies or excesses of elements, but it requires appropriate procedures for data interpretation due to the dynamic nature of tissue composition (Rengel et al., 2022). Leaf mineral composition is significantly shaped by factors such as leaf age, plant maturity, and various interactions that provide insights into nutrient absorption and translocation processes (Ruíz-Bello and Cajuste, 2002).
In oil palm cultivation in Colombia, according to Romero et al. (2007), different procedures are implemented to establish fertilizer recommendations. These procedures are grouped into four categories: i) The method based on critical levels in soil and leaves; ii) The method based on optimal nutrient ratios; iii) The method based on agronomic response functions in yield; and iv) The nutrient balance method. Among these, the method based on critical levels in soil and leaf tissue is the most commonly used in the palm industry.
The DRIS methodology is developed by comparing the obtained results with reference tables of critical or optimal levels considered appropriate for the crop's conditions. After this comparison, the difference in element concentration is replenished through the application of fertilizers (Mirande-Ney et al., 2020).
Alternative methods for interpreting the analyses encompass commonly employed approaches, such as the critical level and sufficiency ranges. These methods define the minimum nutrient contents that are associated with peak growth or productivity (Mirande-Ney et al., 2020). Additionally, according to Oberthür and Arenas (2019), the main advantages of using the critical level methodology are the ease of interpretation and the independence between nutrient levels, meaning that the concentration of one nutrient does not affect the behavior of another. However, the DRIS method also has some limitations, including the fact that it does not identify which nutrient or nutrients limit production, and it cannot determine if the deficiency is acute or not (Villaseñor et al., 2020).
According to Villamil et al. (2021), there is generally no specific point of optimal productivity, but rather a certain range, due to the increase in production obtained with increasing nutrient doses. On the other hand, foliar diagnosis using sufficiency ranges is relatively less affected by small local environmental effects and plant-related effects compared to the critical level (Villaseñor et al., 2020), as the limits of sufficiency ranges are broader. Therefore, it is considered sufficient to recommend desirable nutrient levels to maintain concentrations slightly above the critical level.
An interpretation for tissue analysis was proposed by Beaufils (1973), called the Diagnosis and Recommendation Integrated System (DRIS). It is based on calculating an index for each element, considering their relationships with each other (Souza, 2011). This method involves comparing the ratios of each pair of nutrients, which is why it is called a bivariate method (N/P, P/N, N/K, K/N...) (Villaseñor et al., 2020), with the corresponding average ratios based on pre-established norms from a reference population.
The DRIS method expresses the results of nutritional diagnosis through indices, which represent the effect of each nutrient on the plant's nutritional balance, based on a numerical scale (Njukeng et al., 2013). When negative values are assumed, it is interpreted as a deficiency of that element compared to the others, and conversely, when positive values are assumed, it indicates excess (Villaseñor et al., 2020; Reis et al., 2002). The closer the indices are to zero, the closer the plant is to nutritional balance for the studied element (Wadt, 2005). This allows to classify nutrients depending on their importance in limiting production and provides an indicator of the intensity of the demand for a specific nutrient in the plant (Beć et al., 2020).
The DRIS methodology provides important information known as the Nutritional Balance Index (NBI), which consists of the sum of the DRIS indices absolute values for each nutrient, assessing the nutritional status of each individual (Chaleshtori et al., 2021). In this regard, it can be said that the lower the NBI, the better the nutritional status of the studied population allowing to determine the degree of nutritional balance or imbalance and enables the comparison of nutritional balance between different samples and crops (Villaseñor et al., 2020).
Similarly, it is possible to calculate the Mean Nutritional Balance Index (MNBI), which results from the sum of the DRIS indices for each element divided by the total number of elements under study. One of the difficulties in using the Mean Nutritional Balance Index (MNBI) as a diagnostic technique is that the absolute values of the calculated indices can vary with the number of binary relationships involved, without allowing for the evaluation of the fertilization response potential in each case (Chaleshtori et al., 2021). To improve the interpretation of DRIS results, Wadt (1996) has developed the potential response method. According to the recommendations of Wadt et al. (1998), the fundamental concept for nutrient addition is the potential response to fertilization, which should be considered as an adjustment in the nutrient doses to be applied.
Using the DRIS method, five categories of response probability to nutrient application via fertilization are established by comparing the calculated index for a specific nutrient with the Mean Nutritional Balance Index (MNBI). As outlined by Wadt (1996) and Chaleshtori et al. (2021), these five probability classes for response to fertilization are defined as follows:
Class 1: Positive response (P). This is likely to occur when the DRIS index for a particular nutrient, which is the lowest value, is simultaneously greater than the MNBI.
Class 2: Positive or null response (PZ). This is likely to occur when the DRIS index for a nutrient is negative and, although greater than the MNBI, it is not the lowest value.
Class 3: Null response (Z). This is likely to occur when the DRIS index for a nutrient is less than or equal to the MNBI.
Class 4: Negative or null response (NZ). This is likely to occur when the DRIS index for a nutrient is positive or greater than the MNBI, but not the highest index value.
Class 5: Negative response (N). This is likely to occur when the DRIS index for a nutrient, which is greater than the MNBI, is the highest among all DRIS indices.
Therefore, the aim of this study was to establish the interpretation of results obtained using the DRIS technique for oil palm cultivation under the conditions of the central palm zone in Colombia, as well as to determine critical levels and sufficiency ranges based on DRIS indices and the concentration of each element in leaf tissue.
MATERIALS AND METHODS
The field data was obtained from commercial oil palm plantations on 113 ha planted in 2001 with IRHO material, located in the municipality of Sabana de Torres at 110 m a.s.l. The area has an annual precipitation ranging between 2000-4000 mm and an average temperature above 24°C (IGAC, 1982). The soil was classified as Fluventic Dystrudepts and is located in the piedmont landscape. The terrain type consists of tablelands, hills, and moderately undulating surfaces with slopes between 7% and 12% (IGAC, 1982; Romero et al., 2007).
The soil chemical characteristics in the experimental area showed acidic conditions, with an average pH value of 4.24, aluminum saturation greater than 50%, medium base saturation of 35%, and aluminum content of 0.69 cmolc kg-1. The phosphorus content was recorded at 32.39 mg kg-1. The exchangeable bases Ca, Mg, K, Na exhibited low values (0.52, 0.2, 0.14, and 0.05 cmolc kg-1, respectively), as well as the micronutrients, which had native contents considered deficient.
Sampling was performed using a rigid grid with a distance of 100x100 m. Plant tissue samples were taken following the methodology proposed by Cenipalma, using leaflets from the middle part of the 17th leaf rank for adult plants. These samples were taken in May 2013, during a period of low precipitation and not close to fertilization to reduce result variability as reported by Santacruz (2004).
For the leaf tissue analysis samples, K, Ca, Mg, Na, Fe, Cu, Mn, and Zn contents were determined through dry digestion and atomic absorption, P and B were analyzed using colorimetry, N was determined using wet digestion and Kjeldahl method, and S was measured using turbidimetry.
After sampling, production data were recorded for each point. Given the close correlation between oil palm production and rainfall, to ensure the accuracy of the data, six readings were collected, with three taken during the rainy season (March-April 2013) and three during dry periods (June-July 2013). The mean of the six readings was multiplied by the planting density per hectare, which corresponds to 143 palm trees per hectare. The resulting value was multiplied by 24 since this represents the number of harvests per year.
For the establishment of the DRIS norms, values from the results of leaf tissue analysis of the reference population were taken into account, specifically those related to yields equal to or greater than 31.1 t ha-1.
For the high-yielding population, direct and inverse nutrient ratios were calculated pairwise for the reference population. The direct ratio is where the nutrient in question appears in the numerator (e.g.: A/B), while the inverse ratio is where the nutrient of interest appears in the denominator (e.g.: B/A). For each ratio, the mean (x), standard deviation (s), and coefficient of variation (CV) were calculated.
The determination of the norm to be used in the calculation of the DRIS functions (A/B or B/A) was done using the ratio of variances or F-value method. This method compares the variances of the low-yielding population (non-reference) and the high-yielding population (reference). The norm with the highest variance ratio (S2) was chosen.
After calculating the functions, the calculation of the DRIS indices was performed following the general formula proposed by Beaufils (1973), where for nutrient A (Eq. 1):
Where: Z: Number of functions corresponding to the Nutrient index. B, C, D, N: Any element with which it is possible to make the comparison.
The interpretation of the DRIS indices was carried out using the methodology proposed by Wadt (1996), in which the indices were grouped into three classes based on the DRIS indices of each nutrient and the IBNm, as shown in table 1. Additionally, the interpretation of the DRIS indices was also performed by classifying the obtained values for each nutrient according to the fertilization response potential developed by Wadt (1996) (Tab. 2).
Table 1. Criteria for interpreting the DRIS indices.
| Criteria | Nutritional status |
|---|---|
| I DRIS A < 0 y | I DRIS A| >IBNm | Deficient (LF) |
| | I DRIS A| ≤ IBNm | Balanced (NL) |
| I DRIS A > 0 y | I DRIS A| >IBNm | Excess (LE) |
Table 2. Criteria for determining the potential fertilizer response.
| Nutritional status | Criteria | Fertilizer response type |
|---|---|---|
| Highly deficient | I DRIS A< 0, | I DRIS A| >IBNm y IAes el índice de menor valor | Positive, with high probability (p) |
| Deficient | I DRIS A < 0 y | I DRIS A| >IBNm | Positive, with low probability (pz) |
| Balanced | | I DRIS A| ≤ IBNm | Null (z) |
| Excess | I DRIS A > 0 y | I DRIS A| >IBNm | Negative, with low probability (nz) |
| High excess | I DRIS A> 0, | I DRIS A| >IBNm y IA es el índice de mayor valor | Negative, with high probability (nz) (n) |
Determination of critical levels based on DRIS indices
The determination of critical levels consisted in the determination of the optimal nutrient content values. This method was based on determining the statistical correlation models between nutrient content and DRIS indices, and then finding the value of the element by equating the model to zero, considering that an element is in balance when its DRIS index reaches the mentioned value.
Determination of sufficiency ranges based on DRIS indices
The determination of Beaufils' sufficiency ranges consisted of determining optimal ranges of nutrient content for interpreting nutrient critical levels. This method involves determining the ranges through statistical correlation models between nutrient content and DRIS indices. Beaufils (1973) considered that based on the optimal values of DRIS indices, the standard deviation intervals of DRIS indices can be determined for each range of nutritional status evaluation. Following this criterion, the range for deficient nutrients is below -4/3 of the standard deviation (s) of the index for a specific element; tendency for deficiency ranges from -4/3 to -2/3 s; sufficient ranges from -2/3 to 2/3 s; tendency for excess ranges from 2/3 to 4/3 s; upper excess range is above 4/3 s. After obtaining the new indices, the nutrient content calculation was performed using the equations from the critical level models.
RESULTS AND DISCUSSION
Figure 1 displays the frequency distributions of the elements categorized into three classes: non-limiting (NL), limiting due to deficiency (LF), and limiting due to excess (LE) for both high and low productivity populations.
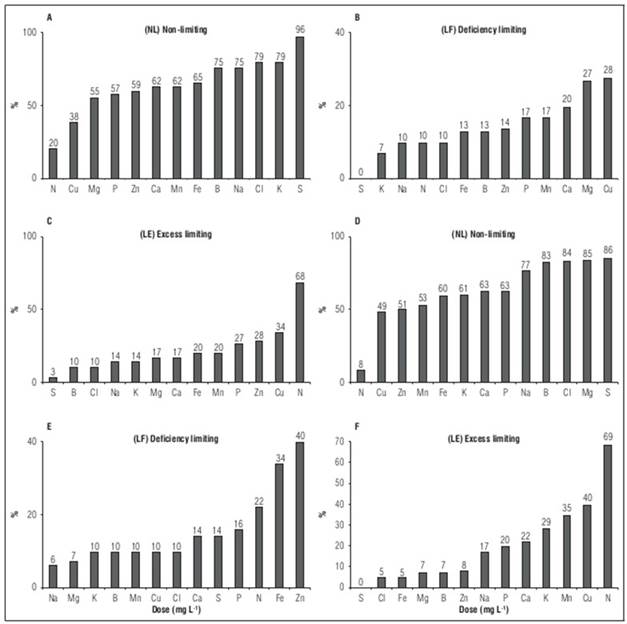
Figure 1. Frequency distribution of nutritional contents for different mineral elements: Non-limiting (NL), limiting due to deficiency (LF), and limiting due to excess (LE): a, b, and c for the high productivity population, d, e, and f for the low productivity population using the foliar DRIS methodology.
It can be observed that for both populations, sulfur, boron, and calcium are in non-limiting conditions, and they also exhibit similar values in both groups, with sulfur exceeding 80%, boron exceeding 70%, and calcium averaging 62%.
In contrast to the non-limiting elements, the minerals limited by deficiency showed differences between the two distinct populations. In the high productivity population, magnesium and copper accounted for 27% and 28% of the nutritional limitation, respectively, while the low productivity population was limited by deficiencies in zinc (40%) and iron (34%).
Nitrogen and copper also exhibited similar conditions in both the high and low productivity populations, being categorized as limiting due to excess, with an average of 68% for nitrogen and copper values exceeding 30%. This confirms that just as deficiencies in the foliar tissue concentrations of any element negatively impact crop production, excesses also have the same deleterious effect on production (Kamireddy et al., 2023).
Taking as a starting point the nutritional balance obtained through the calculation of the DRIS indices, the potential response to nutrient application through fertilizers was also calculated, as shown in table 3. Except for nitrogen and copper, all elements show a null probability of response, with values exceeding 50%. This suggests that the quantities of fertilizers used for these elements in the plantation have been adequate.
Table 3 Frequency (%) of the potential response to nutrient application.
| Element | Positive, with high probability (P) | Positive, with low probability (Pz) | Null answer (z) | Negative, with low probability (Nz) | Negative, with high probability (N) |
|---|---|---|---|---|---|
| N | 12.39 | 7.08 | 11.50 | 7.08 | 61.95 |
| P | 4.42 | 12.39 | 61.06 | 21.24 | 0.88 |
| K | 3.54 | 5.31 | 66.37 | 23.01 | 1.77 |
| Ca | 7.96 | 7.96 | 62.83 | 15.93 | 5.31 |
| Mg | 3.54 | 8.85 | 77.88 | 7.96 | 1.77 |
| Cl | 1.77 | 8.85 | 83.19 | 5.31 | 0.88 |
| Na | 3.54 | 3.54 | 76.99 | 12.39 | 3.54 |
| Zn | 9.73 | 23.89 | 53.10 | 7.96 | 5.31 |
| Cu | 8.85 | 6.19 | 46.02 | 30.09 | 8.85 |
| Fe | 21.24 | 7.96 | 61.95 | 8.85 | 0.00 |
| Mn | 4.42 | 7.96 | 55.75 | 24.78 | 7.08 |
| S | 4.42 | 6.19 | 88.50 | 0.00 | 0.88 |
| B | 7.08 | 3.54 | 81.42 | 7.08 | 0.88 |
Iron is the only element with a high probability of positive response to application (21.24%). This means that the inclusion or increase of the dosage of this element will have a positive effect on the production of FFB, in accordance with the law of the minimum (Kamireddy et al., 2023).
Like iron, zinc also shows a positive response in leaf mineral content, but in this case, the probability of response is low, confirming the deficient condition of this element. Furthermore, this condition is not homogeneous throughout the experimental area.
Particularly noteworthy is that although phosphorus and potassium show a high probability of null response, these two elements also have a negative response probability of 21 and 23%, respectively. This indicates that any increase in the concentration of these elements in foliar tissue, regardless of the cause, will have adverse effects on production. This could be due to luxury consumption or, in more severe cases, antagonisms with other elements (Kamireddy et al., 2023). In this response order, it is also observed that manganese and copper have a probability of causing toxic effects on the crop, with values of 24% and 30%, respectively, corroborating the excess conditions found in the diagnosis obtained from the DRIS indices.
The last element, classified as having a negative response but with a high probability of occurrence, is nitrogen, indicating that the current concentrations of this element in foliar tissue could be affecting the yield components of the crop, as a consequence of overgrowth as reported by Goh (2012).
Determining foliar critical levels
To determine the foliar critical levels, regression analysis was used to fit linear, logarithmic, and quadratic models (Silveira et al., 2005; Guindani et al., 2009) that related the DRIS indices to the mineral concentration, with the latter as the independent variable. The statistical models between foliar mineral concentrations and their respective indices are presented in figure 2. All indices increased with their respective mineral concentrations, which increases the reliability of the DRIS norms (Chaleshtori et al., 2021). This demonstrates a greater dependence of the DRIS indices on the content of the element itself compared to other nutrients involved in the calculation of the DRIS indices.
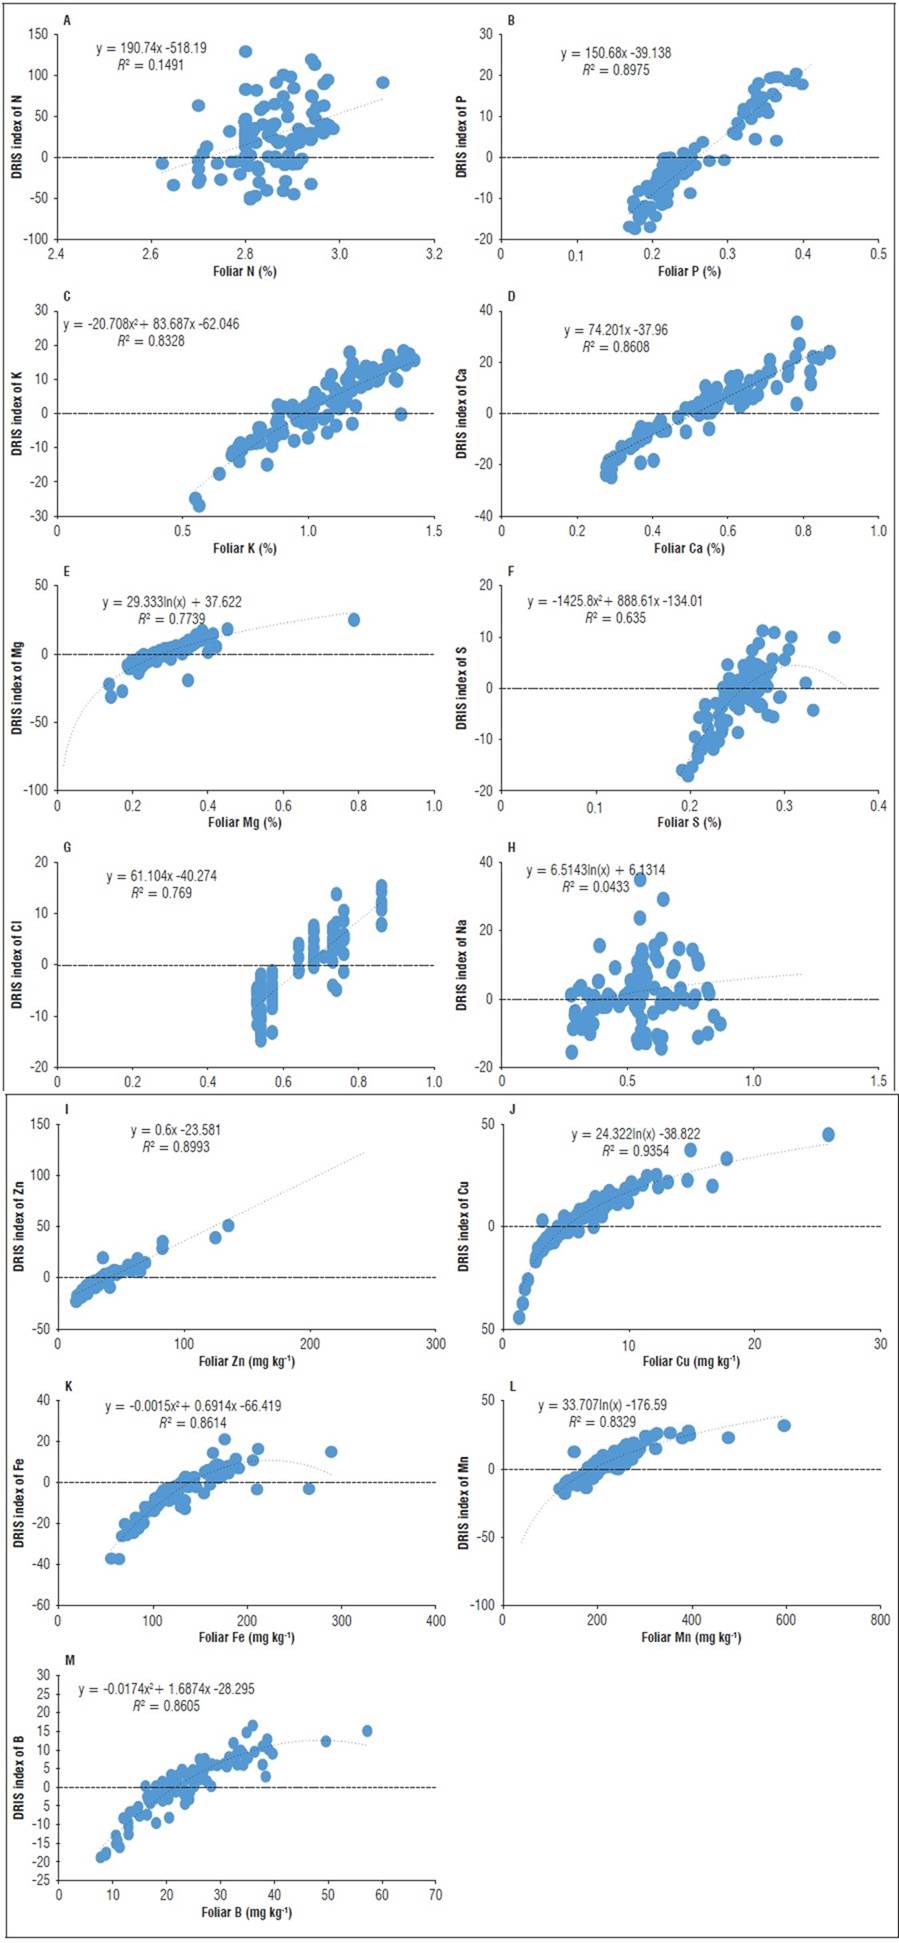
The coefficients of determination were satisfactory (Tab. 4), except for nitrogen and sodium, which had values of 0.14 and 0.04, indicating a weaker relationship between the obtained indices and the concentration of these nutrients. On the other hand, a good relationship is observed between these parameters for the rest of the elements.
Table 4. Regression equations between the element index and the element concentration in leaf tissue.
| Element | Model | R 2 | Critical level |
|---|---|---|---|
| % | |||
| N | y = 190.74x - 518.19 | 0.1491 | 2.71 |
| P | y = 150.68x - 39.138 | 0.8975 | 0.25 |
| K | y = -20.708x2 + 83.687x - 62.046 | 0.8328 | 0.97 |
| Ca | y = 74.201x - 37.96 | 0.8608 | 0.51 |
| Mg | y = 29.333ln(x) + 37.622 | 0.7739 | 0.27 |
| Cl | y = 61.104x - 40.274 | 0.769 | 0.65 |
| Na | y = 6.5143ln(x) + 6.1314 | 0.0433 | 0.39 |
| S | y = -1425.8x2 + 888.61x - 134.01 | 0.635 | 0.25 |
| mg kg-1 | |||
| Zn | y = 0.6x - 23.581 | 0.8993 | 39.3 |
| Cu | y = 24.322ln(x) - 38.822 | 0.9354 | 4.95 |
| Fe | y = 32.752ln(x) - 163.05 | 0.8238 | 145.23 |
| Mn | y = 33.707ln(x) - 176.59 | 0.8329 | 188.47 |
| B | y = 18.01ln(x) - 55.166 | 0.869 | 21.39 |
The relationship between plant productivity and nutrient concentration is pivotal when employing foliar tissue analysis as a diagnostic tool. In this context, DRIS indices can serve as a valuable nutritional diagnostic method due to the strong correlation observed between these variables. They also form the essential foundation for calculating the DRIS.
When examining the fitted models correlating mineral concentrations with their respective indices, it becomes evident that, at a specific point in the function, the DRIS index reaches zero (Fig. 2). At this juncture, the foliar concentration no longer poses a nutritional limitation to the productivity of the palm crop. Consequently, the critical level represents the optimal value for an element, which corresponds to its concentration when its DRIS index equals zero, as articulated by Wadt et al. (1998), Villaseñor et al. (2020), Reis et al. (2002), Reis and Monnerat (2002), Kurihara (2004), and Kurihara et al. (2008).
The concentration for nitrogen is 2.71%, with an R 2 value of 0.14, which aligns with the low correspondence found for this element by Silveira et al. (2005) in signal grass, Nachtigall and Dechen (2007) in apple, and Guindani et al. (2009) in rice, and by Santacruz et al. (2004) for palm cultivation. The critical level found for nitrogen differs from the reports of Crespo-González et al. (2020) and Kamireddy et al. (2023), who consider concentrations above 2.6% as excess.
Phosphorus fits a linear regression model with an R 2 of 0.89, and the calculated critical level is 0.25%, which is higher than the values reported by Rahman (2010) and Santacruz (2004), who found suitable values for this element at 0.18%.
The values found for the cation potassium, calcium, and magnesium, although different from the reports of Santacruz (2004), and Crespo-González et al. (2020), do not follow the same trend for all three elements. For potassium and calcium, the values found (Tab. 4) are below the 1.2% and 0.65% suggested by the authors. As for magnesium, the value found of 0.65% is higher compared to the literature reports.
The micronutrients manganese, iron, boron, and copper show a good mathematical fit to a logarithmic model, unlike zinc, which fits a linear model. The value found for copper can be considered appropriate and in line with what Kamireddy et al. (2023) reported. The elements zinc, boron, iron, and manganese significantly differ from what Santacruz (2004) reported for manganese (350 mg kg-1), from what Crespo-González et al. (2020) reported for zinc and iron (15 and 80 mg kg-1, respectively), and from what Broschat (2007) reported for boron.
Determination of sufficiency ranges
To enhance nutritional diagnostic tools, sufficiency ranges were developed as an additional procedure. The sufficiency ranges were established using the procedure proposed by Beaufils (1973) and Oliveira and Sousa (1993), based on regression models between nutrient concentrations and DRIS indices according to Álvarez and Leite (1992). The adjusted interpretation tables are presented in table 5, and it can be observed that the sufficiency ranges or adequate levels found in this study differ from those available in the literature.
Table 5. Sufficiency ranges of nutrients for the interpretation of foliar analysis in hybrid oil palm cultivation IRHO.
| Element | Deficient | Tendency to deficiency | Sufficient | Tendency to excess | Excess |
|---|---|---|---|---|---|
| % | |||||
| N | <2.52 | 2.52-2.62 | 2.62-2.81 | 2.81-2.9 | >2.90 |
| P | <0.18 | 0.18-0.22 | 0.22-0.3 | 0.3-0.33 | >0.33 |
| K | <0.79 | 0.79-0.88 | 0.88-1.08 | 1.08-1.2 | >1.2 |
| Ca | <0.32 | 0.33-0.42 | 0.42-0.60 | 0.6-0.69 | >0.69 |
| Mg | 0.18 | 0.18-0.22 | 0.22-0.34 | 0.34-0.42 | >0.42 |
| Cl | <0.499 | 0.5-0.58 | 0.58-0.74 | 0.74-0.71 | >0.81 |
| Na | <0.09 | 0.09-0.19 | 0.19-0.81 | 0.81-1.67 | >1.67 |
| S | <0.21 | 0.21-0.23 | 0.23-0.29 | 0.29-0.32 | >0.32 |
| mg kg-1 | |||||
| Zn | <11.21 | 11.22-25.27 | 25.27-53.33 | 53.34-67.38 | >67.38 |
| Cu | <2.00 | 2-3.14 | 3.14-7.75 | 7.75-12.18 | >12.18 |
| Fe | <100.67 | 100.68-120.92 | 120.92-174.43 | 174.43-209-49 | >209.49 |
| Mn | <121.20 | 121.21-151.15 | 151.15-235.03 | 235.03-293.07 | >293.07 |
| B | <11.58 | 11.59-15.75 | 15.75-29.07 | 29.07-39.49 | >39.49 |
The levels of nitrogen, which were considered high according to the traditional method, are now classified as sufficient when considering the sufficiency range calibrated by the DRIS method. For phosphorus, calcium, chlorine, zinc, iron, and manganese, values interpreted as adequate and high indicate a tendency towards nutritional deficiency. These results emphasize the need to determine local/regional sufficiency levels to correct distortions that arise from general interpretation criteria compiled in the literature, which are often related to different edaphoclimatic and management zones (Kamireddy, 2023).
Potassium presents a contrasting condition compared to the elements. For this element, the values found in this study are classified as deficient according to the ranges used for Colombia and proposed by Montero-Espinosa (2021). Logically, and continuing with the same analysis, the conventionally used values would be classified in the range of excessive tendency. Finally, magnesium, boron, and copper did not show any modifications compared to the reports used for crop management.
CONCLUSION
One of the main limitations found from a nutritional point of view is the excess of nitrogen, as well as the deficiency of zinc and its positive response in yield. Boron, one of the elements frequently applied in palm areas, exhibits balance in its foliar concentration and deficiency in its soil concentration.
Critical levels can be estimated from regression models between nutrient levels and DRIS indices, determining the value of the nutrient when the index is equal to zero. Based on the above, the critical levels found in this study show significant differences from what is published in the literature.
The sufficiency ranges, obtained based on the critical level resulting from the correlation between the DRIS index and nutrient concentration, have narrower ranges compared to those conventionally used.

