


 Inglês (pdf)
 Artigo em XML
 Referências do artigo
 Enviar este artigo por email
 Citado por SciELO
  Citado por Google
  Similares em
SciELO
Similares em
SciELO  Similares em Google
 Permalink
Introduction
In December 2019, several pneumonia cases of unknown origin were detected for the first time in Wuhan, the capital of the province of Hubei in China.1 Afterwards, a new enveloped RNA betacoronavirus with positive polarity was identified as the cause of the pneumonia cases, which were then referred to as coronavirus disease 2019 (COVID-19) cases.2 After a short period, the COVID-19 outbreak spread to other regions of China, Europe, and various countries of the world, and was declared a pandemic by the World Health Organization on March 11, 2020.3
The first COVID-19 case in the United States of America (USA) was detected on January 19, 2020, when a 35-year-old male attended an emergency care clinic in Snohomish County, Washington, after experiencing cough and a subjective history of fever for 4 days.4 The patient reported that he had recently returned from Wuhan after visiting some relatives, and on January 20, the Centers for Disease Control and Prevention (CDC) was notified about the patient's positivity for the new coronavirus (2019-nCoV) in the reverse-transcriptase-polymerase-chain-reaction (rRT-PCR) test.5
On January 31, the outbreak was officially declared a public health emergency and restrictions on flights coming from China to the USA were imposed.6 However, the new virus rapidly spread in the country and the number of COVID-19 cases steadily increased throughout March and April, with major outbreaks taking place in large urban areas such as New York City, the San Francisco Bay Area, Detroit, and New Orleans.7,8 During these months, and in order to slow down the spread of the virus, the authorities of some states, including cities and counties, in particular California, implemented control measures such as mandatory quarantine periods and human mobility restrictions, asking citizens to stay at their homes and leaving only to perform an essential job or shop for basic necessities.9
Psychological reactions that might take place during the COVID-19 pandemic range from excessive and persistent worry and fear of being infected to fatalism. Several studies have shown that the psychological effects of the pandemic are not always short-term and that they may cause severe and permanent mental issues.10,11 Fear of disease, fear of death, fear of losing the job and, thus, the loss of livelihood, feeling excluded from society, feeling despair during the quarantine period, and feeling distress and loneliness are the most common psychological reactions during the COVID-19 pandemic.12
As the pandemic progresses, psychological symptoms that were initially considered a possible acute stress reaction have shown a tendency to become chronic in some people. Taking this into account, an increase in the frequency of mental disorders such as major depression, post-traumatic stress disorder, common anxiety disorder, and obsessive compulsive disorder is expected to occur in the general population during and after the pandemic.10,11,13
In this regard, a study conducted in China, the country where the first COVID-19 cases were reported, found that during the initial stage of the COVID-19 outbreak, 16.5% of the participants showed symptoms of moderate to severe depression and 28.8%, symptoms of moderate to severe anxiety.14 Likewise, a study carried out in general population of Italy, one of the European countries most affected by the pandemic so far, reported that, during the implementation of the mobility restriction and lockdown measures to control the spread of the virus, 37% of the participants experienced post-traumatic stress symptoms; 20.8%, anxiety symptoms; 17.3%, depression symptoms; 7.3%, sleep disorders; and 22.9%, adjustment disorder.15
Similarly, several studies have analyzed the association between the current pandemic and the occurrence of depressive and anxiety disorders in the general population.16,17 However the available data on the psychological effects of the COVID-19 pandemic are not sufficient since the health emergency is not over. Furthermore, it should be considered that many people who already had an emotional disorder before the pandemic may have interrupted their treatment and experienced a relapse of their symptoms, since the restrictions also affected the provision of mental health services.
Bearing this in mind, the objective of this study was to assess some of the effects of the COVID-19 pandemic on the mental health of U.S. adult population, as well as the relationship between the average number of new COVID-19 cases and the average frequency of symptoms of anxiety, depression, and anxiety or depression between April 23 and October 26, 2020.
Materials and methods
Retrospective study based on secondary data. Psychosocial and demographic data were obtained from the community-based Household Pulse Survey, an online survey conducted by the U.S. Census Bureau, along with other federal institutions, to determine how the COVID-19 pandemic has affected households across the country from a social and economic perspective in real time; this questionnaire was submitted to selected participants via an invitation sent by e-mail or text message on several occasions between April 23 and October 26, 2020.18 On the other hand, data about the new COVID-19 cases detected in the country during the study period (April 23-October 26) were obtained from the Our World in Data website.19
Study population
All individuals who completed the Household Pulse Survey,18 available at their website, were included in the study. Each resident of the 15 metropolitan areas in which e-mail or telephone details were available was considered a candidate to participate in the survey; according to the U.S. Census Bureau, nearly 140 000 000 households fulfilled this criterion. In fact, the system stores over 1 billion telephone/address pairs and 686 million e-mail/address pairs, with the telephone/address pair accounting for 88% of the country's total households and the e-mail/address pair accounting for 80%.
Each household was taken as a unit and paired with either the registered e-mail or the registered phone number (House/Unit). Finally, households invited to complete the survey were selected through simple random sampling, and only one individual from each housing unit was randomly chosen to answer the questionnaire. In the case of lack of response, the necessary adjustments were made and weighted to match the occupancy status of the household, the number of adults living in it, as well as the age, sex, race, ethnicity, and education level of respondents.
In total, 1 351 911 people living in the USA answered the questionnaires, which were sent at 17 different times between April 23 and October 26, 2020. It is worth noting that all respondents were over 18 years of age. The time periods in which the invitation to complete the survey was sent and the number of people who completed it in each period are described in Table 1.20
Table 1 Time intervals in which the invitation was sent and number of people who completed the survey in each period.
| Time period | Week | Sample size |
|---|---|---|
| 1 | April 23-May 5 | 69 316 |
| 2 | May 7-12 | 39 447 |
| 3 | May 14-19 | 118 897 |
| 4 | May 21-26 | 90 798 |
| 5 | May 28-June 2 | 94 329 |
| 6 | June 4-9 | 75 292 |
| 7 | June 11-16 | 68 322 |
| 8 | June 18-23 | 99 918 |
| 9 | June 25-30 | 91 272 |
| 10 | July 2-7 | 83 960 |
| 11 | July 9-14 | 84 492 |
| 12 | July 16-21 | 79 776 |
| 13 | August 19-31 | 93 136 |
| 14 | September 2-14 | 94 739 |
| 15 | September 16-28 | 85 555 |
| 16 | September 30-October 12 | 82 192 |
| 17 | October 14-26 | 76 034 |
Source: Taken from the U.S. Census Bureau.20
Research questions
The questionnaire form consisted of 50 questions divided into the following categories: employment status, food safety, housing safety, educational disruptions, physical health, and mental health. The survey contained two questions related to symptoms of anxiety and two questions about symptoms of depression.
In the survey, participants were asked to answer 2 questions adapted from the Patient Health Questionnaire (PHQ-2) to evaluate the presence of depression symptoms in the last 7 days, namely:
Over the last 7 days, how often have you been bothered by ... having little interest or pleasure in doing things?
Over the last 7 days, how often have you been bothered by ... feeling down, depressed, or hopeless?
Likewise, 2 questions adapted from the Generalized Anxiety Disorder Scale-7 (GAD-7) were used to evaluate the presence of anxiety for the last 7 days:
Scoring and evaluation
Each of the four questions could be answered using the following options: 'not at all: 0, several days: 1, more than half of the days: 2, and nearly every day: 3.' If the score of the answers to the two modified PHQ-questions was ≥3, the respondent was considered to have symptoms of depression. Likewise, if the total score of the answers in the two modified GAD-7 questions was ≥3, the respondent was considered to have anxiety symptoms.
Number of COVID-19 Cases
Based on the data available in the Our World in Data website,19 the averages of new COVID-19 cases detected daily in the USA during the 17 periods in which the survey was conducted were calculated.
Statistical analysis
Descriptive findings were expressed using means, standard deviations, and medians (minimum-maximum). Z-score was calculated to show the expression variables representing the number of COVID-19 cases and the frequency of anxiety and/or depression symptoms in a common graph. In addition, the Spearman's rank correlation coefficient (r) was used to evaluate the strength of the relationships between continuous variables (mean new COVID-19 cases during the study period and the average frequency of anxiety, depression, and anxiety or depression) as follows: r=0.0-0.19 "very weak", r=0.20-0.39 "weak", r=0.40-0.59 "medium", r=0.60-0.79 "strong", and r=0.80-1.00 "very strong". Furthermore, these correlations were also assessed in a subgroup analysis (sex, age group, education level, and ethnicity). A significance level of p<0.05 was considered for all statistical analyses. Statistical evaluation was performed using the Statistical Package for Social Sciences (SPSS) for Windows 25.0 (IBM SPSS Inc., Chicago, IL).
Ethical considerations
Although this study only used publicly available secondary data, the ethical principles for conducting medical research involving human subjects established by the Declaration of Helsinki21 were followed and data confidentiality was kept at all times. Likewise, the study was approved by the Clinical Research Ethics Committee of the Istanbul University as stated in Minutes No. 47477 of January 28, 2021.
Results
In total, 1 351 911 people completed the survey at 17 different times between April 23 and October 26, 2020, and, thus, their data were included in the present study.
The mean and median frequency of anxiety symptoms were 31.9±2.0% and 31.6% (28.2-36.1), respectively. On the other hand, the mean and median rates of depression symptoms were 25.7±1.6% and 25.3% (23.5-29.6), respectively. Finally, the mean frequency of depression or anxiety symptoms were 36.8±2.0%, while the median frequency was 36.2% (33.9-40.9).
The mean and median number of new COVID-19 cases detected in the USA in the 17 time intervals in which the survey was completed are shown in Table 2. During the study period, that is, between April 23 and October 26, the average number of new cases showed an upward trend until the week of July 16-21, then a downward trend was observed until the September 16-28 interval; however, since the latter period, an upward trend was observed again.
Table 2 New COVID-19 cases detected across the USA in the time intervals during which the Household Pulse Survey was administered.
| Time Period | Date | Days | Mean | SD | Median | Min. | Max. |
|---|---|---|---|---|---|---|---|
| 1 | April 23-May 5 | 13 | 28 065 | 4 037 | 27 764 | 23 187 | 34 240 |
| 2 | May 7-12 | 6 | 23 409 | 3 719 | 23 837 | 18 871 | 27 736 |
| 3 | May 14-19 | 6 | 22 964 | 3 167 | 23 002 | 18 315 | 27 158 |
| 4 | May 21-26 | 6 | 21 337 | 2 789 | 20 525 | 18 347 | 25 865 |
| 5 | May 28-June 2 | 6 | 21 382 | 2 889 | 22 129 | 16 928 | 24 255 |
| 6 | June 4-9 | 6 | 20 273 | 3 048 | 19 865 | 17 492 | 25 349 |
| 7 | June 11-16 | 6 | 22 565 | 2 704 | 23 368 | 19 019 | 25 268 |
| 8 | June 18-23 | 6 | 30 603 | 3 529 | 30 829 | 25 968 | 36 208 |
| 9 | June 25-30 | 6 | 42 252 | 2 688 | 40 884 | 40 057 | 45 980 |
| 10 | July 2-7 | 6 | 51 246 | 6 246 | 50 711 | 44 162 | 60 755 |
| 11 | July 9-14 | 6 | 62 628 | 4 108 | 61 303 | 58 793 | 67 859 |
| 12 | July 16-21 | 6 | 66 279 | 6 617 | 63 355 | 60 716 | 77 102 |
| 13 | August 19-31 | 13 | 42 093 | 5 192 | 44 087 | 34 510 | 48 253 |
| 14 | September 2-14 | 13 | 37 423 | 7 837 | 36 066 | 23 545 | 50 129 |
| 15 | September 16-28 | 13 | 42 336 | 5 470 | 42 512 | 32 284 | 51 495 |
| 16 | September 30-October 12 | 13 | 47 290 | 7 073 | 45 948 | 36 092 | 58 330 |
| 17 | October 14-26 | 13 | 65 928 | 9 381 | 64 359 | 49 354 | 82 821 |
| All | April 23-October 26 | 144 | 39 794 | 15 844 | 38 708 | 16 928 | 82 821 |
Max.: Maximum; Min.: Minimum; SD: Standard deviation.
Source: Own elaboration.
When the rates of anxiety and depression symptoms were evaluated according to the sex of the participants, it was found that they were more frequent in women than in men (35.8% vs. 27.7% and 27.5% vs. 23.7%, respectively). Likewise, the average prevalence of anxiety or depression symptoms was higher in women (40.6% vs. 32.7%).
Concerning age groups, the highest mean frequency of anxiety symptoms (42.6%) was found in participants between the ages of 18-29, while the lowest (14.8%) in those aged ≥80 years. Similarly, the highest and lowest mean rates of depression symptoms were found in the same age groups (36.9% vs. 13.2%). Furthermore, the average prevalence of anxiety or depression symptoms was the lowest in the group of persons aged 80 years or older (18.9%), but the highest (49.7%) among the 18-29 years age group.
In relation to the participants' education level, those with less than a high school diploma had the highest mean frequencies of anxiety and depression symptoms (38.5% and 33.9%, respectively), while those with a bachelor's degree or a higher education level had the lowest (27.6% and 18.9%, respectively). Similarly, the highest and lowest average prevalence rates of anxiety or depression symptoms (44.8% and 31.0%) were observed in those with less than a high school diploma and in those with a bachelor's degree or a higher education level, respectively.
Regarding ethnicity, the highest mean rates of anxiety, depression and anxiety or depression symptoms were found in the "non-Hispanic; other races and multiple races" group (4.0.5%, 33.0% and 4.6.1%, respectively), while the lowest, in the "non-Hispanic Asian; Single race" group (26.3%, 21.9%, and 31.4%, respectively) (Table 3).
Table 3 Mean prevalence of anxiety and depression symptoms in the respondents of the Household Pulse Survey according to subgroups (April 23-October 26).
| Characteristic | Depression* | Anxiety * | Anxiety or depression * | |
|---|---|---|---|---|
| Sex | Female | 35.8+2.1 | 27.5+1.5 | 40.6+2 |
| Male | 27.7+2.1 | 23.7+1.8 | 32.7+2.1 | |
| Age group | 18-29 years | 42.6+2.4 | 36.9+2 | 49-7+2.4 |
| 30-39 years | 37.6+3 | 28.8+2.1 | 42.3+2.8 | |
| 40-49 years | 34.4+2.3 | 26.3+1.7 | 38.8+2.2 | |
| 50-59 years | 31.7+2 | 25.2+2 | 35-9+1-9 | |
| 60-69 years | 24.6+1.9 | 19.9+1.5 | 28.9+1.9 | |
| 70-79 years | 17.3+1.8 | 14.7+1-5 | 21.7+2 | |
| 80 years and above | 14.8+2.3 | 13.2+2.5 | 19+2.7 | |
| Education | Less than a high school diploma | 38.5+2.5 | 33-9+3 | 44.8+2.4 |
| High school diploma or GED | 32+1.9 | 27.6+1.5 | 37.7+1.8 | |
| Some college/Associate's degree | 34.5+2.3 | 28.6+2 | 39.8+2.3 | |
| Bachelor's degree or higher | 27.6+2.6 | 18.9+1.4 | 31+2.7 | |
| Ethnicity | Hispanic or Latino | 36.1+2.4 | 30+1.9 | 42.1+2 |
| Non-Hispanic Asian; single race | 26.2+3.4 | 21.9+3 | 31-4+3-7 | |
| Non-Hispanic Black; single race | 33.4+1.8 | 28.5+2 | 39.6+1.8 | |
| Non-Hispanic White; single race | 30.5+2.2 | 23.9+1.6 | 34.8+2.1 | |
| Non-Hispanic; other races and multiple races | 40.5+3.7 | 33+2.8 | 46.1+3.4 | |
* Mean and standard deviation (SD) of the 17 time periods.
Source: Own elaboration.
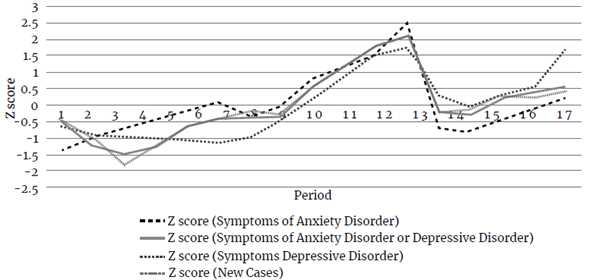
A positive and very strong correlation was found between, on the one hand, the average number of new COVID-19 cases detected in the USA during the period in which the Household Pulse Survey was administered, and, on the other, the mean frequency of anxiety symptoms (r=0.858; p<0.001) and anxiety or depression symptoms (r=0.887; p<0.001) among the respondents.
A strong positive correlation was also found between the average frequency of depression symptoms and the average number of new cases (r=0.710; p<0.001). The average incidence of anxiety and depression symptoms in the participants and the changes in the standardized Z-scores of the average number of new COVID-19 cases over time were found to be similar (Figure 1).
Source: Own elaboration.
Figure 1 Number of new COVID-19 cases and the frequency trend of anxiety and depression symptoms among the respondents of the Household Pulse Survey over time (April 23-October 26).
When the correlations were analyzed according to the established subgroups (Table 4), the following results were obtained: a stronger correlation between the frequency of anxiety and depression symptoms and the number of new COVID-19 cases found in women (r=0.710 and r=0.088; p<0.001). Regarding the age group, the strongest correlation between the number of new COVID-19 cases and the frequency of depression symptoms was found in those aged between 30 and 39 years (r=0.795; p<0.001), while the strongest correlation with the frequency of anxiety symptoms was found in the 60-69 age group (r=0.914; p<0.001).
Table 4 Correlation between the number of new COVID-19 cases in the USA during the study period and frequency of anxiety and depression symptoms among the respondents of the Household Pulse Survey.
| Characteristic | ■ | Depression | Anxiety | Anxiety or depression | |
|---|---|---|---|---|---|
| Sex | Female | r | 0.710 * | 0.888 * | 0.889 * |
| Male | r | 0.683 * | 0.767 * | 0.796 * | |
| 18-29 years | r | 0.582 t | 0.769 * | 0.816 * | |
| 30-39 years | r | 0.795 * | 0.902 * | 0.917 * | |
| 40-49 years | r | 0.624 * | 0.776 * | 0.796 * | |
| Age group | 50-59 years | r | 0.395 | 0.623 * | 0.631 * |
| 60-69 years | r | 0.786 * | 0.914 * | 0.909 * | |
| 70-79 years | r | 0.572 t | 0.613 * | 0.704 * | |
| 80 years and above | r | 0.056 | 0.425 | 0.241 | |
| Less than a high school diploma | r | 0.279 | 0.53 t | 0.347 | |
| Education | High school diploma or GED | r | 0.438 | 0.53 t | 0.58 † |
| Some college/Associate degree | r | 0.769 * | 0.863 * | 0.871 * | |
| Bachelor's degree or higher | r | 0.860 * | 0.846 * | 0.870 * | |
| Hispanic or Latino | r | 0.663 * | 0.688 * | 0.738 * | |
| Non-Hispanic Asian; single race | r | 0.672 * | 0.633 * | 0.656 * | |
| Ethnicity | Non-Hispanic black; single race | r | 0.438 | 0.311 | 0.51 † |
| Non-Hispanic white; single race | r | 0.682 * | 0.868 * | 0.897 * | |
| Non-Hispanic; other races and multiple races | r | 0.293 | 0.52 t | 0.48 † | |
* p<0.001
† p<0.05.
Source: Own elaboration.
In terms of education level, the strongest correlation between the number of new COVID-19 cases and the frequency of depression and anxiety symptoms was found in those with a bachelor's degree or a higher education level and in those with a college or associate degree, respectively (r=0.860 and r=0.863; p<0.001). Finally, when analyzed according to the respondents' ethnic origin, the strongest correlation between the number of new COVID-19 cases and the frequency of depression and anxiety symptoms were found in the "Non-Hispanic white single race" group (r=0.682 and r=0.868; p<0.001).
Discussion
During the study period, more than a third of the population who completed the Household Pulse Survey (1 351 911) in a 7-month period (April-October) had symptoms of anxiety or depression, and there was a very strong positive correlation between the average number of new COVID-19 cases and the average frequency of anxiety or depression symptoms among the respondents in the USA. These findings are consistent with those of Kujawa et al., 22 who reported that the frequency of symptoms of acute stress and depression increased as the number of positive COVID-19 cases increased in the USA during the first stage of the pandemic (May and June).
Furthermore, in the present study, anxiety and depression symptoms were observed in 31.9% and 25.6% of the participants, respectively, which is similar to the findings of Honlingue et al., 23 who conducted a study in 9 687 people in the USA during the onset of the pandemic (March 19-24, 2020), finding that, on average, 39% (95%CI: 0.37-0.40) and 19% (95%CI: 0.26-0.29) of them experienced symptoms of anxiety and depression, respectively, for at least 3 days during the last week prior to completing the survey.
In contrast, according to the results of the National Health Interview Survey conducted by the National Center for Health Statistics (NCHS), from January to June 2019, only 8.2% (95%CI: 7.6-8.8) and 6.6% (95%CI: 6.2-7.1) of adults in the USA experienced symptoms of anxiety and depression, respectively.24 These findings are consistent with other studies that show an increasing frequency of anxiety, depression, and decreased well-being due to the COVID-19 pandemic both in the USA and worldwide.17 25-27
The prevalence of anxiety or depression symptoms in the present study was higher in women than in men (40.6% vs. 32.7%). Similarly, Wang et al., 28 in a study assessing the mental health of U.S. students during the COVID-19 pandemic (May 2020), conducted with a sample of 2 031 undergraduate, masters, and doctoral students (18-75 years old) from one university in Texas, described that mean scores in both PHQ and GAD-7 were higher in women than in men (10.61 vs. 8.84, and 9.12 vs. 6.89, respectively); moreover, most participants (71.26%) reported that their stress/anxiety levels had increased during the pandemic. Another study conducted in the USA (103 participants, of which 63 were female) during the lockdown period (April 25-May 18, 2020) revealed a higher prevalence of general anxiety due to COVID-19 in women compared to men (80.3% vs. 50%; p=0,001), as well as a higher Spielberger State-Trait Anxiety Inventory score in women compared to men (43±1 vs. 38±1a.u.; p=0.007).29
Moreover, in our study, the prevalence of anxiety symptoms in the 18-29 age group was the highest (49.7%), which could be explained by the rapid change in the daily life routines of university students during the first weeks of the pandemic: universities closed and students returned to their homes and began to take classes online. Among young adults, who make up more than a third of the current U.S. workforce (often referred to as "Generation Y" and "Generation Z"), the COVID-19 pandemic and the mobility restriction measures implemented to control its rapid spread implied the loss of their jobs or starting to work remotely. These disruptions may have put an already vulnerable group at a greater risk for mental health problems.30
Similarly, Liu et al., 31 in a study conducted in 898 university students and young adults (18-30 years old) in the U.S. from April 13 to May 19, 2020, that is, nearly one month after the state of emergency was declared in the country due to the COVID-19 pandemic and before the restrictions were lifted across the 50 states, found that at least one-third of the participants showed high levels of depression (43.3%; PHQscores ≥10) and anxiety (45.4%; GAD-7 scores ≥10). Likewise, in the study by Liu et al.31 young people were classified as a vulnerable age group and the PHQ-8 and GAD-7 scales were used, that is, the full scales from which the abbreviated scales used in the Household Pulse Survey were created. These findings show that the anxiety and depression levels of young adults in the U.S. during the pandemic are higher to those reported for this population in previous years (6.2% and 21.0% ) by studies that used similar scales (PHQ-8; GAD-7).32,33
Regarding ethnicity, the highest mean prevalence of anxiety or depression symptoms in the study population was found in the "non-Hispanic; other races, and multiple races" group (46.1±3.4%), which differs from the findings of Fitzpatrick et al., 34 who, in a study conducted in a nationally representative sample of 10 368 U.S. adults to determine the consequences of the fear of COVID-19 on their mental health, found that fear COVID-19 and anxiety levels were higher among Hispanic respondents that in non-Hispanics. In addition, according to these authors, fear of COVID-19 was not evenly distributed across the country, since it was concentrated in the regions with the highest number of confirmed COVID-19 cases.
When analyzed in terms of education level, the highest average prevalence of anxiety and depression symptoms was observed in the group of respondents who had less than a high school diploma (44.8±2.4%). Similarly, in a study assessing the association between exposure to COVID-19 and the onset of depression symptoms in 501 U.S. adults (≥18 years) using the Patient Health Questionnaire, it was found that having an education level equivalent to a high school diploma or less was significantly associated with an increased frequency of depressive symptoms (p<0.01).35
Furthermore, Xiong et al., 36 in a systematic review that included studies on the effects of the COVID-19 pandemic on mental health in various parts of the world, reported relatively high rates of anxiety (6.33%-50.9%), depression (14.6%-48.3%), posttraumatic stress disorder (7%-53.8%), and psychological distress (34.43%-38%) in the general population in China, Spain, Italy, Iran, USA, Turkey, Nepal, and Denmark. At the same time, several studies conducted in various countries have identified many risk factors associated with a higher frequency of depressive symptoms, including being female, being ≤40 years old, and having low education levels.25,28,37-39
Strengths and limitations
The main strength of our study, which was conducted in a large and nationwide representative sample of U.S. adults, is that the results obtained add new knowledge confirming the relationship between the number of COVID-19 cases and the frequency of anxiety and depression symptoms among the general population during the pandemic. Although the use of shortened versions of the PHQ-2 and GAD-7 scales is a limitation, our results were similar to those described by other authors using the full version of the scales, as reported above. Layoffs, economic problems, and social isolation caused by the pandemic can also contribute to the onset of anxiety and depression symptoms; however, there were no data available on these aspects, thus we were not able to assess the effect of these confounding factors on anxiety and depression symptoms among the study population during the pandemic.
Conclusion
The huge impact that the COVID-19 pandemic has had on human health globally is undeniable. In the present study, as reported in many other studies conducted in the USA and other countries, it was found that, besides the immediate health effects caused by the disease in the people infected with the virus, the frequency of anxiety and depression symptoms, as well as of anxiety or depression symptoms among the general adult population in the USA, increased during the pandemic; however, it should be noted that, unlike many of those studies, our study population consisted of a large nationwide representative sample of adults and that the study period was much longer (April-October, 2020).
Also, according to our findings, the number of new COVID-19 cases detected during the study period was positively correlated with the frequency of depression and anxiety symptoms in the participants; in other words, as the number of new cases increased, so did the frequency of the symptoms of these mental disorders, a finding that, to the best of our knowledge, has not yet been described in the relevant literature. Furthermore, young adults were identified as the most vulnerable group. Taking these factors into account, relevant authorities must closely monitor signs of poor mental health in the general population, both during and after the current pandemic.

