


 Inglês (pdf)
 Artigo em XML
 Referências do artigo
 Enviar este artigo por email
 Citado por SciELO
  Citado por Google
  Similares em
SciELO
Similares em
SciELO  Similares em Google
 Permalink
Introduction
Knowledge about the water content in seeds is of great importance in choosing appropriate procedures for harvesting, drying, processing and storage, aiming at preserving the physical, physiological and sanitary attributes of the seeds (Nery, 2004). In most seed quality control programs, the degree of moisture is determined by laboratory tests, based on the maximum possible removal of water when the seed is subjected to the application of heat under controlled conditions (Brasil, 2009, p. 310). However, these methodologies used in the verification process represent destructive tests, which prevents the extraction of other information with the same samples.
The X-ray test is recognized for being a fast and non-destructive image analysis technique, which allows the evaluation of the physical characteristics of the seeds, related to the internal morphology (ISTA, 1996, p. 323). Radiography is characterized by the generation of images with different levels of gray after the interaction of X-rays with the tissues of the seed. Among the cultivated species, the efficiency of radiographic analysis has been proven in the identification of mechanical injuries (Cicero et al., 1998; Cicero & Banzatto Junior, 2003; Flor et al., 2004; Forti et al., 2008; Pinto et al., 2009; Mondo et al., 2009; Gomes-Junior e Cicero, 2012; Arruda et al., 2016), pest damage (Flor et al., 2004; Forti et al., 2008; Pinto et al., 2009; Melo et al., 2010; Arruda et al., 2016), deterioration of tissues (Pinto et al., 2009) and “moisture” and drying injuries (Forti et al., 2008; Menezes et al., 2012). In soybean seeds, this technique has also been used to quantify mechanical damage and damage caused by “moisture” (Pinto et al., 2007; Forti et al., 2008).
In image analysis, the gray scale is the graphic representation of the values of a pixel, described within a numerical range that corresponds to the radiation intensity absorbed during the exposure of the digital image receiver. The values of radiation intensity in the image vary between tones with greater light intensity (white) to those of lesser intensity or darker (black) (Wainschenker, 2011). The combination of radiographic images of seeds with digital image analysis programs, can assist in obtaining relevant information on the attributes and properties of these images, thus reducing human interference in their observation and in the selection of the best seeds according to physical standards.
The objective of this research was to determine the gray scale values in radiographic images of soybean seeds with different levels of hydration, aiming to establish relationships with the traditional method of determining the degree of moisture.
Material and methods
The research was conducted in the laboratories of Seed Analysis and Image Analysis. Both belong to the Department of Crop Science at Luiz de Queiroz College of Agriculture, Universidade de Sao Paulo, Piracicaba, Sao Paulo (SP), Brazil. Soybean seeds (Glycine max (L.)) of same cultivar were used, represented by two lots with different sizes.; lot 1- smaller seeds (sieve 14/64” = 5.6 mm) and lot 2-larger seeds (sieve 18/64” = 7.1 mm).
The seeds of each batch were submitted to hydration in a humid atmosphere. For this, the seeds were placed on a suspended screen inside a plastic box containing 20 ml of water. The boxes were placed in a germinator regulated at 20 °C and 99 % RH (relative humidity) for different periods (2, 4, 6, 8, 10, 12, 14 16, 18 20, 22, and 24 hours) and the control.
Moisture: four repetitions of 25 seeds from each lot were used in each hydration period. The moisture determination was done by the oven method at 105 °C (± 3 °C) for 24 hours and the results are expressed in percentage of humidity based on wet matter, according to Brasil (2009).

W = initial weight (weight of the container and its lid plus the weight of the moist seed); w = final weight (weight of the container and its lid plus the weight of the dry seed); t = tare (weight of the container with its lid).
X-ray test: 40 seeds from each lot in each hydration period were positioned at 14.5 cm from the X-ray emission source (based on preliminary tests), using Faxitron X-Ray digital equipment, model MX-20 DC-12, coupled to a Core 2 Duo (3.16 GHz, 3 GB RAM, 160 GB HD) and MultiSync monitor (17- inch 1990SX LCD). The seeds were fixed in groups of 5 on a sheet of clear acetate (210 x 297 mm), using double-sided adhesive tape. The exposure time was 12 ± 2s and the voltage was 23 kV. After the X-rays, the images were saved in JPEG format (Joint Photographic Experts Group) (8 bits and 2368 x 2440 pixels).
Determination of gray values. Radiographic images of the seeds of each lot at each hydration level were processed by the lmageJ2 software using the gray scale histogram of the seed structures. For that, each seed was analyzed using five analysis systems (S); S1- embryonic axis region; S2-region of the integument; S3-integument region + cotyledons; S4-points in the cotyledon region, and S5-the entire cotyledon region (Figure 1). The results were expressed in gray scale/ pixel values (values between 0 and 255) (Figure 1).
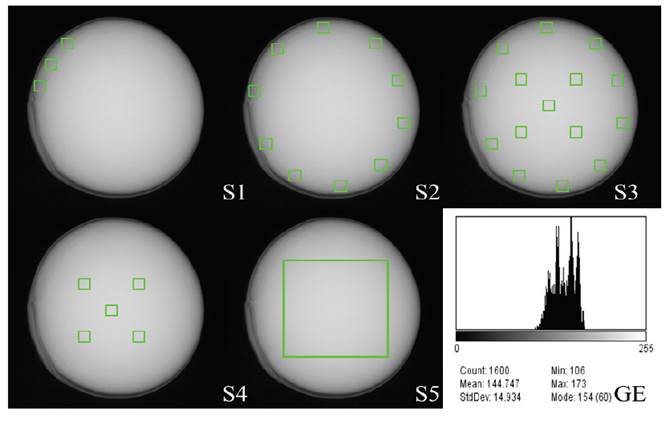
Figure 1. Gray scale analysis in radiographic images of soybean seeds with different levels of hydration. The letter “S” represents the analysis systems in each image, being; S-embryonic axis region; S2-region of the integument; S3-integument region + cotyledons; S4-points in the cotyledon region, and S5-the entire cotyledon region, in addition to the histogram (GE) with gray values for each system. Systems S1 to S4 represent a square (region of interest) of 1600 pixels and S5 represents 90000 pixels.
Statistical procedure: To study the behavior of the factors (system and time) a split plot scheme was used with a completely casualized design, where the plot was the image analysis system and the sub-plot the seed hydration time. To determine the possible relationship between humidity evaluated by the oven method and the gray scale values by lmageJ2, a correlation analysis with scatter plots was performed. First, the assumptions of normality of residues and homogeneity of variances were verified to perform ANOVA. Then, Tukey’s means were compared at a 5 % level of significance. The data were analyzed using the R software (R Core Team, 2018).
Results and discussion
The normal pattern of seed imbibition is represented by a sigmoidal curve (expressed by an exponential equation) where increments in the moisture degree are verified over time. Soybean seeds of different sizes, under conditions of 99 % relative humidity and temperature of 20 °C, showed an increase in water content from the beginning of hydration until the end of periods, expressed by the degree of moisture. However, there was a decrease in water absorption by the seeds after 4 hours, and finally the seeds continued to accumulate water quickly (Figure 2). According to Marcos-Filho (2015), the curve describes the amount of water absorbed by the tissues on the influence of the relative humidity of the air, at a given temperature as a consequence of the balance of vapor pressures, water potentials or water activity. However, the behavior of the curve is similar in different species, indicating the same basic principle about water sorption. The study of the imbibition curve in each species is a technical tool of great support for inferences about this physiological process of seeds (Maeda & Lago, 1986). According to Nery (2004), the knowledge about the water content in the seeds allows the choice of adequate procedures in the harvest, drying, processing and storage, which allows the preservation of the physical, physiological and sanitary attributes.
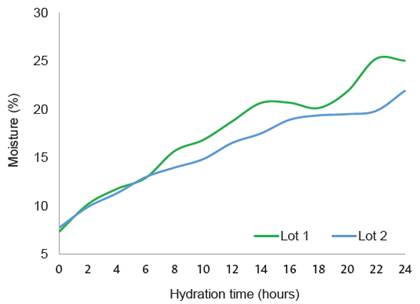
Figure 2 Humidity (%) determined by the oven method in two lots of soybean seeds subjected to hydration in a humid atmosphere for 24 hours. Lot1: smaller seeds (sieve 14/64” = 5.6 mm); lot 2: larger seeds (sieve 18/64” = 7.1 mm).
For lot 1 seeds (smaller seeds) there was a greater accumulation of water during the hydration period. In studies related to imbibition, considering different seed sizes, it has been found that smaller seeds reach water contents higher than those observed for larger seeds, in the same time interval (Calero et al., 1981; Hsu et al., 1983; Souza, 1996); this fact is related to the greater contact area per unit of mass in the smaller seeds (Beckert et al., 2000). The physical integrity of the seed is also a factor that interferes with the increase in water absorption, since damaged seeds, in an initial stage, absorb water more quickly than whole seeds, changing the behavior of the absorption curve. In this work, physically healthy seeds were considered, which were verified with the radiographic images in each hydration period (Figure 1).
The gray scale values of the radiographic images are shown in Figure 3. These measurements, which represent a value from 0 to 255 for each pixel, fluctuated between 120 and 215, with dark and light tones, respectively. In general, there was a difference in each hydration period between seed sizes; smaller seeds (lot 1) had lower values (darker shades of gray) and larger seeds (lot 2) had higher values (lighter shades of gray) (Figure 3). Depending on the atomic composition of the chemical elements and the density of the tissues, the image is formed with darker shades of gray (tissues composed of elements with a low atomic number, such as H = 1, C = 6, N = 7 or empty spaces inside the seed) or lighter shades of gray (tissues with higher density and atomic number of constituent elements). For the five radiographic image analysis systems (S5), a linear trend was observed between lots, but with differences in the gray scale values. For both lots, there was variation in the gray scale during the first hours of hydration (four hours for lot 1 and two hours for lot 2). Subsequently, there was a tendency to decrease until 2 hours and increase until 4 hours in all systems, coinciding with the reduction in water accumulation in these periods, shown in the degree of moisture curve (Figure 2). Finally, the image analysis systems in the two lots showed a tendency to increase in hue until 10 hours (Figure 3). In the radiographic analysis of seeds, it is important to consider the degree of seed moisture. According to Simak (1991), the water content of the seeds can influence the optical density, that is, the lower the humidity, the greater the optical density, which would facilitate the visualization of the internal parts of the seeds through the radiographic image. Souza et al, (2008) found that the low water content of the seeds (6 to 8 %) led to a higher optical density on the radiographs, allowing a better visualization of the internal morphology in Platypodim elegans Vog seeds. As in the case of the imbibition curve, each species has its own characteristics of density and composition of the tissues, which are factors that interfere in the quality and characteristics of the images.
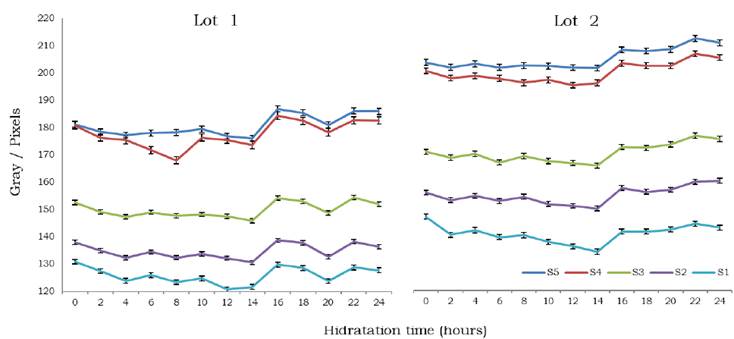
Figure 3 Grayscale values by radiographic image analysis in two lots of soybean seeds submitted to different hydration periods.
The variable degree of moisture determined by the oven method at 105 °C, and the gray scale values, evaluated by the radiographic image analysis systems (S), are shown diagonally in Figure 4 for lots 1 and 2, respectively. These variables, in some cases, showed a correlation between the two methodologies used with soybean seeds in this research. For lot 1, a moderate positive correlation was observed for the degree of moisture and the shades of gray in the cotyledon region determined by S5, with lighter shades of gray within the image, which characterizes a higher degree of moisture in the seed. The areas close to the seed coat and the points in the cotyledon region showed a low positive correlation with the degree of moisture (Umi) (Figure 4). This can be explained due to the globe shape of the soybean seed, which, when the radiographic image (two- dimensional) is obtained, there is less attenuation of the X-ray photons at the seed edge because it has less thickness in relation to the central region. For lot 2, there was a strong positive correlation between the gray tones of the cotyledon región determined by S5 and the degree of seed moisture, evaluated with the oven test, similarly to that observed for lot 1, this region was characterized with shades of lighter gray in the image of the seeds. For areas close to the seed coat and points in the cotyledon region, a moderate to low positive correlation was observed with the degree of moisture, respectively (Figure 4).
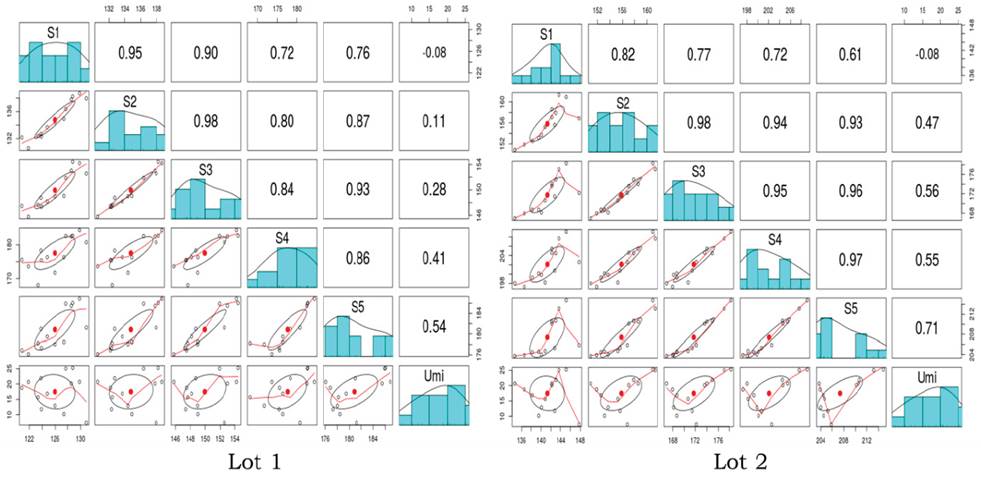
Figure 4 Correlation matrix for five radiographic image analysis systems in soybean seeds, submitted to different periods of hydration versus degree of moisture.
The entry and distribution of water in the seeds are regulated by the cellular water potential, occurring both by capillarity and by diffusion, in the direction of greater to lesser water potential. Thus, imbibition is a physical process mainly related to the permeability characteristics and the properties of the colloids that make up the seeds (Woodstock, 1988; Bewley & Black, 1994, p.445; Carvalho & Nakagawa, 2000, p.588). Generally, larger seeds showed a “greater” correlation between the shades of gray in the cotyledon regions of the seed with the degree of moisture. The dispersion and the frequency histogram were considered solely to approximate the behavior of the data in the methodologies used, but its symmetry was not evaluated.
The systems for evaluating radiographic (S) images in each of the seed hydration periods are shown in Table 1. These indicate that the systems that corresponded to the cotyledon region (S5 and S4) showed a difference, with higher gray scale values in most seed hydration intervals. However, between 6 and 8 hours of hydration, the values in these regions decreased. The cotyledon regions were the ones with lighter shades of gray in most periods, both for smaller seeds and for larger seeds. On the contrary, the systems corresponding to the región close to the integument (S2 and S3) presented intermediate valúes. According to Simak (1991), the darker areas of the images correspond to those parts where X-rays penetrate more easily, while lighter areas represent denser parts of the seed. S1 showed lower valúes of gray tones in both seed sizes (Table 1). As can be seen in Figure 1, the analysis system corresponds to the region of the embryonic axis of the seed (S1), an area of easy identification during the interpretation of radiographic images.
Table 1 Gray scale values by ImagenJ2 of radiographic images of lots of soybean seeds in different periods of hydration
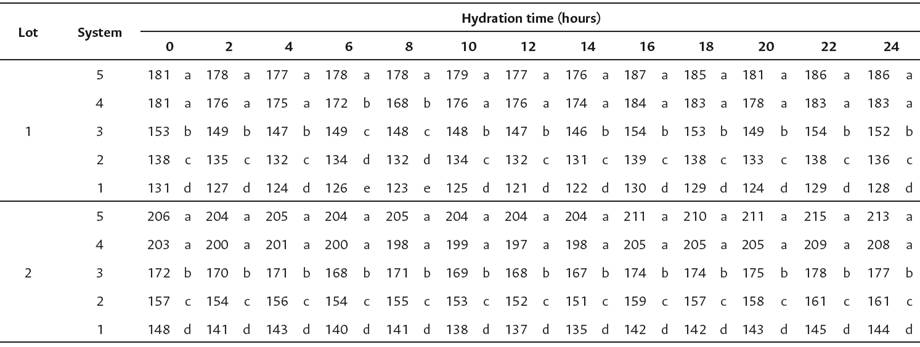
Means followed by the same letter in the column, do not differ by the Tukey test at 5 % probability (p < 0.05).
Variations in the degree of moisture of the embryo or axis depend on the chemical composition, morphology and variations in the permeability of the tissue. Hydration usually leads to the resumption of metabolism and the repair mechanisms of these structures (Marcos-Filho, 2015). The size of vital structures is a factor that must be considered when studying the contribution of water content in seeds as a system. Although, the embryonic axis is a structure easily identifiable by radiographic images, the proportion that it occupies in the seeds is very small in relation to the cotyledons, affecting the negative relations of S1 with the degree of moisture test by the oven method in this research.
As previously mentioned, radiographic analysis is based on the absorption of X-rays in different quantities by the tissues of the seeds, this absorption depends on the density and composition of these tissues, in addition to the wavelength of the radiation (Simak, 1991; ISTA 2004, p. 174; Gomes Junior & Van Dujin, 2017). In this research, the separation of the seeds according to their size and analysis through radiographic characteristics, made it possible to observe differences in the image patterns of the internal structures. Even though the X-ray test is a procedure that does not assess the physiological and metabolic conditions of seeds, radiographic analysis allows establishing relationships with the physiological potential, as the low doses of radiation used do not cause changes in the atomic constitution of tissues. About this, Pinto et al. (2007) found that the presence of moisture damage, which occurs in the embryonic axis or in cotyledons at severe intensity, directly compromises seed germination. Gibson and Muller (1996) also pointed out that “moisture” damage can occur at different intensities, which affect the quality and physiological potential of soybean seeds. Thus, seeds analyzed with radiographic images as in this research, could be used to determine parameters related to physiological quality, aiming to establish relationships between image patterns in vital structures with the performance of seed lots. In seeds where the morphology is difficult to identify by the X-ray test, aspects such as the gray scale could be improved to assist in the classification of the essential structures of these seeds.

