


 Inglês (pdf)
 Artigo em XML
 Referências do artigo
 Enviar este artigo por email
 Citado por SciELO
  Citado por Google
  Similares em
SciELO
Similares em
SciELO  Similares em Google
 Permalink
Introduction
Despite the important decrease registered in the total number of fatalities in road traffic in developed countries during the last years, road safety is still a major problem around the world, and it has become the leading cause of premature death (Studer et al., 2018; Ptak, 2019; Llopis-Castelló and Findley, 2019; Shah and Ahmad, 2019). To give some figures, in the European Union (EU-28), the number of fatalities in collisions decreased from 57 006 to 25 767 between 2000 and 2016 (54,7%) (EUROSTAT, 2018). In the United States, a rate of 35000 people dead in crashes per year is registered (FHWA, 2018).
In Spain, even a higher decrease was observed in the same period (2000-2016), 68,7% (from 5 776 to 1 810) (EUROSTAT, 2018). In 2018, 102 299 accidents with injured people were registered, with a total number of fatalities of 1 806 people, 1 317 of which died in an interurban road, as well as 489 in urban roads. In 2010, there were 122 823 crashes with people injured, and 2 478 people died (a decrease of 27,1%). However, the decrease in interurban roads, 31,7 % (from 1 928 to 1 317), was higher than in urban roads, which was only 11% (from 550 to 489) (DGT, 2019). Consequently, although an important reduction was obtained in interurban roads, similar figures were not achieved in urban areas.
With the aim of improving road safety in urban areas, in 2010, the European Commission published policy orientations and indicated that vulnerable road users (motorcycle riders, mopeds, cyclist, and pedestrians) must be specially protected (EC, 2010). For example, from the 489 people that died in urban accidents in 2018, 149 were pedestrians (30,4%) (DGT, 2019). To reduce these figures, traffic calming measures (TCM) are being displayed in urban roads. They may be defined as "the combination of mainly physical measures that reduce the negative effect of motor vehicle use, alter driver behavior and improve conditions for non-motorized street users" (Lockwood, 1997, p. 2). The main objective of the TCMs is to reduce vehicle speed and volumes in an area, since they were determined to be vital factors to reduce the probability of death for pedestrians involved in a crash (Table 1) (TRB, 2010; Tefft, 2011).
Table 1 Chance of pedestrian death if hit by a motor vehicle
| Speed of collision (km/h) | 80 | 65 | 50 | 32 |
| Chance of pedestrian death (%) | 100 | 80 | 40 | 5 |
Source: TRB (2010).
Usual classifications for TCMs include four categories: vertical deflections (speed humps, speed cushions, rumble strip, raised intersection, raised crosswalk, etc.); horizontal deflections (chicane, raised median island, gateway, curb-extension, etc.); physical obstructions (raised median through intersections, semi and diagonal diverter, right-in and right-out island, etc.); and signs and pavement markings (Kveladze and Agerholm, 2018; Gonzalo-Orden, Rojo, Pérez-Acebo and Linares, 2016; Pérez-Sansalvador, Lakouari, García-Díaz, and Pomares Hernández, 2020; Torres, Cloutier, Bergeron, and St-Denis, 2019; Ziolkowski, 2018). In urban areas, the succession of traffic calming measures and traffic lights maintains the speed of vehicles low. However, a problem appears in the transition from an interurban area to an urban area (Gonzalo-Orden, Pérez-Acebo, Linares-Unamunzaga, and Rojo Arce, 2018). This problem becomes even greater when interurban road penetrates in the urban area of a small village that is not bypassed. If the road segment inside the urban area is short, drivers may not reduce the speed appropriately because the village is not their final destination, and they circulate at high speeds, increasing the probability of pedestrian deaths (Table 1). To reduce the speed of vehicles, traffic calming measures are displayed before the unbypassed village. Various TCMs are placed at the border between non-urban and urban areas: raised crosswalks, sign with speed limits, panels displaying vehicle speed, radars, etc. Their efficiency has been analyzed in the literature (Daniels et al., 2019; Gonzalo-Orden et al., 2018). Under these circumstances, a usual measure in Spain consists of traffic lights that turn red if the speed limit is exceeded. These lights detect an approaching vehicle, and if its speed is higher than the limit, they try to stop it. Hence, the risk of accidents of pedestrians trying to cross the main road is reduced. Scarce research can be found about this type of TCM. Normally, papers focus on traffic offenses involving red lights and on the effectiveness of red light cameras on accidents (Baratian-Ghorghi, Zhou, and Zech, 2016; Llau, Ahmed, Khan, Cevallos, and Pekovic, 2015; Jensupakarn and Kanitpong, 2018), but the efficiency of the traffic lights used for this research is not analyzed as a TCM in the literature.
Consequently, the aim of this paper is to analyze the efficiency of said TCMs in rural roads that penetrate in villages with a short urban segment. For this purpose, the LR-124 road in Abalos, in the region of La Rioja (Spain) was selected. This type of traffic lights is placed in both directions at the entrance of the village. After them, two crossing walks are located for pedestrians to communicate both parts of the village. Speed is controlled in the traffic lights and the crosswalk to know the memory effect of the TCM in the subsequent crosswalks.
Methodology and case study
The LR-124 road in the Autonomous Region of La Rioja was selected for taking field measures in order to conduct an analysis of the efficiency of traffic lights turning red if the speed limit is exceeded. The road belongs to the regional government of La Rioja, and it is included in the Regional Basic Network, the most important road network managed by the regional government. Above this category, there is only the RCE (Red de Carreteras del Estado, the State Road Network), which is the road network that belongs to the Spanish Government, under the Ministry of Transportation and Urban Mobility, and includes freeways and national roads (Pérez-Acebo, 2018). The LR-124 road goes from Logroño (the capital of La Rioja) to Briñas, but it is divided in 3 segments, since it also goes through the province of Alava, with the name of A-124, and those segments belong to the Regional Government of Alava (Pérez-Acebo, 2018). In the central segment, between the two borders with the province of Alava, the road goes from Abalos to San Vicente de la Sonsierra, with a length of 8,6 km, and it goes through the village of Abalos.
In 2011, this segment of the LR-124 had an Annual Average Daily Traffic (AADT) of 2 043 vehicles/day with a percentage of heavy traffic of 7,42% (MFOM, 2012). In Spain, a vehicle is considered to be heavy when its total weight is over 3 500 kg (MFOM, 2003; Pérez-Acebo, Linares-Unamunzaga, and Gonzalo-Orden, 2020). The last available data showed an AADT of 2 390 and 2 457 vehicles in 2015 and 2016, respectively, with 8,7% of heavy vehicles in both years (MFOM, 2016, 2017).
The LR-124 road crosses the village of Ábalos, in a segment of approximately 630 m, which divides the urban area in two parts, one of them being quite bigger than the other (Figure 1). However, the only ways to go from one part to the other are the existing two crosswalks. Pedestrians must cross this interurban road with a significant amount of traffic. With the aim of reducing the speed of vehicles when going through the village, traffic lights turning red if the speed limit is exceeded were installed in both directions as a TCM. Their location, as well as that of the crosswalks, is shown in Figure 1. In each direction, the sequence of the TCMs is as follows:
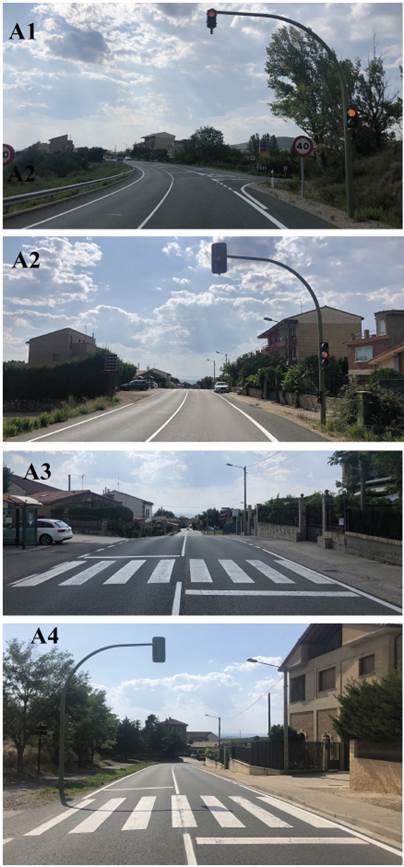
Logroño - Briñas direction (east - west) (Figure 2):
Point A1: Traffic lights warning about the presence of traffic lights and a sign for a maximum speed of 40 km/h.
Point A2: A maximum speed sign of 40 km/h and the traffic light turning red if the speed limit is exceeded.
Point A3: A non-raised crosswalk.
Point A4: A non-raised crosswalk.
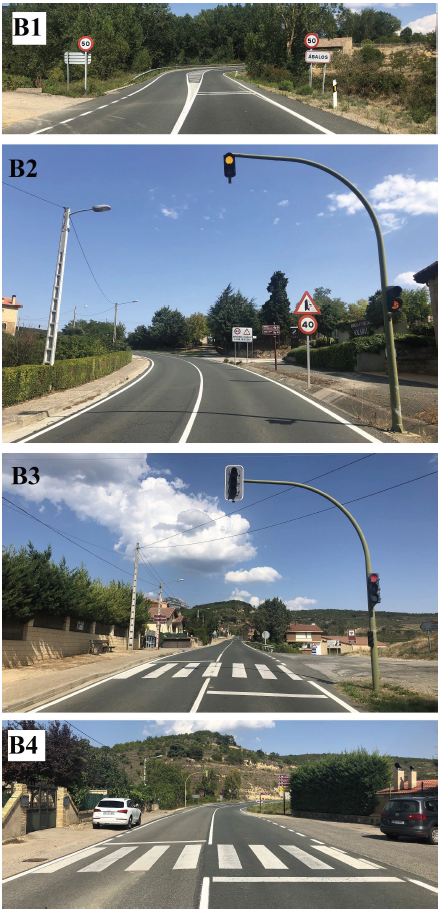
Briñas - Logroño direction (west - east) (Figure 3):
Point B1: rumble strips and a maximum speed sign of 50 km/h.
Point B2, a traffic light warning about the presence of traffic lights and a sign explaining that the next traffic light will turn red if the speed limit (40 km/h) is exceeded.
Point B3: the traffic light turning red if speed limit is exceeded and a non-raised crosswalk
Point B4: a non-raised cross walk.

Source: Authors
Figure 1 Aerial photo of the village of Abalos and locations of the traffic calming measures and crosswalks.
As seen, points A3 and B4 refer to the same crosswalk, and similarly, points A4 and B3.
Measurements were carried out on August 30 and 31, in 2019, in summer, when this kind of village has a higher population, given that a lot of people spend their vacations in these villages, outside the big cities. A fixed radar was placed on the crosswalk with the traffic lights of point B3/A4 for 24 hours, from August 30 at 11:30 a.m. to August 31 at 11:30 a.m. It controlled both directions. Then, the radar was hidden in a car and took measurements in the crosswalk of point A3/B4 for more than 8 hours (from 11:45 a.m. to 8:00 p.m.). Additionally, a gun radar was employed to take measures at the traffic light of point A2 on both days during more than one hour each.
These points were selected because the speed of the vehicles at the crosswalks had to be determined, as they are the place that pedestrians use to cross the road. Hence, these points must be the place where speed must be at its minimum level to reduce the probability of pedestrian deaths related to accidents (TRB, 2010; Tefft, 2011). Additionally, the traffic lights turning red in point A2 were checked to know if they were respected by drivers. If they exceeded the maximum speed of 40 km/h, the traffic light would turn red, and, under these circumstances, they had to stop their vehicles. Consequently, drivers who pass by this section with a speed over 40 km/h, and with a red traffic light, could be fined if the police are present.
Results and discussion
More than 4 300 vehicles were measured in this research. Table 2 presents the average speed of the vehicles, V m ; the percentile 85th of the speed, V85, which is the speed not reached by 85% of vehicles or, in other words, the speed achieved or exceeded by 15% of the vehicles); the maximum speed, V max ; and the total number of vehicles controlled. Additionally, the number of vehicles that exceeded the speed limit (40 km/h) and the percentages of vehicles exceeding this limit are shown.
Table 2 Values of selected variables at control points
| Direction | Logroño - Briñas | Briñas - Logroño | |||
|---|---|---|---|---|---|
| Points | A2 | A3 | A4 | B3 | B4 |
| V m (km/h) | 50,5 | 41,9 | 37,3 | 30,5 | 47,5 |
| V 85 (km/h) | 60 | 51 | 47 | 42 | 58 |
| V max (km/h) | 85 | 74 | 80 | 80 | 93 |
| Total number | 261 | 638 | 1 329 | 1 411 | 751 |
| Vehicles with v > 40 km/h (number) | 224 | 349 | 488 | 255 | 592 |
| Vehicles with v > 40 km/h (%) | 85,8 | 54,7 | 36,7 | 18,1 | 78,8 |
Source: Authors
As seen, in the Logroño - Briñas direction, the average value of the speed at point A2 was 50,5 km/h, which indicates that approximately the 86% of the vehicles did not respect the speed limit and continued their way even with a red light. Fortunately, in the next point, A3, when a non-raised crosswalk was installed, the average speed was reduced to 41,9 km/h, near the speed limit. Furthermore, the V85 was 51 km/h, which indicates that the 54,7% of vehicles did not respect the limit. Finally, in point A4, with the crosswalk and the traffic light in the other direction, both Vm and V85 were even more reduced. This shows that drivers were aware of the presence of an urban area, and, in the second crosswalk they reduced their speed even more. At this point, only 36,7% of the drivers went faster than allowed (Figure 4a).
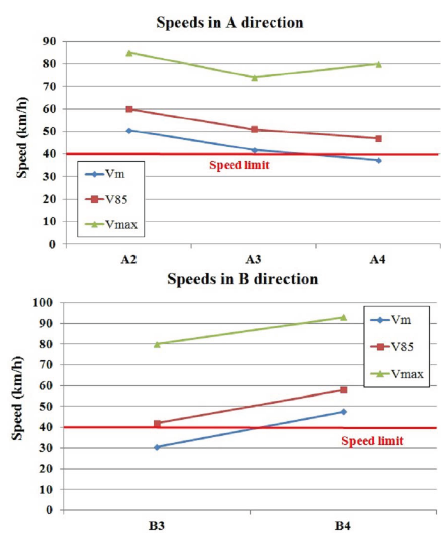
In the other direction, (Briñas - Logroño) values in point B3 were quite satisfactory, since both Vm and V85 were near 40 km/h. Only 18,1% of the drivers did not respect the signs and the red light. In this case, drivers speeded up from point B3 to B4, and the average speed was over the limit. V 85 also had a value of 58 km/h. Hence, 78,8% of drivers exceeded the speed limit in their second crosswalk (Figure 4b).
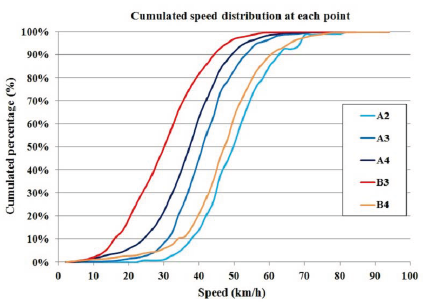
If we compare the values in both traffic lights, the one in point B3 resulted in a greater speed reduction than the one in A2. This lower speed was due to the presence of a crosswalk. Drivers might not have respected a red light or a fine, but if there were crosswalks, they would know that a pedestrian might want to cross the carriageway, and, they would unconsciously speed down to have time to stop the vehicle if such pedestrian appeared. This trend was also observed in direction A, since lower speeds were registered in the crosswalks than in the traffic lights. Drivers might not have respected the red light, but they preferred to speed down in the presence of a crosswalk due to the possible presence of pedestrians. Figure 5 shows the cumulated distribution of the registered speeds in each point.
Finally, the speed values registered in point A4/B3 for 24 hours were classified in two periods: day and night, according to the presence of natural light. On August 30 in 2019, the sun set at 8:45 p.m. in Abalos, it and went up at 07:35 a.m. on August 31. Obtained values for each period are presented in Table 3. The speed distribution in each point during the day and night is shown in Figure 6.
Table 3 Values of selected variables at point A4/B3 during day and night
| Point A4 | Point B3 | |||
|---|---|---|---|---|
| Day | Night | Day | Night | |
| V m (km/h) | 36,8 | 40,5 | 29,9 | 34,9 |
| Standard deviation | 10,2 | 10,6 | 10,5 | 11,1 |
| V 85 (km/h) | 46 | 50 | 41 | 46 |
| V max (km/h) | 74 | 80 | 80 | 65 |
| Total number | 1 117 | 212 | 1 231 | 180 |
| Vehicles with v > 40 km/h (number) | 383 | 105 | 196 | 59 |
| Vehicles with v > 40 km/h (%) | 34,3 | 49,5 | 15,9 | 11,1 |
Source: Authors

Source: Authors
Figure 6 Speed frequency distribution in point A4/B3 during the daylight and night: a) in point B3, b) in point A4.
As seen, speeds at night were higher than during the day. Both values of V m and V85 followed this trend. Moreover, the standard deviation at night was also higher. Generally speaking, during dark hours, average and V85 speeds tend to be lower, although the standard deviation is higher (Kraemer et al., 2005; Pérez-Acebo, 2018). However, research about speed in speed humps and in control sections with similar values between daylight and darkness can be found in the literature (Jägerbrand, Johansson, and Laike, 2018). However, in this road, drivers tended to go faster at night, as they assumed that very few pedestrians might be crossing the carriageway.
Conclusions
In this paper, traffic lights turning red if the speed limit is exceeded were controlled to assess their efficiency as traffic calming measures, installed in the transition between an interurban and an urban area, in the case of interurban roads crossing a small, unbypassed village for a short length.
It was observed that few drivers respected the established speed limit by means of this kind of traffic lights if they are installed separately. However, their presence serves as a real traffic calming measure, given that, in the adjacent urban area, lower speeds were registered at the two crosswalks. Therefore, although these traffic lights are not widely respected, they suppose a warning signal about the presence of an urban area.
When the traffic lights are placed next to a crosswalk, their effect is improved, reaching a high percentage of compliance with the speed limit. Drivers really slow down due to this type of traffic lights and the crosswalk since a pedestrian may cross the road. Moreover, when comparing this effect with another crosswalk in the same direction after them, the traffic lights really work. Hence, placing the traffic lights and the crosswalk together reinforces the effect of both TCMs.
Finally, there is a difference between the speeds during daylight and dark hours. Speeds are higher at night and have a greater standard deviation in the crosswalk, even if the traffic lights are present. It seems that drivers do not respect the speed limit as they do during the day because they think that a pedestrian is less likely to be crossing the road.

