


 Inglês (pdf)
 Artigo em XML
 Referências do artigo
 Enviar este artigo por email
 Citado por SciELO
  Citado por Google
  Similares em
SciELO
Similares em
SciELO  Similares em Google
 Permalink
Introduction
Chile, located in South America, between the Pacific Ocean and Andes mountain range, has historically suffered the effects of the subductive movement of the Nazca Plate while interacting with the South American Plate, thus generating not only large earthquakes, but also destructive tsunamis.
The greatest earthquake ever recorded in Chile and the world occurred in Valdivia in 1960, with a moment magnitude (Mw) of 9,5. The latest major earthquake in Chile occurred in 2010 with a Mw = 8,8, which affected the south and central regions, which amounts to more than 40% of the population, including important cities such as Santiago, Viña del Mar, and Concepción. A total of four buildings (between 4 and 18 stories) collapsed, and 40 buildings were severely damaged. Due to this, several changes to the Chilean seismic code were proposed (Lagos et al., 2012). The return period of major earthquakes in the territory has made the Chilean practice to assume that at least one big event will occur during the structure's lifetime.
In the northern region of the country, a large earthquake occurred in Antofagasta in July 30th, 1995, with a Mw = 8,0.
The real estate boom that started in 1995 and the high cost of the land in the city generated a significant growth in the construction of high-rise buildings. Nowadays, there are more than 150 buildings of 10 stories or more in Antofagasta.
In this study, eight reinforced concrete buildings were analyzed. Eleven structural indexes related to stiffness, structural redundancy, and ductility were determined. The purpose was to obtain a seismic qualification of the buildings in order to get information on the expected structural performance against major earthquakes.
Structural indexes
After each earthquake that produces damage to the infrastructure of the country, the performance of its structures is analyzed with the purpose of taking actions for future events.
In Chile, experience in building performance under seismic events is vast. This performance has been correlated with structural indexes, establishing ranges of values that assure a good seismic behavior (Guendelman, T., Guendelman, M., and Lindenberg, 1997; Henoch, Lindenberg, Guendelman, T., and Guendelman, M., 2010; Lagos etal., 2012; Guendelman, T., Medina, Guendelman, M., and Figueroa, 2017).
For this research, eleven structural indexes were selected. This sought to measure different parameters that affect the performance of a reinforced concrete building and allow performing seismic qualification.
These structural indexes can be classified into two groups: stiffness indexes and structural redundancy and ductility demand indexes.
Stiffness indexes
Building total height/period of first uncracked translational mode of vibration
This index is related to the lateral stiffness of the building (Guendelman et al., 1997).
To obtain this value, a modal spectral analysis is carried out to determine the different modes of vibration of the buildings.
This index is determined as follows:
where H is the total height of the building, and T* is the uncracked period of vibration with the largest mass participation in the direction of analysis.
Height of the building above the ground level/period of first uncracked translational mode ofvibration
This index is also related to the lateral stiffness of the building (Guendelman et al., 1997).
The use of the height-above-the-ground level instead of the total height of the building is due to the fact that it better represents the vibrational properties of the building.
This index is determined as follows:
where H 0 is the total height of the building above the ground level, and T* is the uncracked period of vibration with the largest mass participation in the direction of analysis.
Height of the building above ground level/period of first cracked translational mode of vibration
This index is related to the residual lateral stiffness of the building after a large earthquake (Lagos et al., 2012).
This index is determined as follows:
where H 0 is the total height of the building above the ground level, and T*ag is the cracked period of vibration with the largest mass participation in the direction of analysis.
According to the current Chilean seismic codes, the cracked period with the largest mass participation can be determined as 1,5 times the uncracked period of the mode with the largest mass participation.
Performance index
This index is related to the lateral stiffness of the building (Lagos et al., 2012).
where δ u is the lateral displacement at the top of the building, defined in DS 61 MINVU (2011), and H0 is the total height of the building above the ground level.
The lateral displacement at the top of the building is determined as follows:
where S de is the elastic displacement response spectrum from DS 61 MINVU (2011).
Maximum inter-story drift measured in the center of mass
This index is related to the lateral stiffness of the building (Guendelman et al., 1997).
where δk+i is the lateral displacement in the center of mass of the story k + 1, δk is the lateral displacement in the center of mass of the story k, and h(k+ 1 +k) is the height between story k + 1 and story k.
The Chilean seismic code limits this index to 2,0%o.
Maximum inter-story drift measured in points located on the most unfavorable position
This index is related to the torsional rigidity of the building (Guendelman et al., 1997).
where δ(k+1)P is the lateral displacement of point P of story k + 1, δ (k)p is the lateral displacement of point P of story k, δ (k+i)CM is the lateral displacement of center of mass of story k + 1, δ (k)CM is the lateral displacement of center of mass of story k, and h(k+1+k) is the height between stories k + 1 and k.
Structural redundancy and ductility demand indexes
Total area of walls on the first floor/total area of first floor
This index aims to monitor shear stress in the walls produced by seismic loads (Lagos et al., 2012).
where Aw is the area of walls on the first floor in each direction of analysis, and Af is the total area of the first floor.
Total area of walls on the first floor / Total seismic weight above first floor
This index aims to monitor the level of compression load on the walls (Lagos et al., 2012).
where Aw is the area of walls on the first floor in each direction of analysis, and Pf is the total seismic weight above the first floor, defined by article 5.5.1 of NCh433. The Chilean standard limits the compression load on the wall to 0,35 f’C Ag.
Total area of walls on the first floor/cumulative plan area of the stories above first floor
This index, similar to the previous one, aims to monitor the compression load on walls (Lagos et al., 2012).
where A w is the area of walls on first floor in each direction of analysis, and Acumuted is the cumulative plan area of the stories above first floor.
Effective spectral reduction factor
This index is related to the ductility demand of the building (Lagos et al., 2012).
where Qe is the elastic seismic base shear determined using the elastic response spectrum, and Qd is the design's seismic base shear, determined by using the design spectrum as indicated in DS 61 MINVU (2011).
Modified ductility displacement index
To understand this index, it is necessary to define how ductility is calculated. By definition, ductility is the ultimate displacement divided by the yield displacement, as indicated below:
The yield displacement is often unknown, since it is necessary to perform a static nonlinear analysis to determine it.
Therefore, a modified index for the displacement ductility ratio is calculated considering the yield displacement as 1,4 times the design's lateral displacement (Lagos et al., 2012).
According to the above, the index is determined as follows:
where δu is the design's lateral displacement on the top of the building as defined in DS 61 MINVU (2011), and δd is the design's lateral displacement on the top of the building, determined with the elastic design response spectrum reduced by factor R**, i.e., Sae/R**.
Ranges of selected structural indexes
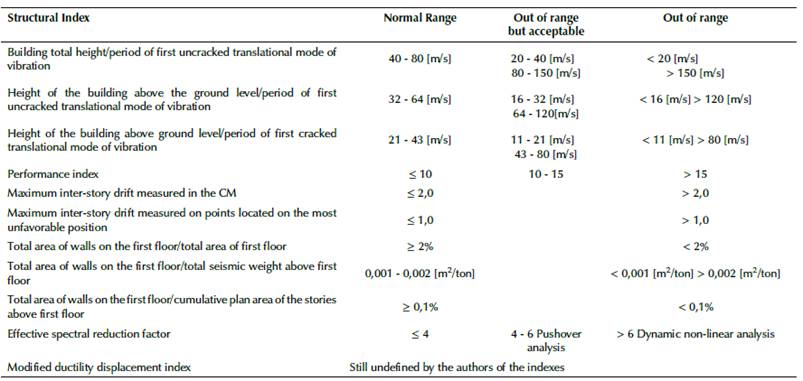
The range adopted for each index is shown in Table 1 (Lagos et al., 2012; Guendelman et al., 2017).
Selected buildings and seismic analysis
Selected buildings
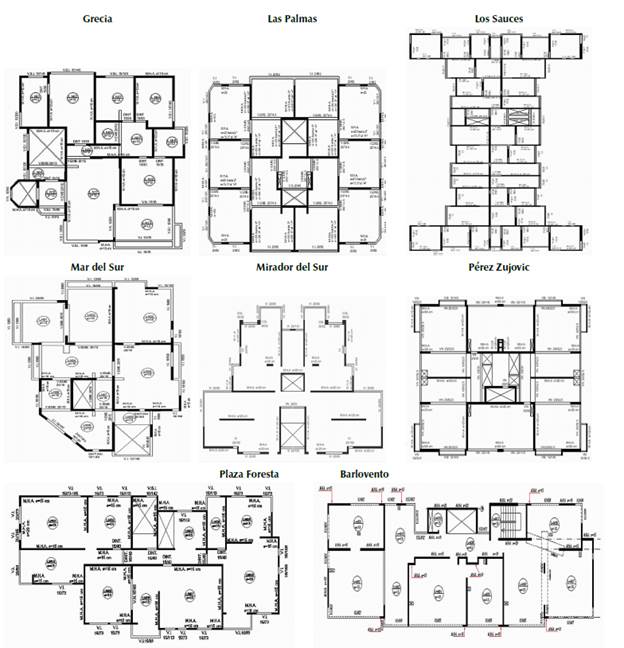
In this study, eight reinforced concrete buildings were analyzed with the selected indexes. Photos and typical plan views of the buildings are shown in Figures 1 and 2.
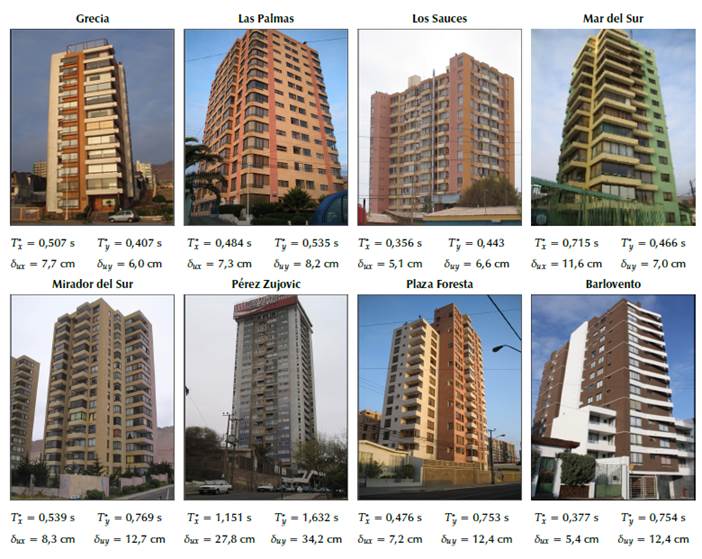
Source: Authors
Figure 1 Photos of the buildings, fundamental period, and design lateral displacement at the roof in each direction.
Modelling
The analyzed buildings are high-rise reinforced concrete buildings. Their structural system consists of reinforced concrete shear walls in both directions and reinforced concrete slabs in all levels.
Buildings were modelled using the ETABS software. Shear walls were modelled as shell elements; beams and columns as frame elements without rigid offsets; and slabs as shell elements. All members were rigidly connected, as their ends and walls were fixed at the base. The properties of the elements are based on their gross dimensions. On each level, a rigid diaphragm was considered with 3 degrees of freedom per joint (two translations and one rotation).
The model of each building includes the underground levels, but not soil-structure interaction was considered.
Seismic analysis
A linear elastic modal spectral analysis was carried out in ETABS according to the provisions of the Chilean seismic codes (NCh433Of96.Mod.2009 and DS61 MINVU 2011). The seismic mass considered included all dead loads plus 25% of live loads.
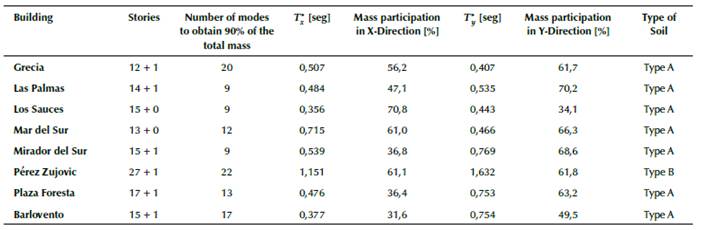
Table 2 shows the uncracked periods of vibration and the corresponding associated mass participation in each direction of analysis.
Results
Tables 3 and 4 show the results of the structural indexes for each selected building, classified according to the ranges as normal, acceptable but out of range, and out of range.
Correlations between structural indexes
In this part of the study, an analysis is carried out to find correlations between structural indexes for the set of buildings. This analysis was performed only for those buildings funded on bedrock, so the Perez Zujovic building was not considered.
In order to consider correlations between indexes as valid, the correlation coefficient should be equal to or greater than 0,8 for a positive slope and -0,8 in the case of negative slope.
Table 5 shows the analyzed variables, the correlation coefficients, and the equations found.
Conclusions
In this study, a total of eleven structural indexes were determined for eight reinforced concrete buildings located in Antofagasta, Chile, to determine their seismic qualification. The conclusions of this study are:
All analyzed building complied with the restrictions of the lateral seismic displacement stated in the actual Chilean seismic code.
Six out of eight buildings have the density of walls in compression index out of range. This implies that the walls of the first floor of these buildings might be subjected to high compression stresses. Since 2011, Chilean regulations limit the compression stress on walls on all floors to 0,35 f Ag. Both Mirador del Sur and Pérez Zujovic are the only buildings with that index in the normal range.
The structural response index (H0/T) has a good relationship with the performance target index, defined as δu/Ho, according to SEAOC VISION 2000 (1995). In buildings with a H0/T* greater than 75 m/s, a value lower than 0,002 for δu/H0 was obtained. Previous studies indicate that, in this case, an elastic overall seismic response is expected for the building supported on bedrock. However, in terms of individual elements, an inelastic behavior may occur.
In four of the buildings, the values of R** are in the range of 4-6. According with the Chilean experience, it is necessary to perform an analysis according to the demand-capacity procedure, where the demand is determined by using the elastic acceleration response spectrum defined in the current Chilean seismic code. To do so, the Capacity Spectral Method (CEM) may be used, which requires a static nonlinear analysis (pushover).
From the correlation study between structural indexes for all buildings on ground type A (bedrock with Vs30 ≥ 900 m/s2), the best result is for the correlation between dmax and H 0 /T*.

