


 Inglês (pdf)
 Artigo em XML
 Referências do artigo
 Enviar este artigo por email
 Citado por SciELO
  Citado por Google
  Similares em
SciELO
Similares em
SciELO  Similares em Google
 Permalink
1. Introduction
In recent years, the actions resulting from economic and industrial activities have caused several negative impacts on the dynamics of ecosystems, particularly regarding the emission of greenhouse gases (GHG). Some of these impacts are extreme weather conditions such as prolonged droughts, rising sea levels, increased forest fires, changes in the rain regime, and agricultural patterns, among others[1]. The world’s energy matrix will have to undergo transformations to slow the increase in the global average temperature; this can be achieved by the adoption of green alternatives until the level of zero net emissions can be reached. According to the International Renewable Energy Agency [2], in order to maintain global warming below 2ºC until 2050, it is mandatory that, by 2030, the proportion of bioenergy in relation to global energy consumption be doubled and triple the use of biofuels for the transport sector.
However, internal combustion engine vehicles (ICEV) dominate the Brazilian fleet of non-commercial light-duty vehicles (LDV) and, despite the success in using ethanol in flex vehicles, there is still a large share of inefficient ICEV with obsolete technologies that operate without remarkable fuel economy, and consequently with high exhaust emissions [3]. According to Souza et al. [4], it is estimated that LDV fuel consumption in Brazilian urban roads is around 3.77 MJ/km, while in the review made by Rosenfeld et al. [5], modern LDV have an average consumption of 1.60 MJ/km. Consequently, the main source of emissions in the Brazilian energy sector is transport, having been responsible for the emission of 200.2 million tons of carbon dioxide equivalent (CO2 eq.) in 2018, which represents 49% of the total emitted [6].
Thus, it is understood that electromobility would play an important role in the decarbonization of the transport sector, as it combines technologies with low or zero exhaust emissions. The number of electric vehicles in circulation in early 2018 increased by 63% over the same period last year worldwide [7]. However, this increase is not uniform across the globe, with many countries lagging behind due to factors such as the lack of infrastructure and incentives for technologies that best serve a certain national scenario. In economic terms, the ICEV still has a more competitive selling price than electric and hybrid vehicles (around 40% more expensive), in addition to the high initial investment cost in local infrastructure for charging and adapting the electrical matrix [7].
According to the review conducted by Guimarães [8], some policies and actions can be adopted to mitigate emissions, especially in the transport sector, such as: (i) carbon emission regulation policies (e.g., carbon tax, carbon cap, and carbon cap-and-trade); (ii) use of renewable fuels (i.e., biofuels); (iii) increased vehicle energy efficiency; (iv) emissions inventory; (v) actions in the transport infrastructure, vehicle technology, and management, aiming to reduce these emissions. According to the World Bank [9], the carbon pricing policy represents the internalization of social costs resulting from GHG emissions, establishing a value for the ton of CO2 Equation emitted. This social cost includes all expenses directed to society that may be related to climate change, such as the repair of territorial damage caused by floods or forest fires, and expenses resulting from damage to health caused by heat waves.
In addition, carbon pricing is a regulatory instrument that generates cost-effectiveness gains, i.e., it demonstrates mitigation potential by directing consumer demands and investments to services and technologies with a lower carbon footprint [10]. Carbon pricing in Brazil has been in development since 2011, with the establishment of a preliminary proposal to prepare the market for its implementation[11]. Regarding the transport sector, the National Biofuels Policy (RenovaBio) plays an important role through the implementation of Decarbonization Credits (CBIO), which apply to Brazilian producers and importers of biofuels certified by RenovaBio. This instrument aims to value efficient agents in the biofuels market and generate incentives to reduce the carbon intensity of their production process each year [12]. According to projections by the International Council on Clean Transportation, the CBIO provide incentives for better performing sugarcane ethanol producers, with an emphasis on bagasse ethanol (i.e., second-generation ethanol) producers which generates 95% carbon savings over fossil gasoline [13].
Among the cleanest electric vehicle technologies, the Battery Electric Vehicle (BEV) and the Hydrogen Fuel Cell Electric Vehicle (HFCEV) are considered, which have zero exhaust emissions. The commercially available HFCEV models operate with the Proton Exchange Membrane Fuel Cell, a low-temperature fuel cell, with a temperature range between 40ºC and 100º, that must be fed directly with hydrogen and presents only water and heat as exhaust emissions [14]. However, one of the biggest challenges for the massive adoption of HFCEV is the lack of hydrogen supply infrastructure [15]. The Solid Oxide Fuel Cell Electric Vehicle (SOFCEV) emerge as an alternative for countries with prospects for the development of electromobility and a well-established biofuel market. Due to the operating temperature range between 850ºC and 1000 ºC of the Solid Oxide Fuel Cell (SOFC), the surplus heat can be used to produce hydrogen on-board through the internal steam-reforming of hydrocarbon fuel (e.g., biomethane and gasoline) or alcohol fuels (e.g., ethanol and glycerine) [14]. This technology is suitable for countries with a strong biofuel market, such as Brazil.
Thus, it is believed that the SOFCEV could be adopted as an alternative to the Brazilian context, since it is a technology that values both the sugarcane ethanol produced in the country and the use of electromobility, without the requirement for significant changes in the local supply infrastructure [16]. There is also the possibility of reducing costs based on obtaining and selling carbon credits, which tends to favor biofuel producers.
This article examines the conventional life cycle cost (LCC) and carbon dioxide (CO2) emissions of the SOFCEV powered by Brazilian fuels. It is an extension of the study presented at the III Ibero-American Congress on Smart Cities entitled “Solid Oxide Fuel Cell Electric Vehicle: Cost Reduction Based on Savings in Fixed Carbon by Sugarcane” as it examines, additionally, the economic viability of the SOFCEV for consumers by assessing the net present value (NPV) [16]. Thus, it is expected to obtain economic and environmental indicators to encourage the use of biofuels in the Brazilian transport sector, specifically in electromobility.
2. Methodology and Assumptions Adopted
The analysis was based on the conventional LCC method for the SOFCEV, assuming capital investments (capital costs), vehicle manufacturing cost, maintenance and operating costs, fuel production cost, and well-to-wheel (WTW) emissions cost. The fuels considered were Brazilian sugarcane ethanol and gasoline C (73% gasoline and 27% anhydrous sugarcane ethanol on a volume basis). The potential for cost reduction was evaluated considering the cost avoided through the acquisition and sale of carbon credits, when dealing with the Brazilian productivity of sugarcane and the carbon fixed by these plantations. Also, to analyze the economic feasibility for the consumers, the NPV was estimated assuming the expenses through the purchase of the vehicle.
2.1 SOFCEV Operation and Specifications
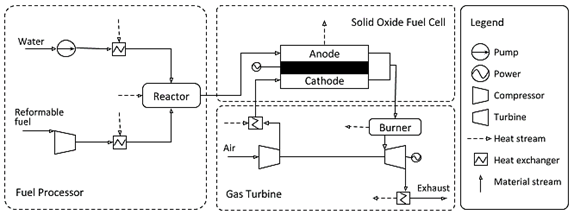
Inside the SOFC with a fuel processor, several reactions occur, such as steam-reforming, water-gas shift, and electrochemical reactions. These reactions are designed to produce a gas mixture that mainly contains hydrogen (H2), CO2, and carbon monoxide (CO). The hydrogen supplied after the fuel steam-reforming process via the anode side reacts with the atmospheric air from the cathode side to produce electricity and heat. The electricity produced to charge the battery and the heat is recovered in the form of energy through the appropriate technology (e.g., gas turbine). This energy is taken to the fuel processor, where the internal production of hydrogen is restarted.
Figure 1 shows a simplified SOFC scheme with a gas turbine. The model described by Facchinetti et al. [17]includes a fuel processor where partial steam-reforming of the fuel occurs, including auxiliary devices (i.e., pump and blowers) and excessive steam to guarantee a reduced rate of degradation of the planar SOFC. The use of heat exchangers is necessary to remove the extra energy generated during the operation of the system. Unused fuel is directed to a burner where it is oxidized, as the expansion of the hot gases activates the turbine, ejecting the exhaust gases into the atmosphere.
The basic operation principle of the SOFC is based on three main reactions. These reactions are as follows:


The H2 produced upstream is pumped to the fuel cell anode, where it is oxidized and separated into two hydrogen protons (H+) and two electrons (2e-), as described in Reaction 1 [18]. The oxygen (O2) enters the fuel cell through the positive terminal, the cathode, where it is reduced forming two oxide ions (O2-), as in Reaction 2[18]. Each O2- attracts two H+ through the electrolyte, which combine to form the water molecule (H2O) in an exothermic reaction. These reactions together form an electron flow, as the electrons formed at the anode bypass the fuel cell electrolyte and return to the cathode, generating an electric current. This process can be resumed in an overall electrochemical cell reaction, as in Reaction 3 [18]:

In addition, conventional vehicles (i.e., ICEV) operate with low efficiency, around 30-35% [14], while the efficiency observed by Facchinetti et al. [17] in SOFC with gas turbines was between 60-72%. Therefore, it is expected that the SOFC vehicle application will meet increasingly restrictive efficiency and fuel economy standards.
2.2 SOFCEV Life Cycle Cost Calculation System
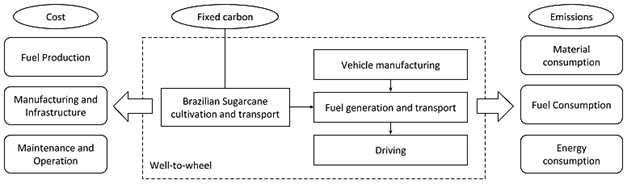
The vehicle LCC considers the financial expenses in stages such as preparing the infrastructure, manufacturing, producing the energy source (i.e., fuel or electricity), as well as the expenses resulting from its maintenance and operation, as explained in Figure 2. From WTW, there are essential expenses and GHG emissions intrinsic to the main stages of the SOFCEV dissemination: vehicle manufacture, generation and transportation of fuel, and circulation of the SOFCEV.
The cost of manufacturing, preparation of infrastructure, as well as maintenance and operation of the SOFCEV were obtained through equations by different authors. The emissions inventory related to the cultivation of sugarcane, generation, and transportation of fuel was prepared based on data available in the literature, specifically for the Brazilian scenario.
Scenario A
This scenario includes the cost of investing in equipment, producing Brazilian fuels, manufacturing, maintaining, and operating the vehicle. This cost will be presented in USD/km, considering anhydrous sugarcane ethanol and gasoline C (73% gasoline and 27% anhydrous sugarcane ethanol on a volume basis) as fuel, during a 10-year amortization period.
The vehicle volumetric fuel flow was obtained through Equation (1) from Braga [19], as follows:
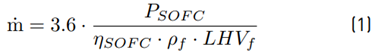
Where ṁ is the volumetric fuel flow of the SOFCEV in m³/h; PSOFC is the SOFC power in kW; ηSOFC is the average efficiency of the SOFC with heat recovery; ρ f is the fuel density in kg/m³; LHV f is the fuel lower heating value in MJ/kg.
Equation (2) e Equation (3) from Boloy et al. [20] were used to estimate the manufacturing cost over a 10-year amortization period:
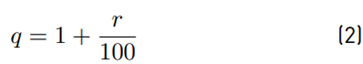
Where r represents the annual interest rate of 3.75%, referring to the Selic rate for April 2020; f represents the annuity factor in 1/year; q represents the capital value; k represents the amortization period in years. The manufacturing cost, fuel production cost, and the maintenance and operation cost are determined by Equation (4), Equation (5), and Equation (6), below:
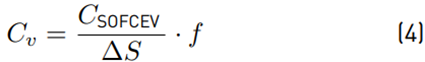
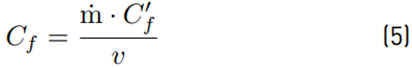

Where Cv represents the cost of vehicle equipment and components in USD/km; CSOFCEV represents the total manufacturing cost of the SOFCEV in USD; ∆S represents the vehicle life cycle in km/year, considering a life cycle of 150000 km in 10 years; Cf represents the fuel production cost in USD/km; C’f represents the fuel production cost in USD/m3; v represents the average speed of LDV on urban roads as 40 km/h, according to the Brazilian Traffic Code [21]; C%M&O represents the portion referring to the cost of maintenance and operation in USD/km; and %M&O is the percentage of the vehicle equipment and components cost that represents the cost of maintenance and operation, adopted as 10% [22].

Where Ca represents the total cost of Scenario A over a 10-year amortization period. For a more realistic analysis, the coefficient 1.23 was adopted, which includes additional expenses of 23% on investments in equipment, including land preparation (5%), design and engineering (10%), contingency (5%), and permission (3%) [22].
Scenario B
In this scenario, the emissions cost is added to Ca. Thus, the social cost resulting from the negative effects of the anthropogenic GHG emissions is now internalized, i.e., from the carbon taxation mechanism, WTW emissions of the SOFCEV are accounted for and taxed, without the acquisition of carbon credits. WTW emissions range from fuel production to vehicle circulation on urban roads.
Tank-to-wheel (TTW) emissions include the steps after the vehicle is supplied, i.e., the vehicle circulation and, eventually, the disposal or recycling of components. In this study, the TTW analysis includes only the exhaust emissions of the SOFCEV, obtained through Eq. (1) and the reactions that occur inside the SOFCEV. The hydrocarbon or alcohol fuel inserted into the fuel cell undergoes a steam-reforming reaction to produce H2, and the CO eventually formed during this process is consumed by the water-shift reaction, producing more H2 [23,24].
The equations for ethanol (C2H5OH) steam-reforming [Reaction 4] and water-gas shift reaction [Reaction 5] are as follow [25,26]:


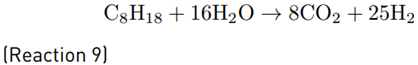
The octane (C8H18) is used as a gasoline surrogate for gasoline processing simulation, and the equations for octane steam-reforming [Reaction 6] and water-gas shift reaction [Reaction 7] are as follow [27,28]:


Therefore, the following global steam-reforming reactions were obtained for ethanol and gasoline, respectively [27,28]:
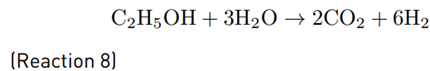
From the chemical reactions described above, it is possible to arrive at the CO2 emission factor, in kg of CO2 eq. per kg of fuel, calculated by Equation (8) [29]. Here, the CO2 emissions are considered as CO2 eq. emissions, since there are no emissions of methane, sulphur dioxide, nitrogen dioxide and particulates present in this simulated process. Additionally, the complete steam-reforming in the fuel processor was considered for simplification purposes. In practice, a small amount of fuel remains downstream of the SOFC due to incomplete reforming, thus, this remaining fuel is burned in the combustion chamber of the SOFCEV[17].
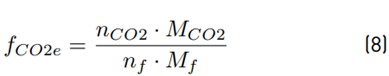
Where f CO2e represents the steam-reforming emission factor in kg of CO2 eq. per kg of fuel; ηCO2 and ηf represent the number of moles of CO2 and fuel, respectively, obtained from Reaction 8 and Reaction 9 ; M CO2 and Mf are the molecular weight of CO2 and fuel in g/mol. The values calculated from Equation (8) for ethanol and gasoline were 1.91 kg CO2 eq./kg and 3.08 kg CO2 eq./kg, respectively. The total cost of Scenario B is given by Equation (9), as follows:
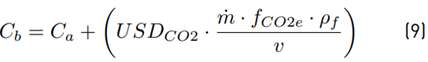
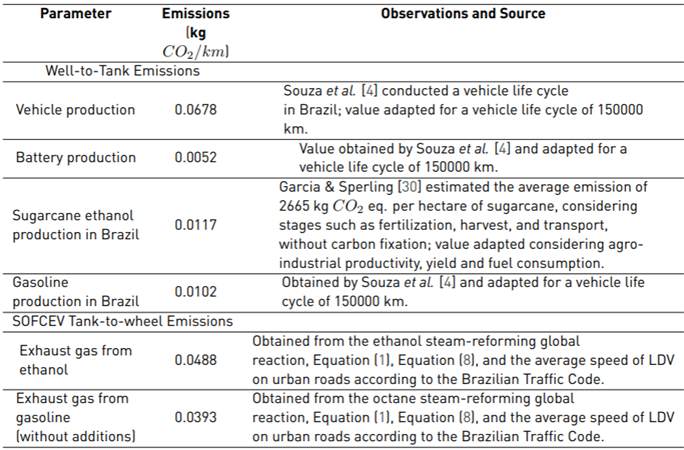
Where C b represents the total cost of Scenario B in USD/km; USDCO2 is the rate attributed to the kg of CO2 emitted in USD/kg CO2; P f is the fuel density in kg/m 3 . Well-to-tank emissions (i.e., vehicle, battery, ethanol, and gasoline production), as well as the estimate of TTW emissions (i.e., exhaust gas emissions) for the SOFCEV are explained in Table 1. The TTW emission of the vehicle was calculated considering volumetric fuel flow, steam-reforming emission factor, fuel density, and the average speed of LDV on urban roads according to the Brazilian Traffic Code.
Scenario C
In this scenario, the carbon fixed by sugarcane plantations will be counted when considering the Brazilian sugarcane ethanol pathway. Carbon fixation is the photosynthetic reaction that occurs between atmospheric CO2 and water to generate organic products needed by plants. Thus, Equation (10) presents the adaptation of the methodology used by Neamhom et al. [31] and the United States Environmental Protection Agency [32] to estimate carbon fixation by sugarcane plantations:
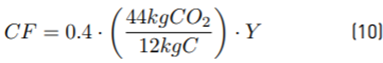
Where CF represents the carbon fixation per hectare of sugarcane in kg CO2/ha; 0.4 is the conversion factor, which is a ratio of carbon in biomass in the photosynthetic reaction, as follows: CO2 + H2O → CH2O + O2; (44 kg CO2/12 kg C) is the ratio of the molecular weight of carbon dioxide to carbon; 𝑌 is the sugarcane productivity per hectare in kg/ha.
To estimate the cost of fixed carbon when meeting the SOFCEV ethanol demand, Equation (11) was used, as follows:
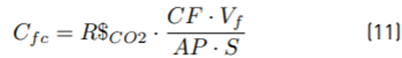
Where Cfc represents the economy based on the carbon fixed by sugarcane plantations during the production of the ethanol needed to supply the SOFCEV demand in USD/km; Vf represents the volume of ethanol consumed during the vehicle life cycle in m3; AP represents the agro-industrial productivity of Brazilian ethanol in m3/ha; S represents the vehicle life cycle in km. Therefore, the total cost of Scenario C is determined by Equation (12), as follows:

Where Cc represents the total cost of Scenario C, considering the carbon fixed by sugarcane plantations during ethanol production in USD/km. Through Equation (12) the existence of a simplified market for the sale of carbon credits is considered. In this case, it would be possible to sell the credits referring to the fixed carbon value, and thus deduct from the total costs. However, it is assumed that there is no maximum emissions limit for the sector (cap). The additional costs resulting from the operation of the carbon market due to the lack of regulation worldwide have not been considered. In Brazil there are recent sectorial initiatives such as the decarbonization credits from RenovaBio, aimed at the certification of producers and importers of biofuels in the country[12].
2.3 Net Present Value
To analyse the economic feasibility of the SOFCEV in the Brazilian scenario, the NPV method was used. Economically speaking, a present value represents the estimate of how much a future expense is worth in the present, considering the value of money over time through a discount rate [33]. Therefore, the higher the NPV, the greater the business viability.
The following Equations were used to determine the NPV for the final consumer[34]:
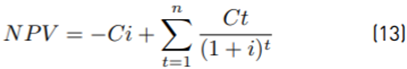
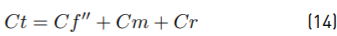
Where Ci is the SOFCEV purchase price, in USD, considering 10% profit for the manufacturer; Ct is the cost of maintenance and operation of the vehicle in USD/year; i is the discount rate for the Brazilian scenario, adopted as 12.7% [35]; t is the investment year; n is the number of investment periods; Cf′′ is the cost of fuel in USD/year; Cm is the cost of vehicle maintenance in USD/year; Cr is the battery replacement cost, in USD/year, considering only one replacement with its cost diluted among the investment periods. The following assumptions were adopted to analyse the economic feasibility of the SOFCEV for the consumer:
Average annual travel of 15000 km/year for 10 years [14,34];
Maintenance cost equal to 164.86 USD/year [34];
Battery replacement after 100000 km of the vehicle lifetime, with the cost of 10% of the vehicle purchase price [34];
Cost of ethanol to the consumer equal to 269.48 USD/year in Scenario A [36] and 147.29 USD/year in Scenario C;
Cost of gasoline C to the consumer equal to 295.49 USD/year in Scenario A [36] and 309.19 USD/year in Scenario C.
Motor Vehicle Property Tax (IPVA) exemption for theSOFCEV ownership in Brazil.
2.4 Assumptions Adopted
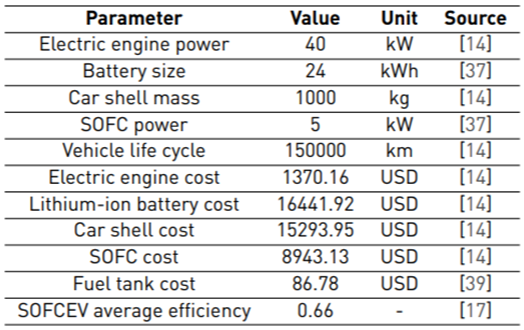
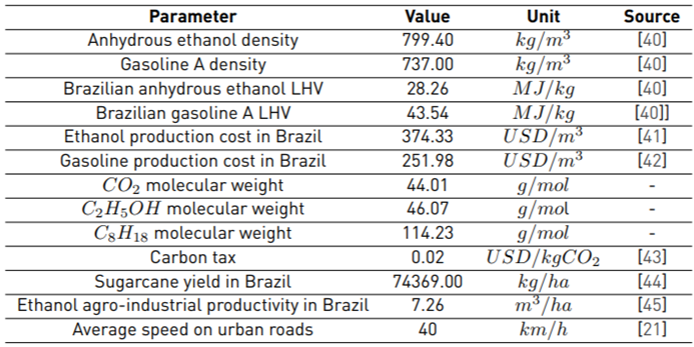
The assumptions adopted to estimate the SOFCEV conventional LCC, NPV, WTW emissions and carbon fixed by sugarcane plantations are shown in Table 2 and Table 3. The powertrain specifications were based on the Nissan prototype ethanol-powered “e-Bio Fuel-Cell”. Furthermore, the vehicle itself is based on the e-NV200, which has a 24-kWh lithium-ion battery, a SOFC output in the order of 5 kW, a 30-liter fuel tank capacity, and an estimated range of 600 km or more [37]. The density and LHV of gasoline C were calculated considering the volume proportion of 73% gasoline A (i.e., pure gasoline) and 27% anhydrous ethanol, resulting in 755.23 kg/m³ and 38.99 MJ/kg, respectively. In addition, a vehicle life cycle of 150000 km in 10 years of circulation was considered, without considering the cost of changing to a new cell after that period. An average agro-industrial productivity between first and second generation Brazilian ethanol was considered. Finally, for conversion purposes, the average dollar price in 2020 was adopted as 1.14 USD/EUR and 0.19 USD/BRL [38].
3. Results and Discussion
In the present study, the conventional LCC assessment aimed to assess the possibility of the SOFCEV cost reduction based on the purchase and sale of carbon credits at a price equivalent to 0.02 USD per kg of CO2. According to Qiao et al. [46], it is estimated that the LCC of the BEV is 9% higher than that observed for the ICEV in 2020 in China, while in the same period, the GHG emissions of the BEV were 29% lower than that observed for an ICEV. This fact confirms the climatic benefits resulting from the advance of electromobility. The main reason for this cost difference is related to the high cost of production of the BEV, leading them to still depend on support policies and subsidies to encourage the increase of their representation in urban fleets.
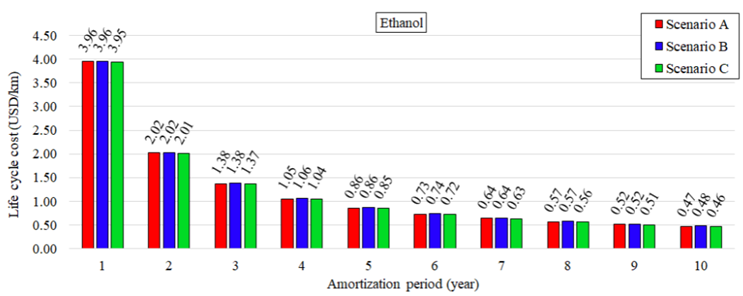
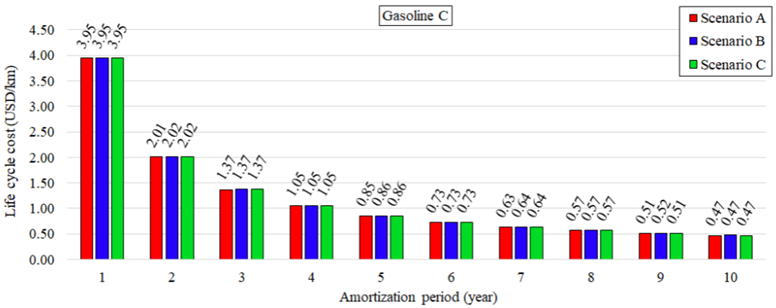
Figure 3 and Figure 4 provide a comparison between the three scenarios considered in the study, which are: a) Cost of investment in equipment, fuel production, and vehicle maintenance and operation in USD/km, over a 10-year amortization period; b) Cost of CO2 emissions of the SOFCEV from WTW added to cost (a); c) Cost of carbon fixed by hectares of sugarcane in Brazil necessary to supply the fuel demand of the SOFCEV subtracted from (b). The SOFCEV fed with ethanol [Figure 3] presented the lowest LCC in Scenario C, having benefited from the sale of carbon credits, considering the avoided cost during fuel production from carbon fixation by plantations of sugarcane.
Therefore, the greater the agro-industrial ethanol productivity, the greater the benefits of carbon pricing under the vehicle LCC, since the use of agricultural waste to produce second-generation ethanol increases the volume of ethanol produced per hectare of sugarcane. Gasoline C [Figure 4] showed similar results in Scenarios A and C. Therefore, it can be said that the use of fossil fuels, even with the addition of biofuels, does not significantly benefit from the acquisition and sale of carbon credits. In addition, the carbon fixed by plantations equivalent to the volume of sugarcane ethanol added to gasoline C was responsible for making the LCC stable in Scenario C.
According to results obtained by Qiao et al. [46], the ICEV presented a LCC of 36723.00 USD in 2020 under driving cycle in Beijing, and the BEV presented a LCC of 39935.00 USD under the same conditions. This represents an estimated LCC of 0.24 USD/km for the ICEV and 0.27 USD/km for the BEV. Under a 10-year amortization period, the SOFCEV presented an average LCC of 0.47 USD/km in Scenario C, which demonstrates a persistent lack of competitiveness compared to the vehicles analysed by Qiao et al. [46]. The high LCC of the SOFCEV is strongly related to the high cost of the components, especially the SOFC and the lithium-ion battery, so that the acquisition and sale of carbon credits is not sufficient to overcome this economic barrier.
Figure 5 shows a comparison between the fuel production cost, the emissions cost, and the avoided cost from carbon fixation in USD/vehicle. It is possible to affirm that the SOFCEV fed with ethanol reaches neutrality in the carbon cycle, since the avoided cost from the fixed CO2 emissions is 1.1 times higher than the cost of WTW emissions. The SOFCEV fed with gasoline C presented an emission cost 2.5 times greater than the cost avoided by carbon fixation by sugarcane plantations. In 2019, the average production price of Brazilian ethanol was about 1.3 times higher than that observed for gasoline C in the country [41,42]. With the high avoided cost for ethanol [Figure 5], the fuel becomes more competitive than gasoline C in a scenario of commercialization of carbon credits, having an ethanol production cost of around 308.18 USD/vehicle over its entire life cycle. This new cost of ethanol production is 3.8 times lower than that observed for gasoline C under the same circumstances.
Regarding TTW emissions, the SOFCEV with an average efficiency of 66% fed with ethanol and gasoline C was 48.75 g CO2/km and 48.34 g CO2/km, respectively. Such values are similar because the LHV of gasoline C is about 11.67% greater than that observed for ethanol, causing the flow of gasoline C in the SOFCEV to be lower. Thus, the exhaust emission presented by ethanol is comparable to that of gasoline C, even though the latter is a fuel of predominantly fossil origin. For the Brazilian context, according to Souza et al. [4], the ICEV on Brazilian urban roads presents TTW emissions around 191 g CO2 eq./km and 162 g CO2 eq./km when fed with regular gasoline and E25 gasoline (75% gasoline and 25% anhydrous ethanol in volume basis), respectively. For ICEV with more developed fuel economy, emissions are around 134 g CO2 eq./km when fuelled with gasoline [5].
Within the electric vehicle category, the Hybrid Electric Vehicle (HEV) and the Plug-in Electric Hybrid Vehicle (PHEV) are the main models with exhaust emissions. Both HEV and PHEV have, at the same time, one electric engine and one engine powered by internal combustion. However, HEV uses a regenerative braking system to supply electricity to the electric engine, whereas PHEV has the possibility to supply the electricity demand through external sources [47]. The light-duty HEV emits around 84 g CO2 eq./km, while more modern models of light-duty PHEV have emissions in the order of 26 g CO2 eq./km [5]. Therefore, TTW emissions from the SOFCEV exceed those from PHEV, but show a good result compared to TTW emissions from ICEV and HEV.
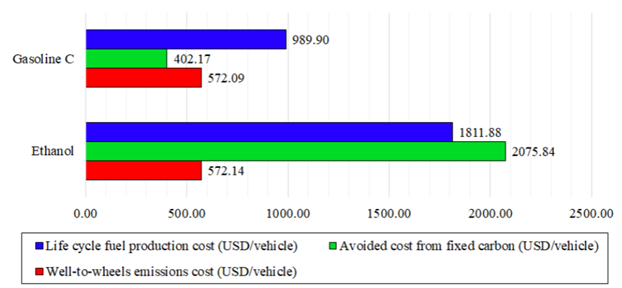
Figure 5 Comparison between the SOFCEV life cycle production cost, emissions cost, and avoided cost from carbon fixation in USD/vehicle
An analysis of WTW emissions is more extensive, also considering the steps that precede the supply and circulation of the vehicle. The ICEV under Brazilian conditions has WTW emissions in the order of 291 g CO2 eq./km for E25 gasoline and 97 g CO2 eq./km for hydrated ethanol (addition of 5% water) [4]. In the production stage of the ICEV, approximately 50% less emissions are generated than in the production of alternative vehicles (e.g., BEV). However, this situation tends to change with the optimization of processes and the wide insertion of these new technologies in the market [5]. Choi et al. [48]reported that, for the South Korean electric matrix based on coal and with 4% renewable sources, the average WTW emissions for the BEV are 109 g CO2 eq./km. Meanwhile, for the Brazilian scenario, the BEV has emissions of around 18 g CO2 eq./km [49]. According to the Brazilian Energy Balance of 2018, 83.2% of all national electricity produced came from renewable sources [50]. Therefore, what justifies such low WTW emissions for BEV in circulation in Brazil is the mostly renewable national electricity matrix with a reduced carbon footprint.
WTW emissions from HFCEV can be high depending on how hydrogen is obtained. In a WTW analysis, Yoo et al. [51] reported that for the South Korean scenario, the HFCEV emissions range from 50 to 388 g CO2 eq./km, where hydrogen production from landfill gas generated the lowest emissions, while production by electrolysis generated the largest emissions due to the high emission factor of the national electric matrix. Nevertheless, in a scenario of high demand for hydrogen, the use of HFCEV becomes less favourable than the use of BEV, since the energy consumption of BEV in its life cycle will be lower, leaving more energy available for stationary uses [52]. Solutions such as the SOFCEV, with the insertion of fuel processor and the use of residual heat for internal reforming, could favour the dissemination of vehicles with fuel cell.
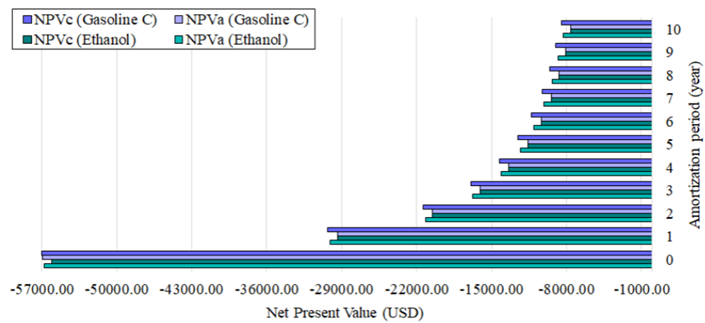
Figure 6 shows the results of economic feasibility for the Brazilian consumer obtained through the NPV method. Initially, as representative of the current scenario, the analysis was carried out without considering carbon pricing (NPVa), followed by an analysis considering the acquisition and sale of carbon credits by the Brazilian fuel sector (NPVc). It is possible to reaffirm the positive effects of carbon pricing under the ethanol chain, since the annual expenditure on ethanol goes from 263.99 USD/year to 144.29 USD/year, while gasoline C goes from 289.47 USD/year to 302.89 USD/year, turning ethanol into a more economically attractive biofuel to consumers.
After the 10-year period for amortizing the technology, the SOFCEV had an average NPV of -USD 8006.38. The reduction in annual fuel expenditure experienced by the ethanol-fuelled SOFCEV was not sufficient to make the technology more suitable for the Brazilian scenario. The main factor that makes the technology unfeasible is the replacement of the battery after 100000 km of the vehicle lifetime. According to Chiaradia [34], in 2015 a BEV in circulation in Brazil would have an NPV equal to -USD 436.37 in relation to the NPV of a conventional ICEV when stipulating the same purchase price for both, that fact corroborates for the interpretation that replacing the battery of an electric vehicle is the main factor that makes it expensive.
4. Conclusion and Further Work
A feasibility analysis (conventional LCC and NPV) of the SOFCEV fuelled with Brazilian fuels was presented together with the estimate of the vehicle TTW and WTW emissions under national conditions, considering the Brazilian sugarcane ethanol pathway. Scenarios B and C, in which carbon taxation was applied, showed a small cost difference, but indicate a better performance of biofuels compared to fossil fuels, considering the avoided cost due to carbon fixation during the cultivation of sugarcane for ethanol production. Regarding exhaust emissions, the SOFCEV with Brazilian fuels showed better results than that observed for ICEV and HEV.
It was possible to state that the SOFCEV fed with sugarcane ethanol reaches neutrality in the carbon cycle, since the avoided cost from fixed CO2 emissions is 1.1 times greater than the cost of WTW emissions. The same is not true for the SOFCEV fuelled with gasoline C, where the emissions cost is 2.5 times higher than the cost avoided by carbon fixation. In 2019, the average price of ethanol production surpassed that of gasoline C, with a tax of 0.02 USD per kg CO2 emitted; the high avoided cost in the production of Brazilian ethanol made the fuel become more competitive than gasoline C, with a production cost of around 308.18 USD/vehicle. This new cost of ethanol production is 3.8 times lower than that observed for gasoline C. Finally, carbon pricing was not sufficient to make the technology more viable for consumers, with an expected NPV of -USD 8006.38 after the 10-year amortization period.
Therefore, the study suggests that carbon pricing tends to target consumer demand for less carbon-intensive products and services, considering the better economic performance of the SOFCEV supplied with ethanol from the acquisition and sale of carbon credits. The application of the carbon taxation mechanism presents the potential to favour the use of biofuels. However, under a 10-year amortization period, the sale of carbon credits was not able to generate sufficient advantages to make the SOFCEV competitive compared to vehicles already established in the market, such as BEV and ICEV, given the high cost of powertrain production.
For further work, the analysis is indicated considering the other carbon pricing mechanisms (e.g., carbon cap and carbon cap-and-trade), since carbon policies are still under development on a global scale [9], and, therefore, there is no consolidated database. In addition, the energy, economic and environmental analysis of the SOFCEV operating with other biofuels is also indicated.

