


 Inglês (pdf)
 Artigo em XML
 Referências do artigo
 Enviar este artigo por email
 Citado por SciELO
  Citado por Google
  Similares em
SciELO
Similares em
SciELO  Similares em Google
 Permalink
1. Introduction
The pedestrian within a mixed transportation system interacts at an obvious disadvantage [1]. Crosswalks (unsignalized and mid-block) require waiting for a gap or convenient vehicle separation for pedestrians. According to Roess et al. [2], this task is risky because one of the most complex problems that arise on the roads is the reciprocal relationship that exists between the vehicle and the pedestrian leading to a considerable amount of traffic accidents and pedestrian deaths.
Analysing the acceptance of a gap is relevant for improving safety on urban and rural roads for pedestrians. According to data from the World Health Organization, 22% of all road deaths were pedestrians and, in some countries, this proportion is as high as two-thirds [3]. Other studies have also found that the proportion of pedestrian deaths among all road deaths in low, middle, and high-income countries were 227,835 (45%), 161,501 (29%), and 22,500 (18%), respectively [4]. This indicates that pedestrians are especially vulnerable in developing countries and warrants further studies to obtain a better understanding of pedestrian behavior [1] and specifically pedestrians crossing mid-block. According to a study of pedestrian accidents in urban centers in Spain [5], most traffic accidents did not occur at intersections but inbetween them. This indicates that these tragedies should be considered as something both predictable and avoidable. These phenomena were also studied in Colombian cities [6] using geographic information tools.
According to Burgos [7], one of the factors that has the greatest influence on pedestrian behavior is infrastructure. This is due to the fact that an inadequate pedestrian network is inefficient and may pose a greater risk of accidents. In Colombia, the urban environment is characterized by extensive blocks with few crosswalks inbetween. This feature results in increased vehicle speeds while making pedestrian crossings more dangerous. Since controlled crossings are only located at intersections, a pedestrian who wants to cross the street sooner will inevitably decide to cross midblock where it is shorter, but more dangerous.
Despite the fact that adequate infrastructure is available at some intersections, these features are not present throughout the city. As a result, the average pedestrian will encounter an area that shares infrastructure with vehicles. In developing countries such as India, the roadway generates complex interactions [8] due to the number of vehicles and the presence of motorcycles. In 2013 and 2014 alone, more than 80% of the motor vehicles sold in India were two-wheeled [1].
In India and other developing countries, traffic regulations are not strictly followed. At unexpected crossings, pedestrians are seen as obstacles that restrict vehicular flow [9]. Vehicles do not usually yield to pedestrians resulting in pedestrians having to wait for an adequate distance or time (gap) to cross the street. Pedestrians often misjudge distance (especially in high-speed sections), resulting in accidents [9].
The human factor is a fundamental element [10] to the safety of both drivers and pedestrians. According to Roess et al. [2], 96% of traffic accidents in the United States were caused by driver error. In Colombia, 6,718 people died in traffic accidents in 2017, of which 1,790 were pedestrians, according to data from the Observatorio Nacional de Seguridad Vial de Colombia [11]. Almost one in four people killed in traffic accidents were pedestrians. According to Radelat [12], these events could be the product of a disregard of traffic laws by pedestrians since they are typically less likely to follow traffic laws. Understanding the behavior of pedestrians and drivers in traffic conditions will help determine when a pedestrian considers their interaction with vehicles to be safe.
2. Concepts
Macroscopic variables. Speed, density, and flow are considered to be the macroscopic variables of traffic. They serve as a mathematical tool to determine and indicate the values of quality and service level.
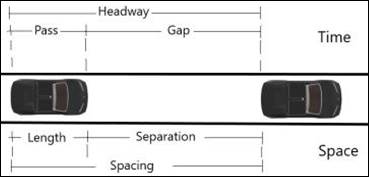
Microscopic variables. Microscopic variables are considered to be those related to the behavior of the driver or pedestrian as an individual in the flow of traffic (see Figure 1]. If measured in time, we consider: the headway, which is defined as the time that has elapsed between passing two identical points of vehicles or people; the pass, which is the time it takes for a vehicle or pedestrian to travel its own length; and finally, the gap, which is the time between consecutive vehicles. Each of the microscopic parameters has an equivalent in space which are identified as: spacing, length, and separation.
According to Burgos [7], there are other microscopic pedestrian variables that define the pedestrian flow. Among the most important of these are body ellipse, effective walking width, platooning, and pedestrian groups. Pedestrian traffic is also affected by factors that have to do with the environment, pedestrian mood, the reason for travel, time of day, and various other factors.
Gap. It is the time in seconds between two vehicles in the flow of traffic, measured from the rear bumper of one vehicle to the front bumper of the next vehicle measured in seconds [10].
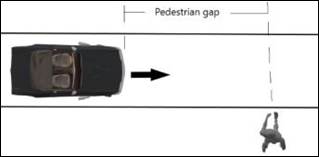
Pedestrian gap. The pedestrian gap is when a pedestrian judges the time between vehicles as a reference so they can perform the road crossing safely. Some authors suggest that a better description of the pedestrian gap can be made by considering the vehicle-pedestrian interaction only, where the time in seconds between a moving vehicle approaching a pedestrian intending to make a road crossing is measured. Consequently, the gap would be the time between the pedestrian and the oncoming vehicle at the moment the pedestrian begins crossing [13], as shown in Figure 2.
Critical gap. Time in seconds below which a pedestrian will not cross the street [13].
The critical gap can be defined as the minimum time required for a pedestrian to make a safe crossing. Pedestrians often misjudge the gap resulting in accidents, especially in high-speed sections [9]. Smaller critical gaps have been found in India [14] than in other countries.
Safety margin. It is the difference measured in seconds between the time in which the pedestrian finished crossing the road and the exact time the vehicle passes through the crossing point [15], see Equation (1). The lower the safety margin, the greater the risk at the crossing. [16].

Where SM: Safety margin, PG: Pedestrian gap, and CT: Pedestrian crossing time.
Crossing in two stages. According to Elefteriadou [13], when there is a separator or median, pedestrians typically cross in two stages resulting in separate estimations for each stage.
Mid-block crossing. Is a road crossing made by a pedestrian on a route between intersections without the markings and protection required for the pedestrian safety.
Platoon. Burgos [7] defines a platoon as a group of pedestrians formed due to the presence of a control device such as a traffic light or waiting for an adequate gap at a crossing. Platoon formation is important to determine the capacity and level of service in a crosswalk area.
Pedestrian desire line. Desire Lines are the imaginary lines that pass over the most efficient or most used route by a pedestrian or a cyclist. This term was first enunciated in French by the philosopher Gaston Bachelard. These lines can be interrupted by urban barriers if the design is not focused on pedestrians. These paths usually represent the shortest or most easily accessible path between a given origin and destination.
Desire Lines usually appear as shortcuts in places where roads have a less practical route. They tend to appear very frequently in parks. People naturally choose these paths, which are clearly marked by an eroded trail as a guide on their journey [17].
Desire Lines are not commonly studied in Spanish-speaking countries, but in other countries such as the Netherlands, they have their own name to describe this anthropological phenomenon. Here they call it Olifantenpaadjes, meaning “elephant roads”.
On the other hand, the action of a midblock pedestrian crossing can be attributed to the desire lines. According to the rights of pedestrians [18], road users tend to use a physical or virtual trail when moving from one point to another by intuitively calculating the shortest distance between them. Seen from the point of view of psychology, Rosenbloom [19] considers that "behavior is indicated by the stimuli that precede it, shaped and controlled by the reinforcing stimuli that follow it". In other words, human beings by nature act in such a way that their activities are optimal; this explains the decisions of pedestrians to take routes different from those established and cross in places that shorten their path, especially if they are midblock.
Dilemma zone. The dilemma zone is a segment on a road in which the presence of vehicles results in a state of confusion for a pedestrian when crossing [9]. “This area is basically formed by vehicles moving on the road due to the perception of a pedestrian crossing on the road that seek to accept the safe gap. When a vehicle on the road arrives within this zone, crossing pedestrians will be in a state of indecision as to stop or continue moving. When vehicles are in this area, pedestrians can make the wrong choice, and these risky behaviors can lead to accidents at midblock crossings” [9].
The perception of safety depends on various parameters such as: the characteristics of pedestrians or types of behavior, characteristics of the vehicles in conflict, and the surrounding environment [9]. This creates a condition of confusion or pedestrian dilemma which occurs while making the decision about whether to accept or reject a gap. The dilemma should be viewed as a critical gap range that offers design criteria to provide safe steps.
The crossing behavior associated with physical, psychological, and educational aspects such as those proposed by Zegeer et al. [20] found that elderly pedestrians often feel affected by physical fatigue, so they wait longer to cross. Similarly, Li et al. [21] found that in places where students go to an elementary school, the crossing facilities were designed according to the characteristics of adult crossing behavior, exposing children to danger. This makes research on the similarities and differences in crossing behavior between children and adults very significant.
Pedestrian crossing speeds of adults and the elderly have been the subject of most research in recent decades. The Highway Capacity Manual [13] recommends considering a passing speed of 1.2 m/s. Walking speed is dependent on the proportion of elderly pedestrians (65 years or older). If the proportion of elderly pedestrians is greater than 20%, it is reduced to 1.0 m/s. Gates et al. [22] found that a designed crossing speed of 1.0 m/s was adequate at intersections with traffic lights located in areas with elderly pedestrians; likewise, this speed was suggested by Knoblauch et al. [23] and Bennett et al. [24].
Zeedyk [25] studied the crossing behavior of single children and those accompanied by an adult. The results revealed that adults cross reasonably well, but children cross extremely dangerously when they cross alone. This is attributed to the fact that parents seldom take advantage of the crossing as an opportunity to explicitly teach children traffic safety techniques.
Ferenchak [1] found that the time required for pedestrian crossings and the awareness of using marked crosswalks increases with age. He found that vehicle-pedestrian conflicts decrease as a pedestrian becomes older. His study also found that pedestrian wait times were different between men and women, with men waiting half the time of women. Men were also twice as likely to cause vehicle conflicts than women. These patterns help to understand the behavior of pedestrians in relation to vehicle traffic in urban areas of developing countries to create the safest system possible.
Additionally, behavioral aspects that influence the individual decision to assume risk by pedestrians have been studied since they frequently become impatient while waiting to cross the street [26]. If an impatient pedestrian is willing to wait for a shorter gap, then they are more likely to enter a risky situation when crossing the road; similarly, pedestrians who choose not to use the pedestrian crossing infrastructure are also more likely to enter risky situations [27].
Several studies such as [28-30], and [20] found that the gender of a pedestrian is an important characteristic in determining behaviors such as waiting time and propensity towards taking risk. Male pedestrians have been found to be more willing to violate regulations and make unsafe crossing decisions. They are also less likely to perceive the risk when crossing a road in the presence of vehicles. Men also tend to expect shorter time gaps than women [31]. Consequently, men have significantly higher walking speeds than their female counterparts, possibly related to their short wait times [32]. These characteristics result in men representing up to 80% of pedestrian deaths [33].
Pedestrian speeds are significantly related to age, with speed decreasing as age increases. Pedestrians between the ages of 21 and 30 have been found to be the group showing the highest walking speeds in a gap [34].
Yang et al. [35] also studied driver behavior but found that pedestrians have a greater influence on traffic through their crossing decision. Drivers are supposed to stop or slow down when identifying pedestrians at marked crossings. By doing this, traffic is well organized; but if not, conflicts between pedestrians and vehicles occur. Similarly, different pedestrian gap acceptance criteria influence traffic with higher or lower speeds and the threshold of acceptable pedestrian waiting time influences traffic flow.
Considering the important role of pedestrian crossing behavior in traffic systems, Yang’s study shows that pedestrians behave heterogeneously when crossing the road; that is, pedestrians have heterogeneous criteria of acceptable distance, make different decisions for the same situation, and are heterogeneous in their walking speeds at the crossing.
According to Kadali [36], pedestrians are prone to crossing midblock when there is a significant distance between appropriate crosswalks and there are no traffic controls. In traffic, it is common for acceptable gaps to become scarce at these points, causing the pedestrian to become increasingly impatient as the waiting time increases, thus, risking unsuitable gaps to make a safe crossing. As a result, midblock crossings are critical points with an increased probability of accidents and where road safety should be focused [37].
Various methods have been developed to determine the acceptable pedestrian gap. Yannis et al. [38] used a normal logarithmic regression model to examine the effect of various parameters on pedestrian gap acceptance. Similarly, Papadimitriou et al. [39] discussed the discrete choice models used by researchers to determine pedestrians’ deciscions when crossing a stretch of road.
Pawar et al. [9] used probabilistic methods for their analysis of the dilemma zone for pedestrians at uncontrolled midblock crossings on expressways. They clearly state that pedestrians accept all gaps greater than the critical distance and reject those which are less than the critical distance.
The behavior of midblock crosswalks near an elementary school was studied by Li et al. [21]. The data was examined using the analysis of variance (ANOVA) and the chi-square test to analyze the results. Similarly, Ferenchak [1] used quadratic and logistic regressions to assess the age and gender of pedestrians in relation to the behavior of mid-block crossings in India. Finally, Kadali et al. [40] evaluated the behavior in mid-block crossings using artificial neural networks.
Kadali et al. [36] evaluated pedestrian safety at unprotected mid-block crossings in mixed traffic conditions and found that pedestrian safety can be assessed using proactive methods (conflict techniques). The proactive method is an efficient technique compared to analyzing accident history. Pedestrian safety studies based on proactive methods are necessary due to the increasing number of pedestrians crossing mid-block. This is denoted as marginal pedestrian safety (PSM), which is the difference between the time between vehicles in the gap accepted by pedestrians and the actual crossing time (based on field conditions).
The interaction between vehicles and pedestrians at mid-block crossings using movement rules based on single-cell automata was studied by Chen et al. [41]. The movement of vehicles taking into consideration the three-second rule (time lost at the start of the crossing maneuver) and a modified two-way pedestrian model was developed in order to account for movement preference and resolve the conflict between mixed flows.
Xin et al. [34] created pedestrian crossing models with vehicular interference while also proposing a model of pedestrians and vehicles with cellular automata (CA) to study the characteristics of mixed traffic. The model includes two submodels, one of them is the pedestrian model, where heterogeneity is considered, and the other is the vehicle model, which considered a safe mode of operation and a mode with normal operating conditions. Yang et al. [35] used a multi-state social force-based model to represent the interaction between vehicles and pedestrian crossing situations.
3. Method
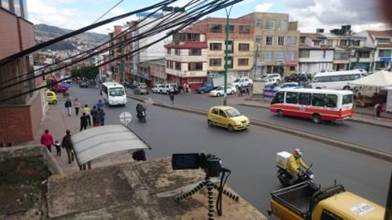
A random sample of gaps accepted by pedestrians was taken during a period of high pedestrian and vehicular traffic on a street with four lanes and a 1.5m wide median. The sample size was 153 pedestrian accepted gaps and if we assume a normal distribution of the gaps, the confidence level of the sample was 98.1%, with a maximum permissible error of 0.4 seconds. The video recording in the selected area was used to collect information over a period of three hours. See Figure 3.
We used landmarks on the street such as posts and objects on the sidewalk to establish the distance traveled by the pedestrian and the vehicle, as well as their respective speeds. Each of the characteristics taken as variables for the database is explained below:
Gaps rejected. This corresponds to the number of gaps the pedestrian allows to pass before taking the one they consider acceptable.
Vehicle type. Three possible values were taken for the following vehicle type: Motorcycle (M), Automobile (A), and heavy vehicle or bus (B).
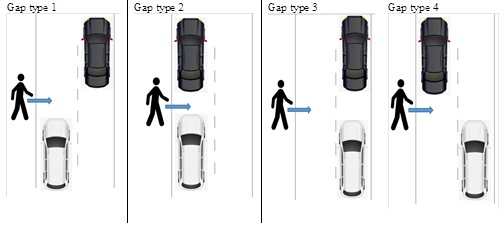
Gap type. This parameter was analyzed from the observation of pedestrian behavior with respect to the vehicle. The observation of gaps in a double lane road and one-way road suggested the possibility of a preference of the pedestrian for the arrangement of vehicles that offered a gap considered acceptable for crossing. Therefore, the gap was classified into the following types, as seen in Figure 4.
Walking time. The time it takes to cross two lanes of traffic heading in one direction, in a single pass.
Crossings made between vehicles at different times or waiting within the lanes were not considered for this study.
Pedestrian accepted gap. The time in seconds between the rear of the first vehicle after one second in which a pedestrian crossed the road in one direction of road traffic. The values taken were not broken down by direction.
Safety margin. The difference between the gap time and the walking time it took for the pedestrian to pass both lanes.
Group crossing. Crossing the roadway in a group of more than two people called a platoon.
Gender. Identifying whether the pedestrian crossing is visually male or female.
Age. Identifying whether the individual was a child, adolescent, adult, or elderly individual.
Disability. Identifying whether the pedestrian had any difficulty with their mobility.
With packages. Identifying whether the pedestrian crossing is carrying an extra load, either packages or babies.
With children. Identifying whether the pedestrian is helping a child or children who require assistance during the walk.
Running. Identifying whether the pedestrian crossed by running.
Desire line. The physical configuration of the route used for the crossing of the two lanes.
Vehicle volume. The number of vehicles that passed through a point or cross-section of a road during a certain period.
Pedestrian volumes. The number of pedestrians that pass through a point or cross-section of a road during a certain period.
4. Results and discussion
The sample size was 153 pedestrian accepted gaps with sample reliability of 98.1% and a maximum admissible error of 0.4 seconds. We found that the average gap value was 5.4s and that the data had a high standard deviation (2.11s). Normality tests were performed, which showed that the data fit a normal distribution curve.
4.1 Comparison by gender
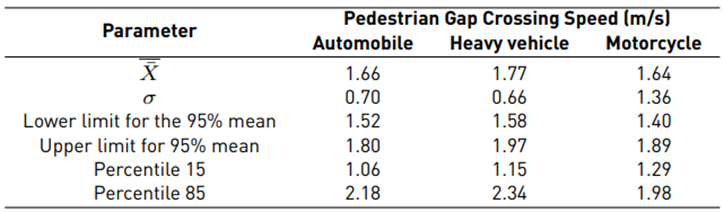
A comparison was made between the gaps accepted by men and women, as well as the walking speed used to cross the road. It was observed that men cross at a higher speed than women, while accepting shorter gaps. This means that the size of the accepted gap is proportional to the crossing time. See Figure 5 and Table 1.
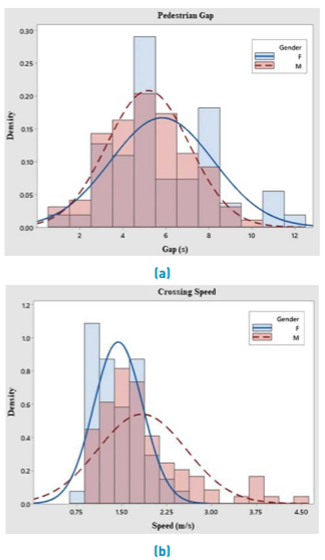
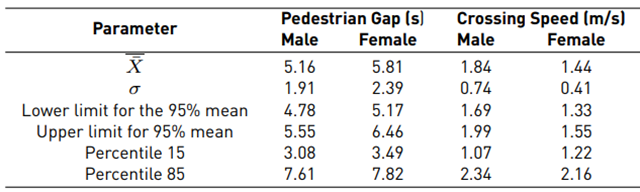
A hypothesis test was carried out to determine significant differences and mean gaps equal to a 95% confidence, with a t value of -1,829 and a P-value of 0.07. The variances were also found to be statistically different from a 95% confidence, so the Mann-Whitney W test was performed to compare the medians and found that they are statistically equal to 95%. Additionally, the distributions of the two samples were compared using the Kolmogorov-Smirnov test and were found to be statistically equal to 95%.
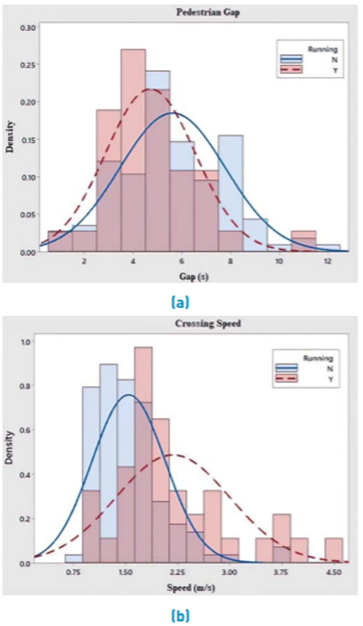
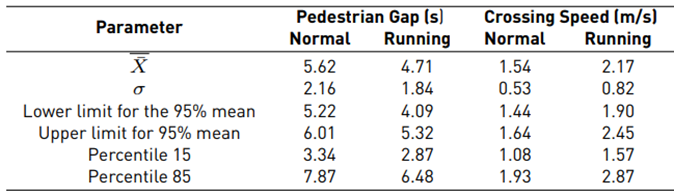
4.2 Comparison to pedestrians running
A hypothesis test was performed to determine significant differences and mean gaps were found to be different from 95% confidence, with a t value of 2.51 and a P-value of 0.01. The same test was carried out, taking into consideration gender, which found significant differences. See Figure 6 and Table 2.
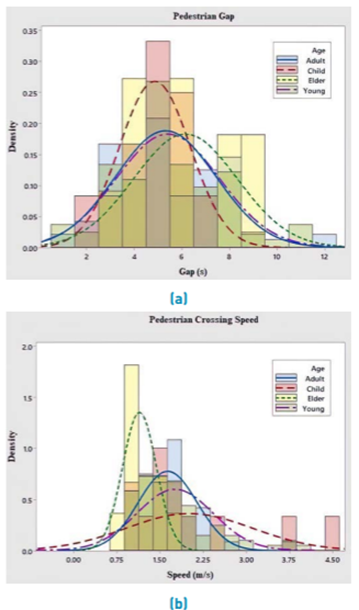
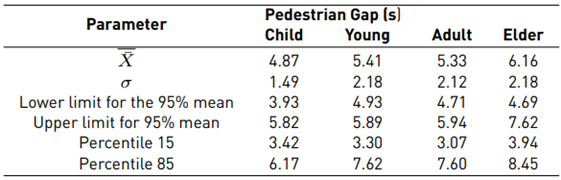
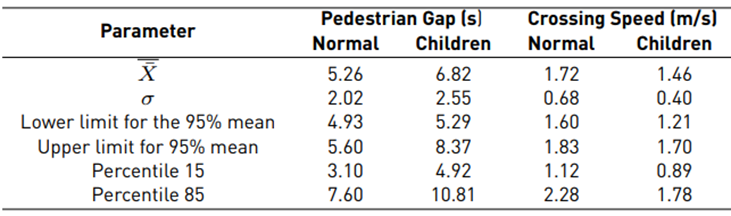
4.3 Comparison by age
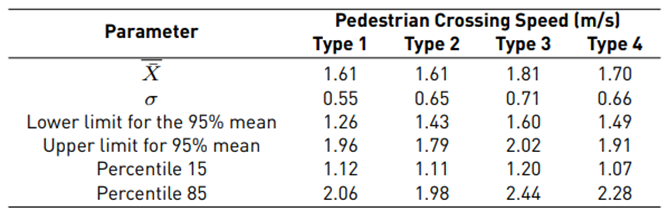
An ANOVA table shows no significant difference between the gaps accepted by pedestrians based on their age range, as seen in Figure 7 and Table 3. Older adults have a significantly slower crossing speed than the other age categories which had no significant differences between them. See Figure 7 and Table 4.
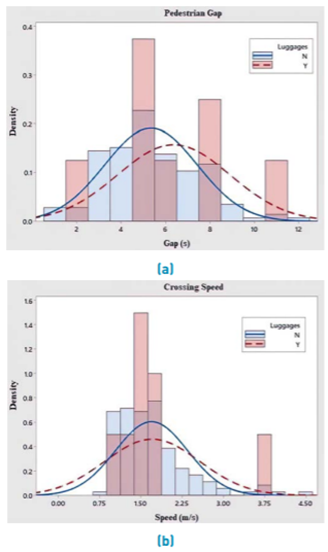
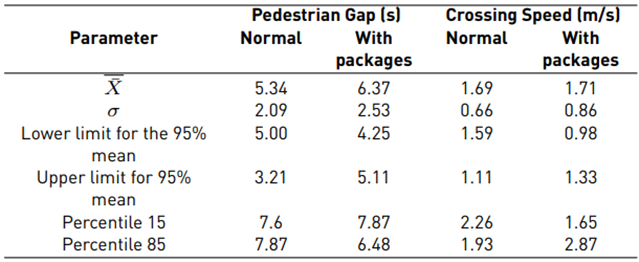
4.4 Comparison of pedestrians with packages
This category includes people who carried packages or items in their arms as well as those who carried babies. A hypothesis test revealed that the mean gaps are equal to a 95% confidence with a t value of 1.12 and a P-value of 0.299.
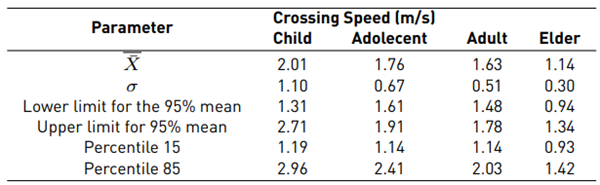
The same result was obtained for the crossing speed with a t value of 0.04 and a P-value of 0.971. See Figure 8 and Table 5.
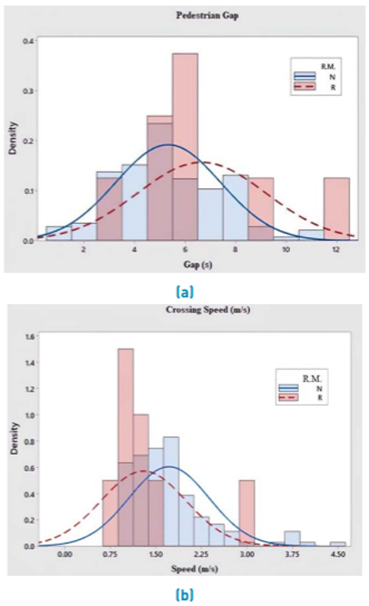
4.5 Comparison of pedestrians with reduced mobility
A hypothesis test was carried out that determined that the mean gaps are equal to 95% confidence, with a t value of -1.45 and a P-value of 0.19. The same result was obtained for the crossing speed with a t value of 1.66 and a P-value of 0.14. See Figure 9 and Table 6.
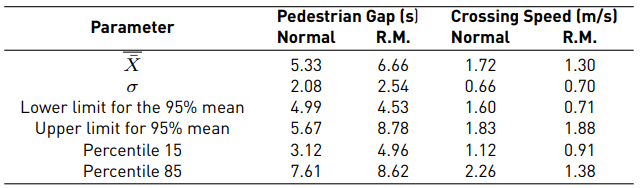
4.6 Comparison of pedestrians with children
A hypothesis test determined that the mean gaps are equal to 95% confidence, with a t value of 2.15 and a P-value of 0.051. The same result was obtained for the crossing speed with a t value of -2.05 and a P-value of 0.054. See Figure 10 and Table 7.
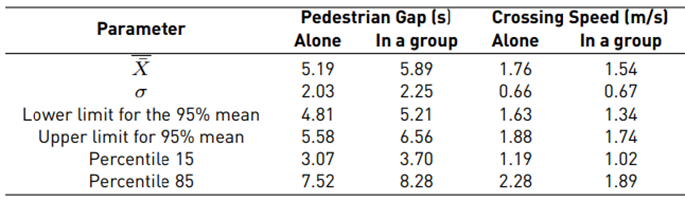
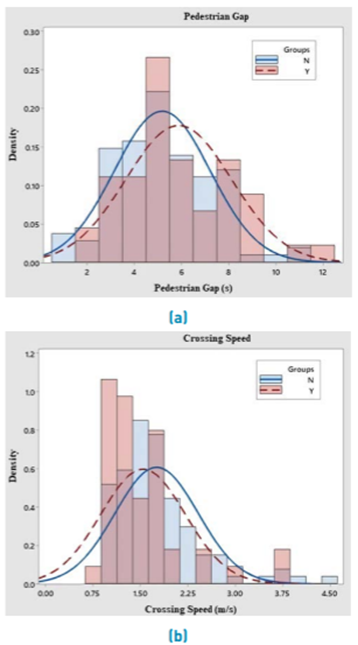
4.7 Comparison of pedestrians crossing in groups
A hypothesis test was performed indicating that the mean gaps are equal to 95% confidence, with a t value of 1.79 and a P-value of 0.077. The same result was obtained for the crossing speed with a t value of -1.82 and a P-value of 0.072. See Figure 11 and Table 8.
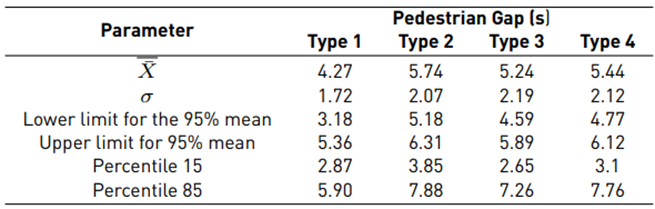
4.8 Comparison by gap type
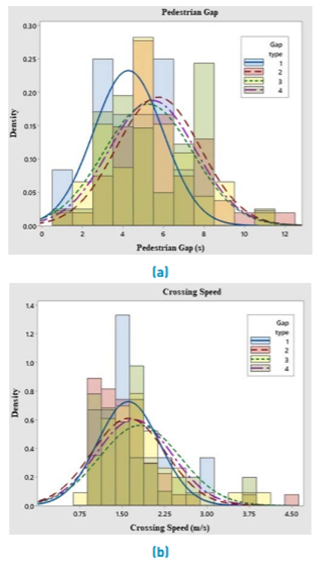
Using analysis of variance and confidence intervals, a significant difference was found between type 1 and type 2 gaps. See Figure 12 and Table 9. No significant difference was found between crossing speeds based on the type of gap, see Table 10.
4.9 Comparison by vehicle type
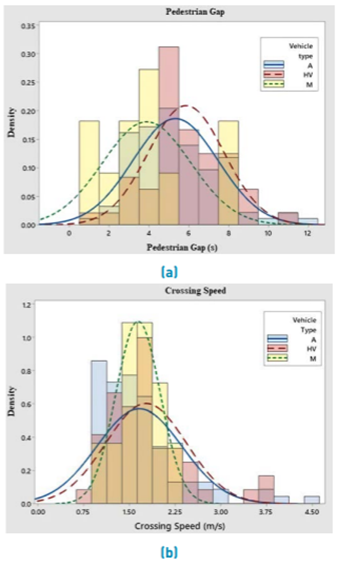
Using analysis of variance and confidence intervals, a significant difference was found between the gaps when pedestrians cross in front of motorcycles, compared to cars and heavy vehicles. No significant difference was found when pedestrians crossed in front of the latter two types of vehicles. See Figure 13 and Table 11.
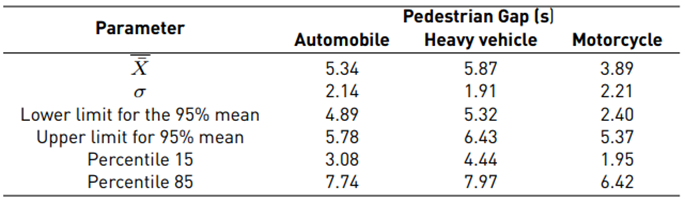
No significant difference was found between crossing speeds based on vehicle type. See Figure 13 and Table 11.
4.10 Explanatory model of the gap
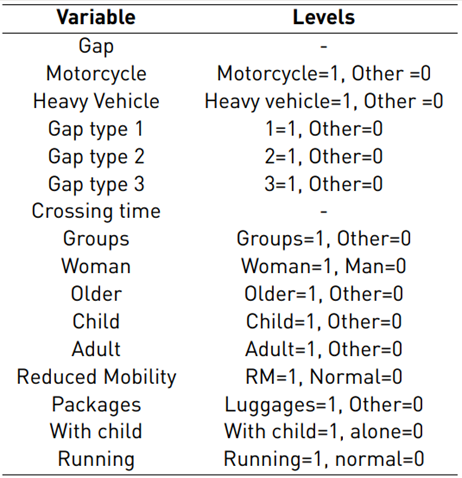
To find the relationship between the gaps accepted by pedestrians at the intersection and the variables observed in each case, a multiple regression model was calibrated. The variables considered, as well as the levels considered for the model, are shown in Table 13.
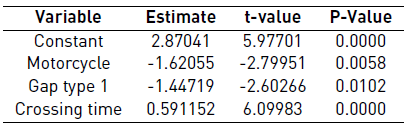
The calibrated regression model with a 95% confidence level is shown in Table 14. It contains only two of the twelve independent variables considered which include the type of vehicle and the type of gap which included the highest impact on the gap accepted by pedestrians. The adjusted R-squared value is 0.2406.
The calibrated model shows that the accepted gaps are smaller when the pedestrian sees an approaching motorcycle. A Type 1 gap shows a smaller crosswalk gap size because the pedestrian stops before the second lane, allowing them to make a two-stage crossing.
The accepted gap to cross a two-lane street takes between 3.3 and 6.4s, assuming an average walking speed of 1.2 m/s and lane width of 3.5m. Similar to other studies like that of Ferenchak [1], a directly proportional relationship was found between the time it took to cross the road and the chosen gap.
Other variables that could have a significant impact on the explanatory model included walking with a child hand in hand, crossing in front of a heavy vehicle, and carrying packages.
By taking into account the value of the pedestrian gap as well as the walking speed, it allows designers to adjust the design specifications of pedestrian crossings accordingly to the prevailing traffic conditions.
For urban planning purposes, the length of the accepted gaps and the walking speed have implications when selecting the type of control to be placed in a pedestrian crossing, and the solutions for managing the crossing in mid-block crossings. Thus, solutions such as narrowing the street facilitate the crossing because the accepted gap is reduced proportionally with the length of the crossing. This same type of solution can be implemented at intersections by reducing the turning radius and curbs extensions.
5. Conclusions
The gap accepted by a pedestrian is directly proportional to the crossing time. As a result, in the model it is equivalent to a value close to 50% of the time accepted to make the crossing.
The variables that were 95% significant in the size of the gaps accepted by pedestrians at the crossing are: the type of vehicle, the type of gap, and the walking time. If the reliability is reduced to 90%, the variable “with child” can be included.
The observed pedestrians accepted significantly smaller gaps when crossing in front of a motorcycle than with other types of vehicles. A tendency to accept larger gaps was correlated with larger-sized oncoming vehicles. The fact that the gaps chosen by pedestrians are sensitive to the type of vehicle has road safety implications that are especially important in areas with a high number of motorcycle traffic.
According to Elefteriadou [13], the critical gap is determined by the following Equation (2)
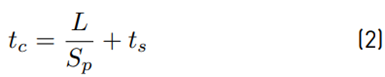
Where:t c = the critical gap for a single pedestrian (s), S p = the average pedestrian walking speed (m/s), L = the crosswalk length (m), and t s = pedestrian start-up time and end clearance time (s).
Assuming an average walking time of 4.5 seconds for an average speed of 1.6 meters per second, and a pedestrian start-up time of 3 seconds, there would be a critical gap of 7.5 seconds. It is observed that the calculated critical gap value exceeds the observed average gap value of 5.4s. The above suggests that the start-up time is less than what was observed (by about one second). The result found that the accepted gap is similar to the one estimated in the work of Zhao et al. [42] whose results were based on logistical regressions to obtain the accepted gap probability models. Yannis et al. [38] found similar results regarding the gaps accepted by pedestrians using a binary logistic regression model.
For future studies, we recommend using larger sample sizes and emphasizing pedestrians with disabilities as well as women with children and older adults.

