


 Inglês (pdf)
 Artigo em XML
 Referências do artigo
 Enviar este artigo por email
 Citado por SciELO
  Citado por Google
  Similares em
SciELO
Similares em
SciELO  Similares em Google
 Permalink
1. Introduction
Liquefaction is a well-known phenomenon in the geotechnical community. It is commonly associated with the loss of shear strength in saturated, sandy soil deposits subjected to dynamic loads such as those experienced during an earthquake. A description of available soil improvement methods to mitigate liquefaction is provided by Seed et al. [1]. In general, these ground improvement techniques are expensive and only applied to sensitive and large projects [2]. Therefore, there is a manifest necessity for developing inexpensive, cost-effective mitigation methods that can be easily implemented for new and existing structures [3]. The geotechnical community has discussed the possibility of soil desaturation as a technique to improve the soil’s cyclic shear resistance [4]. For this purpose, several techniques have been proposed and tested to introduce occluded gas bubbles into the saturated soil medium. When the soil is subjected to a cyclic load, the gas absorbs the induced pore pressure by reducing its volume and, as a consequence, decreases the soil’s susceptibility to liquefaction [5]. Among these techniques are a) air injection [4], b) water electrolysis [6], c) chemical reactions [7], d) microbiological processes [8] and e) drainage-recharge [6]. Bubble generation methods offer a less invasive alternative in comparison to other methods commonly used, cost-effective, and practical when soil improvement is considered difficult (i.e., it could affect the stability of existing structures) [9]. In this work, a mathematical formulation is presented to estimate changes in the degree of saturation of the soil, S(%), during air injection. Slight decreases in S(%) will substantially increase the soil’s cyclic shear resistance. A parametric analysis is performed to evaluate the effects of the soil-water characteristic curve, permeability functions, pressure injection, and injection time on R eff . In the numerical analysis, the standard mechanisms of a biphasic flow are included (i.e., incompressible and isothermal flow in an isotropic homogeneous porous media). In order to perform the simulations, the lite (free) version of the PDE Solutions Inc [10] software was used. This is a commercially available toolkit that provides state-of-the-art solution methods for numerically solving partial differential equations.
The desaturation process for liquefaction mitigation is still a relatively new approach, and it needs to be investigated for future applications. Several aspects such as (1) induced degree of saturation, (2) distribution and homogeneity of gas bubbles, (3) longevity of gas bubbles, and (4) desaturation plume extension need to be addressed in further detail. The present work is carried out with the objective of contributing to the state of the art on techniques dealing with liquefaction mitigation of coarse-grained, saturated, sandy soils by means of air injection. The results aim to shorten existing knowledge gaps regarding the mechanical processes controlling the extension of the desaturation plume and promote the development of design methodologies for air-injection desaturation techniques.
2. Analysis and simulation of gas injection into a saturated porous material
2.1 mathematical model
Air injection in a saturated porous media is treated as a biphasic flow problem. Herein, the mathematical formulae presented by Pinder and Gray [11], which are based on the work conducted by Darcy [12], are implemented in the proposed mathematical model. Considering a porous medium biphasic flow, the macro-scale balance equation for air (non-wetting phase, nw) and water (wetting phase, w) phases are as follows:
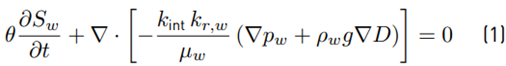
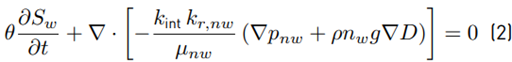
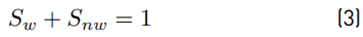
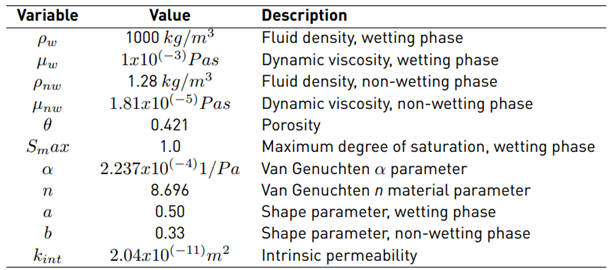
Where θ is the total porosity; S i is the degree of saturation; t is time; k int is the intrinsic permeability of the material (m 2 ); k r,i is the relative permeability associated to the fluid i; μ i is the fluid’s dynamic viscosity (Pa s); p i is the fluid pressure (Pa); ρ i is the fluid density (kg/m 3 ); g is the acceleration of gravity; and D is the coordinate of vertical elevation (m). In these definitions, subscript i= w for the wetting phase and i= nw for the non-wetting phase. The saturation of the phases can be expressed by the following constitutive expression:
This expression is an extension of Darcy’s law to a two-phase flow. The macro-scale capillary pressure (p c ) can be defined as:

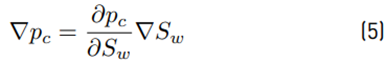
The above expressions simplify Equations (1) and (2) by eliminating two unknowns, and the conservation of mass equation of the pore fluid is then only dependent on p nw and S nw . Since capillary pressure is governed by S w , the capillary term, ∇p c , can be expressed as:
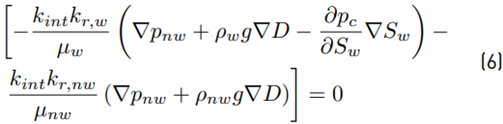
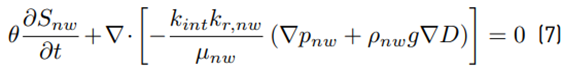
Substituting Equations (3), (4), and (5) into Equation (1) and adding Equation (2), the system of conservation of mass is written in a pressure-saturation form and expressed in Equations (6) and (7), respectively, as:
From the hydraulic properties of unsaturated soils, the effective degree of saturation of the w phase is given by Equation (8):
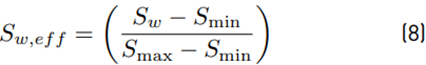
where S max and S min are the maximum and minimum limiting values of S w , respectively. The relative permeability of the water and air phases are given by Equations (9) and (10), respectively.
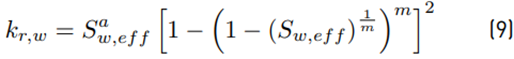
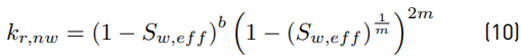
where a and b are the shape parameters and m a material parameter. Now, the van Genuchten [13] expression for the soil-water characteristic curve is given by Equation (11):
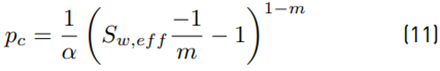
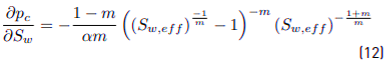
where m and n are material parameters and m = 1 - (1/n). Deriving Equation (11), the capillary term in Equation (6) is expressed as follows (equivalent to the work of Horgue et al. [14]):
2.2 Validation of the proposed model
Yasuhara et al. [15] carried out an experimental program to induce, by means of air injection, a partial degree of saturation in a fully saturated soil column. He also conducted a numerical analysis to validate the experimental results. Nominal flow rates and the induced partial degree of saturation were recorded. Figure 1 shows a sketch of the acrylic box and instrumentation set-up implemented to conduct the desaturation process. It consists of a transparent acrylic box 1.72 m long, 0.90 m high, and 0.60 m width containing a fully saturated homogeneous column test of Toyoura Sand with D r =60 % and e 0 =0.755. The test was developed under conditions that allowed a) flow of water and air at the top of the column, b) a hydrostatic pressure distribution for the initial wetting phase, and c) air injection into the saturated soil medium throughout an inlet port placed at the centre-bottom of the box.
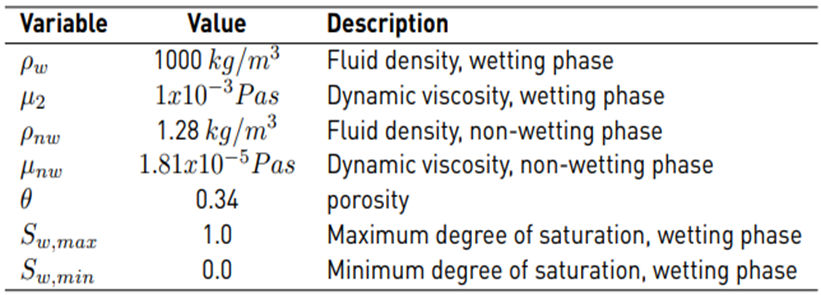
The experimental and numerical results reported by Yasuhara et al. [15] are used to validate the mathematical formulation and numerical analysis proposed in the present work. Similar soil parameters, injection pressures, and boundary conditions as those used by Yasuhara et al. [15] in their simulations are adopted for the numerical analysis. Figure 1 represents the rectangular area selected for the Finite Element analysis (half of the domain). Table 1 lists the material input parameters used for analysis.
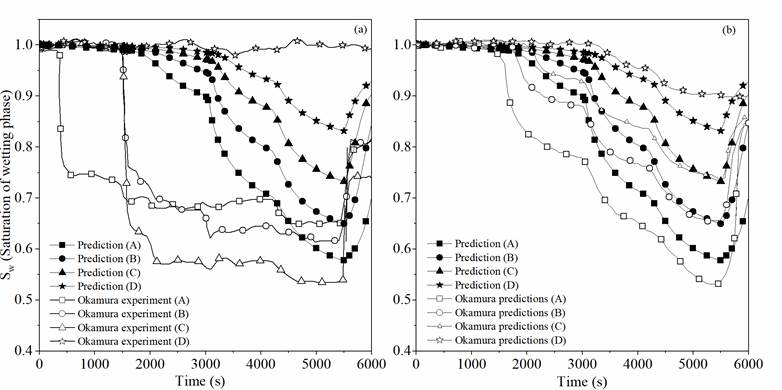
Figure 2 shows the comparison between the experimental and numerical results from Yasuhara et al. [15] with the proposed numerical analysis for changes in the degree of saturation of the wetting phases (S w ). Locations A, B, C, and D have coordinates (xandy) inside the domain equal to (0.86,0.32), (0.65,0.32), (0.545,0.32) and (0.44,0.32), respectively. A significant discrepancy between the experimental results and both numerical analyses (i.e., the proposed approach and Yasuhara’s numerical formulation) is observed. Yasuhara et al. [15] addressed these discrepancies and they were mainly attributed to differences between the real and measured soil physical properties (e.g., permeabilities and the soil-water characteristic curve) and the equations that represent the phenomena. On the other hand, and as presented in Figure 2b, the comparison between the numerical results shows a good agreement.
Figure 2b shows a time delay on S w at locations A, B, C, and D. This lag in advance of the non-wetting phase front can be primarily explained by the uncertainties associated with the methodologies concerning the numerical models and relative permeability functions. These parameters are directly related to the soil’s initial void ratio and experimental work, and they are part of the 3D model formulation solved with the integral finite difference method proposed by Yasuhara et al. [15].
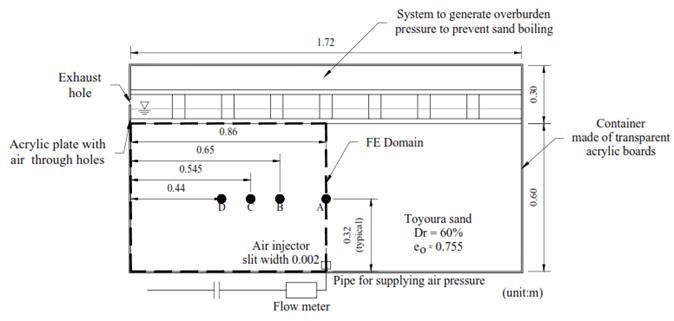
Figure 1 Sketch of the transparent acrylic box. Values of Sw were measured at locations A, B, C and D. Modified from Yasuhara et al. [15]
The following trends are observed when comparing both numerical simulations: (1) S w initially decreases near the injector and progressively around the soil column as air infiltrates due to buoyancy and the induced pressure gradients in the non-wetting phase, (2) S w starts to decrease at a later stage, but it shows a similar tendency on the desaturation process as well as a similar minimal value of S w at the end of the injection process (t=5,500 s), and (3) After t=5,500 s, S w begins to increase due to the shutdown of the air injector; nonetheless, a non-wetting phase still remains inside the domain resulting in S w values less than 0.9 at t=6,000 s. The reduction in S w after the shutdown may also be attributed to the escape of excess air bubbles from the void spaces due to buoyancy forces.
In the proposed analysis, the advance of the air front is controlled only by hydraulic factors, especially by the amount of pore fluid flow crossing the medium. This pore fluid flow is generated by the non-wetting phase pressure gradients associated with diffusion (conduction) and not by the transport of air dissolved by advection and dispersion. The proposed model does not consider the effects of the non-wetting phase compressibility, which can influence the hydraulic response of the soil due to the permeability and pressure dependency. Thus, from the simulations, it is observed that the biphasic flow implemented in the proposed FE model captures the general trends shown by Yasuhara et al. [15].
3. Results and discussion
3.1 Parametric analysis of air injection
In order to carry out decontamination processes of saturated soils, different studies related to air sparging have been conducted, in which the effect of soil parameters [16], the mechanisms of mass transfer [17], air migration [18], systems and implementation [19], predictive modelling [20] and the performance assessment [21] have been studied. However, the lack of studies focused on soil desaturation processes as a mechanism for liquefaction mitigation is apparent. Next, a parametric analysis is conducted to study the evolution of soil desaturation by air injection. Predictions of the desaturation radius and distributions in time and space of S w are evaluated via a multiphase flow simulation. Since the induce of partial saturation as a countermeasure technique for soil liquefaction is a relatively new approach, and there is not yet a well-established methodology, the results presented herein may be of great interest to engineers dealing with soil desaturation techniques.
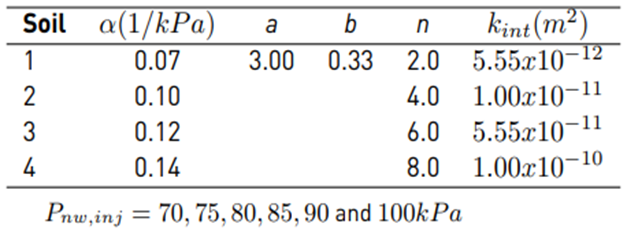
This parametric study is conducted to evaluate the influence of the hydraulic parameters (α, n, a, and b) and injection pressures on R eff . The hydraulic parameters were selected from Lu and Likos [22], and they are listed in Tables 2 and 3. These parameters are considered representative of sands and silty sand soils. In Table 2, underlined values are kept invariant while a group of predictions is generated. For instance, to study the influence of parameter n, the underlined values of α=0.10 1⁄kPa, s w,max =1.0, a=3.0, b=0.33, k int = 1.00x10 -11 m 2 , and P nw,inj =90 kPa are kept constant while varying n. The same approach is conducted to study the influence of the other parameters. A second group of simulations is conducted on four different soil types and analysed for air injection pressures varying from 70 to 100 kPa [Table 3]. Material parameters listed in Table 3 are representative of different silty sands (α = 0.07 1/kPa and n=2.0; 0.10 1/kPa and n =4.0) and sandy soils (α =0.12 1/kPa and n =6.0; 0.14 1/kPa and n =8.0). Each soil in Table 3 has an associated intrinsic permeability and hydraulic parameters that are dependent only on the pore size, pore geometry, and pore size distribution. Intrinsic permeability is identical for any soil regardless of the type of characteristics of the fluid being conducted on the assumption that the pore structure remains unaltered. Note that intrinsic permeability can fluctuate several orders of magnitude for the same nominal soil type; consequently, a range of intrinsic permeability values was selected to represent a variety of pervious and semi-pervious soils ranging from clean to very fine sands with high silt content.
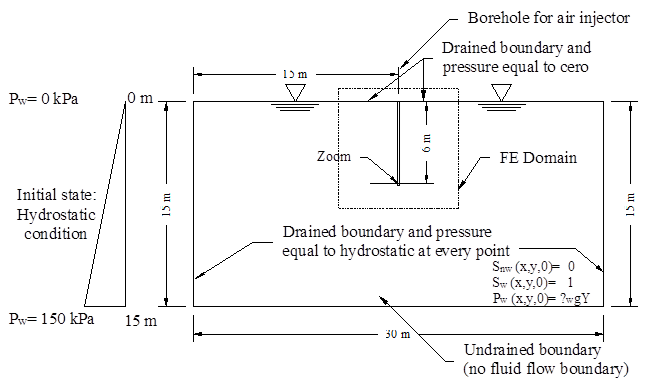
Table 4 shows the values used for the physical properties of both air and water. Data from Chen et al. [23]. Figure 3 depicts the FE model domain used for analysis. The model consists of a homogeneous soil with dimensions of 30m in width and 15m in depth. For the non-wetting phase, a no-flow boundary condition is assigned to the bottom of the model and to the borehole for air injection. A non-wetting flow is allowed to the rest of the boundaries as well as to the point where the injector is located (i.e., 6.0 m). The simulations began from a fully wetting phase condition (i.e., saturated condition), and the non-wetting phase began to flow as the pressure generated at the injector overcomes the hydrostatic pressure. The isocountors presented in all of the following figures correspond to de advance of the no wetting phase (Snw), and they are generated from a fixed zoom with an 8.8 m square shape. The left lower edge of the zoom is located at coordinates x= 10.6 m and y= 7.2 m. Figure 3 encloses, with dashed lines, the square area associated with the zoom.
Results and discussion of numerical simulations for the first parametric study
Effects of injection pressure
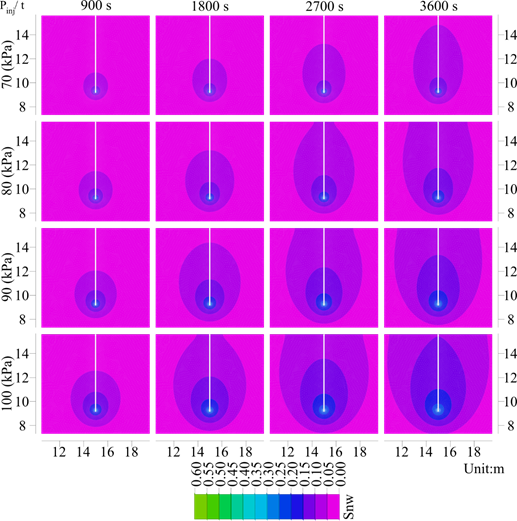
Figure 4 shows the time-space variation of S nw as a function of injection pressure and for injection times from 900 s to 3,600 s for the underlined values listed in Table 2. In total, six injection pressures were implemented for analysis, but only four are presented for the sake of simplicity.
The first four injection pressures (P nw,inj =70, 75, 80, and 85 kPa) are less than the maximum injection pressure suggested by Ogata and Okamura [24] for soil desaturation purposes. Ogata and Okamura [24] recommended σ inj,max =σ hyd +0.5σ´ v , so that the soil skeleton is not disturbed during air injection. In the present analysis, the maximum injection pressure is equivalent to 87 kPa (for an injector located at 6.0 m and a soil with γ=19.0 kN⁄m 3 ). The sixth injection pressure (P nw,inj =100 kPa) is higher than that recommended by Ogata and Okamura [24] and it could induce rearrangement of the internal structure of the soil to be improved [25]. However, this value of P nw,inj was analysed with the main objective of establishing whether the advance of the desaturation front has a response that is directly proportional to the increase in injection pressure or if it exhibits a different trend.
It is clearly observed in Figure 4 how, as injection pressure increases, the soil changes from an initially entire saturated condition to a partially saturated state. Because at t=3,600 s the non-wetting phase (air phase) has not yet reached the drained boundaries, the volumetric content of the displaced water phase (air phase) is the same as the volumetric content of injected non-wetting phase (since equations represent an incompressible flow). A non-wetting phase infiltrating into the saturated soil results in a decrease in S w . Furthermore, if the pressure at which the non-wetting phase is injected increases, there will be a more significant air front advance and a more predominant vertical advance of the non-wetting phase (i.e., due to gravitational forces).
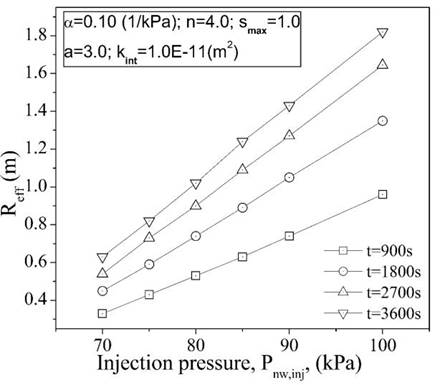
Figure 5 presents the R eff associated with the isocountors shown in Figure 4, corresponding to S nw =0.1 and P nw,inj ranging from 70 to 100 kPa. The value of S nw =0.1 was selected because, as shown by Chaney [26] and Yoshimi et al. [27], the liquefaction susceptibility of fully saturated sands decreases by half when the degree of saturation of the soil is reduced by 10 %. As expected, it is observed that the higher the injection pressure, the greater the effective radius of S nw . Okamura et al. [28] observed a similar trend in an in-situ monitoring desaturation program of a three-dimensional layered soil column. For a fixed time, it can be seen that R eff varies significantly with variations in P nw,inj . For the analysed case (silty sand), R eff increases by approximately 3 times when P nw,inj increases from 70 to 100 kPa. For a fixed injection pressure, the increase in R eff is more pronounced at the beginning of the desaturation process and it becomes less marked as time advances. As shown later, the soil reaches a maximum R eff for a given injection pressure.
Influence of parameters α, n, a, and b
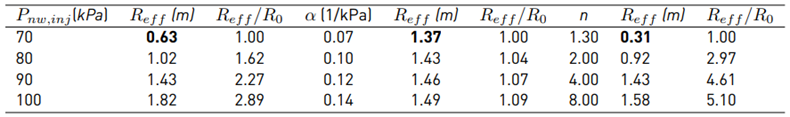
Figure 6 shows the influence of material parameters α, n, a, and b on the predicted R eff . For a constant permeability and injection pressure, material parameters α and n (van Genuchten parameters) have a more significant influence than parameters a and b (Shape parameters) on R eff . For the case of parameter α, R eff slightly increases as α increases. This response is anticipated since higher values of parameter α represent coarse-grained soils (sands). On the other hand, material parameter n has a more complex influence (nonlinear response) on the extent to which the material is partially desaturated. Initially, and for the same injection pressure and permeability, R eff remains almost constant with time when n=1.3 and it grows very rapidly when n increases from 1.3 to 2.0. For values of n between 2.0 and 4.0, R eff still increases but at a slightly slower rate. Similar behaviour is observed when n increases from 4.0 to 8.0 but with a tendency to become constant as n increases. Higher values of n (sands) represent a more rapid transition between saturated and unsaturated conditions. Material parameters a and b do not have a significant influence on the partial degree of saturation achieved during air injection. Table 5 summarizes the results of R eff for the first set of simulations. The values are taken at t=3,600 s. R eff /R 0 corresponds to the ratio between the calculated effective radius of the variable being considered and the effective radius of the first assumed value (underlined in Table 5]. The numerical results show some general trends in the value of R eff that could potentially be used to develop soil desaturation methodologies. For instance, and for practical purposes, higher values of R eff are reflected in greater separation between the injection wells during a soil desaturation process.
For a fixed intrinsic permeability, k int = 1.00x10 -11 m 2 , R eff increases by a factor of 2.89 when the injection pressure increases from 70 to 100 kPa, highlighting the importance of the magnitude of injection pressure on the extent of the desaturation zone.
Table 2 Hydraulic parameters, injection pressures, and permeability used for the first parametric study
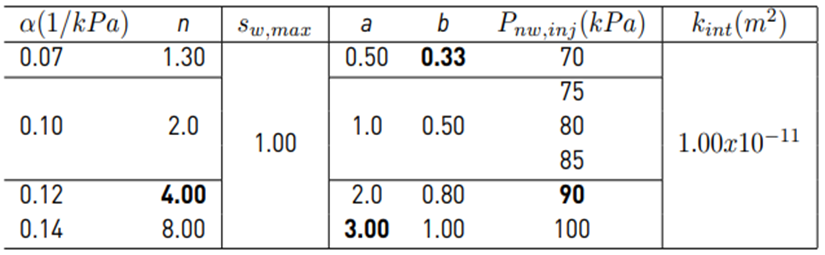
Table 3 Hydraulic parameters, injection pressures, and permeabilities used for the second group of simulations
With regards to the water retention characteristic curve parameters (α and n), it is observed that R eff increases only by 1.09 times when α increases from 0.07 to 0.14; meanwhile, if parameter n increases from 1.3 to 8.0, R eff increases by 5.10 times. This implies that the shape of the soil-water retention characteristic curve has a more significant influence on the advance of the desaturation front. Because α is related to the inverse of the soil air entry value, soils with lower air entry values (soils with larger particles and pore sizes) will allow a more rapid desaturation process since air enters the soil more freely.
On the other hand, a significant increase in R eff is observed when n becomes larger. Parameter n captures the pore size distribution within the soil, being higher for soils with bigger particles and pore sizes. This implies that the desaturation process will be more effective in soils with larger particles. Because the air injection process induces a partially saturated condition within the soil, knowledge of the water retention characteristic curve is fundamental for developing a design methodology and making the desaturation process more effective. In addition, slight variations in R eff are observed when the permeability function parameters are analysed (a and b parameters), suggesting that these parameters do not have a relevant influence on the desaturation process. This is probably because the desaturation levels achieved during air injection are low and the variation in permeability is minimal.
Results and discussion of numerical simulations for the second parametric study
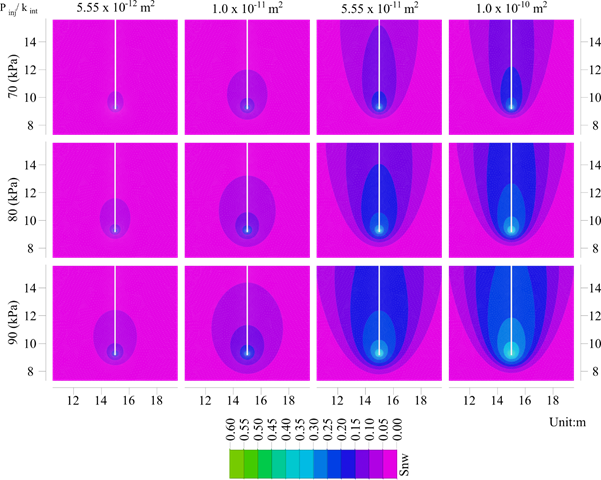
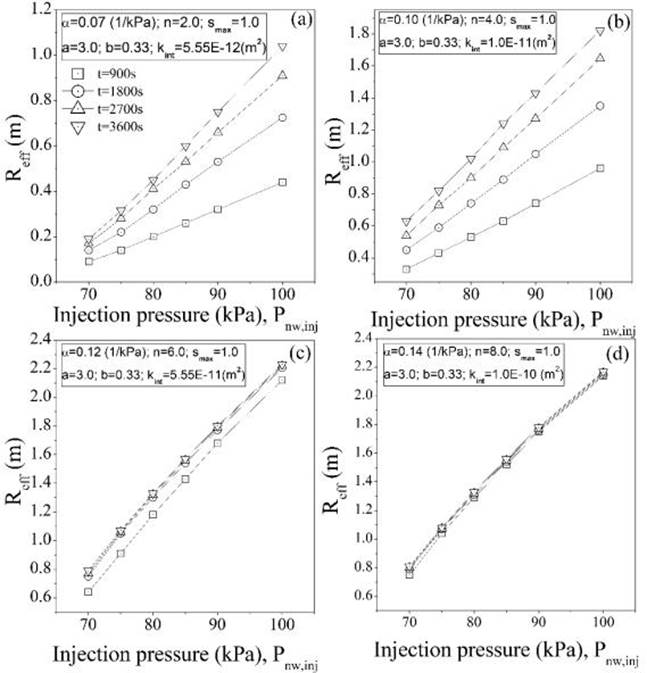
Table 3 presents the set of parameters studied to observe the effect of intrinsic permeability and injection pressures on the non-wetting phase flow and R eff . Figure 7 shows the isocountors of the predicted evolution of S nw as a function of the injection pressure and intrinsic permeability. For the sake of simplicity, only injection pressures of 70, 80 and 90 kPa at t=1,800 s are presented. It is observed that, for a particular injection pressure, the more permeable the soil, the greater the infiltration of the non-wetting phase front; in other words, the higher the advance of the desaturation plume within the saturated soil medium. Also, the higher the pressure at which the non-wetting phase is injected, the more pronounced the vertical advance of this phase. Typically, in the predictions, the desaturation plume has a cone or parabolic shape similar to that presented by Nyer and Suthersan [29] and Chen et al. [30], respectively. As observed in the results, and as stated by Reddy et al. [31], the dimensions of the desaturation plume are substantially dependent on the soil characteristics, injection pressures, and depth of the injector (hydrostatic pressure to overcome). Figure 8 shows the effective radius profiles associated with the hydraulic parameters, soil permeabilities, and pressure injections listed in Table 3. The readings were taken at times equal to 900 s, 1,800 s, 2,700 s, and 3,600 s. Figure 8a presents the values of R eff for the soil with k int = 5.55x10 - 12 m 2 . For all pressures, R eff gradually increases with time and the effect is more pronounced at higher injection pressures and at the early stages of the desaturation process. It is observed that regardless of the injection pressure, the rate of increase in R eff is less as injection time increases, suggesting that the soil is achieving a maximum R eff for the applied pressure. Figure 8b shows R eff for the soil with k int = 1.00x10 - 11 m 2 . This soil has an intrinsic permeability half order of magnitude higher than the soil in Figure 8a. A similar response is observed between these two soils. Figures 8c and 8d show R eff for two most permeable soils (k int = 5.55x10 - 11 m 2 and 1.00x10 - 10 m 2 ). Similar to the least permeable soils, R eff increases with time as the injection pressure increases, and for a given pressure, the soil reaches an apparent state of equilibrium.
Additionally, from Figures 8c and 8d, it is noticed that a maximum R eff is reached for all injection pressures at the early stages of the desaturation process (t=900 s and t=1,800 s, respectively). This trend suggests the existence of a maximum R eff for a given injection pressure level, which is reached more rapidly as the soil’s intrinsic permeability increases. This state of equilibrium in the degree of saturation of the non-wetting phase is primarily the result of a steady-state flow condition reached during the air injection process.
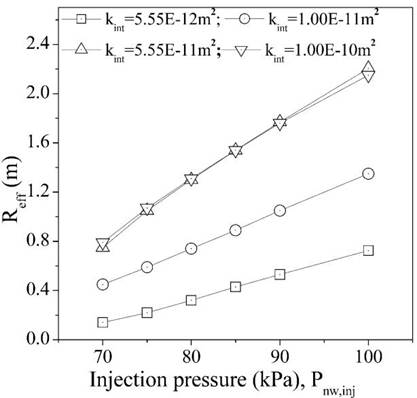
Figure 9 shows R eff as a function of permeability and injection pressure. It is observed that at lower values of intrinsic permeabilities, k int = 5.55x10 - 12 m 2 and 1.00x10 - 11 m 2 , R eff grows almost linearly with increments in injection pressure. For the most permeable soils, k int = 5.55x10 - 11 m 2 and 1.00x10 - 10 m 2 , the trend is similar, but the increase in R eff is more pronounced as pressure increases. Both permeable soils achieved a similar R eff regardless of injection pressure.
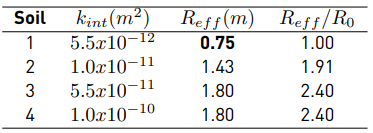
Table 6 summarizes the results of R eff obtained for the second group of simulations [Table 3]. It is noticed that R eff /R 0 becomes larger as the intrinsic permeability increases. For instance, R eff increases 2.40 times when k int increases one order of magnitude (from k int =5.5x10 -12 to k int =5.5x10 -11 ), implying that air injection processes are more effective and faster in soils with higher saturated intrinsic permeabilities. Soils 3 and 4 reached the same R eff , indicating that there is a threshold intrinsic permeability value where no major increases in R eff are obtained.
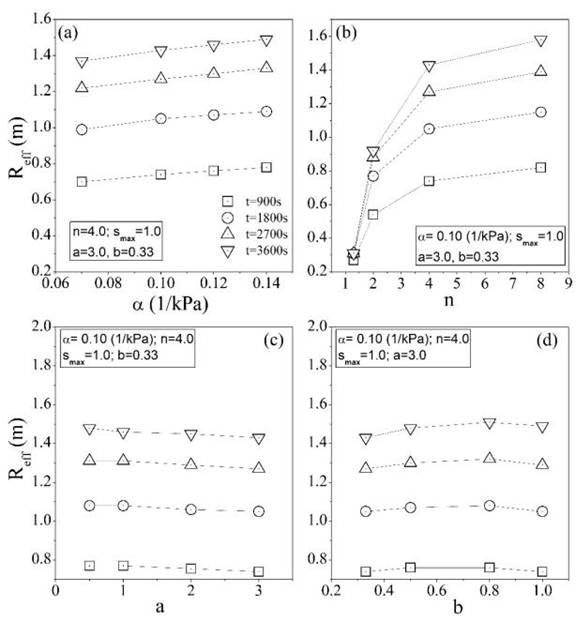
Figure 6 Predicted R eff as a function of α, n, a and b. S nw =0.1, P nw,inj =90 kPa, and k int =1.0E-11(m 2 )
Table 5 Summary of results obtained for R eff as a function of P nw,inj and α, n, a, and b parameters. k int =1.0E-11( m 2 )
These results highlight the importance of the intrinsic permeability on the extent of the desaturation zone. A similar behaviour is observed at all levels of injection pressures (70, 80, and 100 kPa), suggesting the existence of a maximum desaturation radius for a given injection pressure. The maximum value of R eff is reached more rapidly as the intrinsic permeability of the soil increases.
4. Conclusions
The following conclusions are drawn from the numerical simulations
Predictions are conducted to observe the suitability of the proposed model as a numerical tool that allows the in-situ desaturation front to be tracked. Consequently, it is shown that the numerical model presented in this work is appropriate to evaluate field desaturation processes when the material and hydraulic parameters of the soil are known.
The injection pressure and soil’s intrinsic permeability are the main factors affecting the effective radius of advance, R eff . For a fixed time, R eff varies significantly with variations of P nw,inj . For a fixed injection pressure, the increase in R eff is more pronounced at the beginning of the desaturation process and it becomes less marked as time advances. The threshold value is reached more rapidly when the intrinsic permeability increases. For all analysed cases, the soil trended to achieve a maximum R eff for a given pressure. For practical applications, and if a soil desaturation technique is intended, the value of R eff will serve to define the horizontal separation of injection wells and vertical separation of the injection points that have to be implemented for a particular project.
It is observed that for a particular injection pressure, the more permeable the soil, the greater the nw phase front infiltration; in other words, the greater the advance of the desaturation plume within the saturated soil medium. For the most permeable soils, k int = 5.55x10 - 11 m 2 and 1.00x10 - 10 m 2 , the increase in R eff is more pronounced as pressure increases. Both soils experience a similar effective radius regardless of the injection pressure, indicating that for a given pressure and as the soil’s intrinsic permeability increases, there exists a threshold value for R eff .
For a fixed soil’s intrinsic permeability and injection pressure, soil-water retention characteristic curve parameters (α and n) have a more significant influence on R eff than material parameters a and b (permeability functions). R eff substantially increases as n increases (nonlinear response), implying that the shape of the soil-water retention curve has a significant effect on the advance of the desaturation front. R eff grows very rapidly, rapid transition from a saturated state to an unsaturated state, as the soil becomes coarser. Material parameters a and b do not have a significant influence on R eff during air injection.
The limitations and practical use of the findings presented in this study are encompassed within the framework of the unsaturated soil mechanics. The temperature effect and compressibility of phases were not included. The effects of some features of the gas bubble (e.g., type, pressure, size), injector (e.g., diameter, spacing), and mode of air injection (e.g., continues or pulsed) are out of the scope of this work and will be the subject of a future study.
List of notations
R eff effective radius of air advance
θ total porosity
S i degree of saturation phase i
i Phase (w for the wetting phase and nw for the non-wetting phase)
t time
k int intrinsic permeability
k r,i relative permeability phase i
μ i fluid´s dynamic viscosity phase i
ρ i fluid density phase i
p c capillary pressure
S max maximum degree of saturation
S min minimum degree of saturation
a shape parameter
b shape parameter
n shape parameter
m shape parameter

