Inglês (pdf)
 Artigo em XML
 Referências do artigo
 Enviar este artigo por email
 Citado por SciELO
  Citado por Google
  Similares em
SciELO
Similares em
SciELO  Similares em Google
 Permalink
Introduction
The genetic improvement of sunflower yield and its quality mainly relies on considerable genetic variability in the population. Various breeding procedures such as North Carolina design III (NCD III) can be used for creating new genetic variability, which is obtained by selecting plants in the F2 generation with crossing to both inbred parents. NCD III also provides more information on the nature of gene action governing either additive or dominance inheritance of seed yield and its component traits in populations. However, it assumes the absence of epistasis as mentioned by Acquaah (2012). Hence, simple mating designs improve seed yield and its components.
The additive gene action was more important than the non-additive one in contributing to the variability of the head diameter (Gvozdenovic et al. 2005), 1000-seed weight and seed yield (Ortis et al. 2005), plant height, seed number/head, 1000-seed weight, and seed yield (Karasu et al., 2010). Abd EL-Satar (2017) and Abdelsatar et al. (2020) also confirmed a predominant role of the additive gene action in the control of the days to 50% flowering, days to physiological maturity, plant height, head diameter, number of green leaves/plant, and seed oil content. However, the seed weight/plant took an opposite trend. Thus, selection for improving these traits would be effective in early generations. Nevertheless, the importance and predominance of non-additive or dominance effects was detected for plant height (Gvozdenovic et al., 2005; Shankar et al., 2007), days to 50% flowering (Shankar et al., 2007), and seed yield (Parameshwarappa et al., 2008; Karasu et al., 2010; Chandra et al., 2011). Similarly, Azad et al. (2016) concluded the predominance of the non-additive gene action in inheritance of all the studied traits except for days to maturity. Additionally, many of the yield-attributing traits in sunflower are under the influence of non-additive gene action as reported by Shinde et al. (2016), Abd EL-Satar et al. (2017), Lakshman et al. (2019) and Ahmed et al. (2019). Consequently, according to the previous authors, the improvement of these traits can be performed by using hybrid varieties. Seed weight/plant is considered a complex trait; hence, attention must be paid to correlation and path analyses at both phenotypic and genotypic levels for improving seed weight/plant. Vidhyavathi et al. (2005) concluded that plant height and head diameter were considered the best selection criteria for improving seed weight/plant. Similarly, 100-seed weight and head diameter had the highest direct and indirect influence on seed weight/plant as Abd EL-Satar et al. (2017) mentioned.
Cluster analysis by D2 statistics is a powerful tool in measuring the divergence of tested genotypes on yield and its attributes. Thirumala et al. (2005) grouped 94 sunflower genotypes into 10 clusters based on D2 values. Moreover, Ram et al. (2018) classified the thirty-two genotypes of sunflower into six clusters using the Tocher method.
Given the previous points, this research aimed to estimate additive and dominance genetic variance, and heritability in broad and narrow senses for sunflower yield and its attributes. Additionally, the selection criteria for improving seed weight/plant were determined using correlation and path analyses at both phenotypic and genotypic levels, and the bi-parental crosses were classified using cluster analysis.
Materials and methods
Plant material
The F, cross (i.e., L350 x L355) was selected based on its yield performance in F[ evaluation, with the highest heterotic effects over mid- and better parents for further breeding (Abd EL-Satar et al., 2015); this population was used for generating bi-parental progenies.
F[ seeds of the tested cross (L350 x L355) were sown on March 5, 2018 at the Al-Arish agricultural research station of the Agricultural Research Center, in Egypt, and F[ plants were selfed at the flowering stage to produce the F2seed generation. F2 seeds were sown on June 5, 2018 along with their two parents at the Kafr-El-Hamam agricultural research station of the Agricultural Research Center, in Egypt. Sixteen plants were randomly selected from the F2 population and grouped in four sets. Each one of these plants was crossed as the male parent with each of the two parents as a female parent to produce 16 crosses of F2 x P[ and 16 of F2 x P2 as in the North Carolina Design III.
Field evaluation trials
The 32 bi-parental crosses, and the two parents, were hand-planted on adjacent plots without separators on June 5,2019 by using a randomized complete block design with three replicates in the four sets at the two locations of Kafr-El-Hamam and Al-Arish agricultural research stations of the Agricultural Research Center in Egypt.
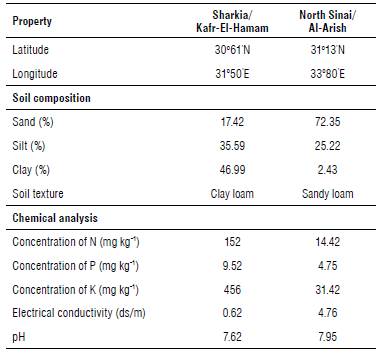
Soil samples of each location were analyzed to determine their compositions and chemical properties following Jackson (1973), as shown in Table 1. Wheat was planted before in the winter season of 2018/2019 in both locations.
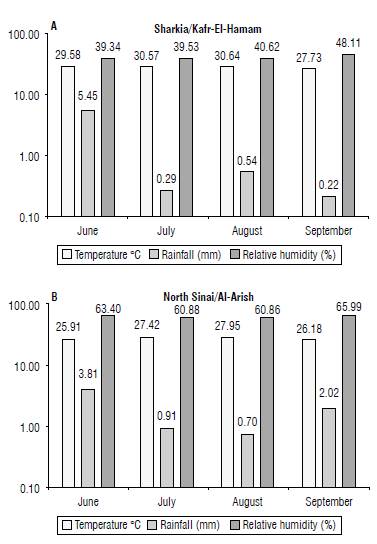
FIGURE 1 Monthly temperature, rainfall, and relative humidity during the period of sunflower growth In the 2019 season at both locations.
TABLE 1 Latitude and longitude of the two experimental field stations and soil composition and chemical properties of the upper 30 cm of the experimental soil.
Each replicate was grown in a plot consisting of 3 rows. Each row was 4 m long and 60 cm apart, with plants spaced at 30 cm within rows. The cultural practices were followed as recommended for sunflower production in the region.
Data collection
At harvest, ten competitive plants were randomly selected from the first and third rows in each plot to measure plant height (cm), head diameter (cm), 100-seed weight (g), and seed weight/plant (g). The seed weight/plant was adjusted to a 15.5% seed moisture, whereas the days to physiological maturity were determined on a plot basis. Seed yield/m2 was recorded from the plants located in the second row as the middle one, which was 4 m long for a total of 2.4 m2 in each experimental plot. These values were then converted to yield ha-1. Seed oil content was determined after drying seeds at 70°C for 48 h, by the Soxhlet extraction technique, using diethyl ether (AOAC, 1990). Gas-liquid chromatography (Aglent 6890 GC, USA) was used for the determination and identification of fatty acids methyl esters such as oleic acid and linoleic acid following Zygadlo et al. (1994) methodology in the Central Laboratory of the Food Technology Research Institute, ARC, Egypt.
Statistical analysis
The analysis of North Carolina design III was performed as outlined by Comstock and Robinson (1948) to estimate different genetic components. The phenotypic and genotypic correlation coefficient (Weber and Moorthy, 1952) and phenotypic and genotypic path analysis (Dewey and Lu, 1959) were determined. Additionally, the grouping and arrangement of genotypes by canonical analysis (Rao, 1952) based on D-square statistics (D2) developed by Mahalanobis (1936) were carried out.
Abdelsatar and Hassan: Gene action and heritability in bi-parental crosses of sunflower
Results and discussion
Analysis of variance (ANOVA)
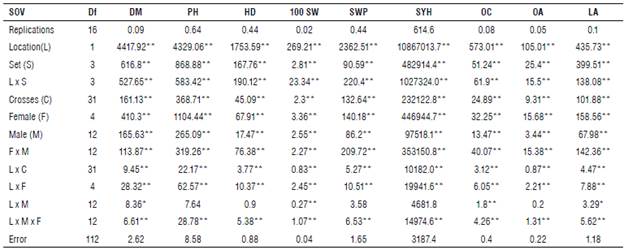
Mean squares of North Carolina design III due to females/ sets and males/set (Tabs. 2-3) were highly significant for all the studied traits at both locations and their combined analysis. These results indicate that there is great diversity among families, and hence, it would be effective for improving these traits. Females x males/sets interaction mean squares at both locations and their combined analysis were highly significant for all the studied traits as shown in Tables 2 and 3, suggesting that some divergent dominance could play a role across the specific crosses and across the sets. The presence of highly significant effects of the locations on all the studied traits (Tab. 3) showed that environmental factors influenced the phenotypic expression for all the studied traits. Table 3 shows that the mean squares due to the interaction between location and females, males, and females by males were highly significant for all the studied traits. However, the interaction between the location and males for plant height, head diameter, seed weight/plant, seed yield ha-1 and oleic acid did not reach a significant level. The significance of these traits due to the interaction the location with previous populations indicates that the location has sufficient environmental variability to lead to fluctuations in the ranking of these population components. Similar results were reported by Abd EL-Satar et al. (2015), Abd EL-Satar (2017) and Abdelsatar et al. (2020).
TABLE 2 Mean squares of North Carolina design III for all the studied traits in the bi-parental sunflower crosses at Kafr-El-Hamam (K) and Al-Arish (A) in the 2019 season.
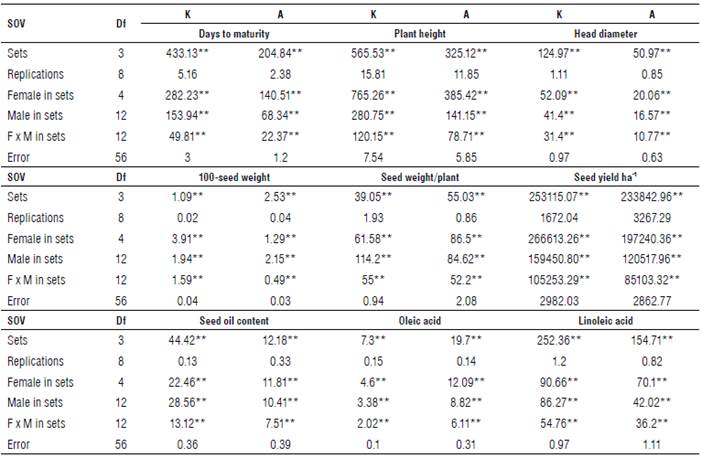
SOV: Source of variance; Df: Degree of freedom.
*, ** Significant at 0.05 and 0.01 probability level, respectively.
TABLE 3 Mean squares of North Carolina design III for all studied traits in the bi-parental sunflower crosses across two locations in the 2019 season.
SOV: Source of variance; Df: Degree of freedom
DM: Days to maturity, PH: Plant height, HD: Head diameter, 100 SW: 100-seed weight, SWP: Seed weight/plant, SYH: Seed yield ha-1, OC: Seed oil content, OA: Oleic acid and LA: Linoleic acid.
*, ** Significant at 0.05 and 0.01 probability level, respectively.
Furthermore, female variances (Tab. 2) contributed to the largest relative proportion of variances compared to males and female x male for all the studied traits at the two locations. These results indicate that these differences among females led to obtain great genetic diversity among their crosses with males, so they can be considered as desirable/ preferred in future sunflower breeding programs.
Mean performance
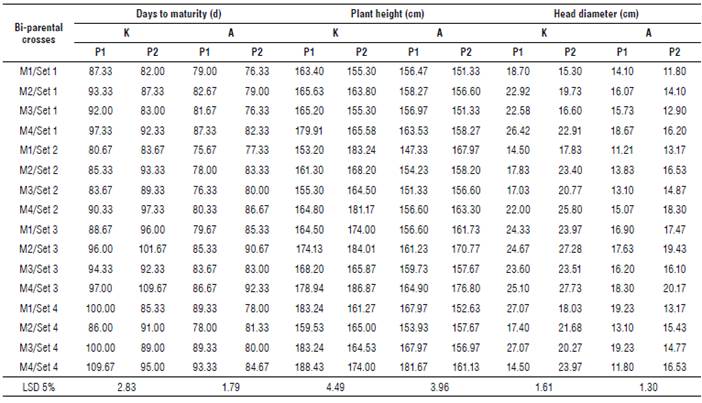
The mean performance of all the studied traits for the male x female interaction of backcrosses are shown in Supplementary material 1-3. The results revealed significant differences among the bi-parental crosses for all the studied traits at both locations.
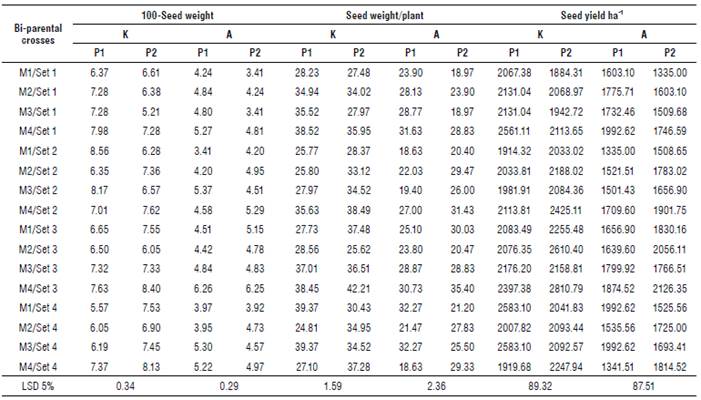
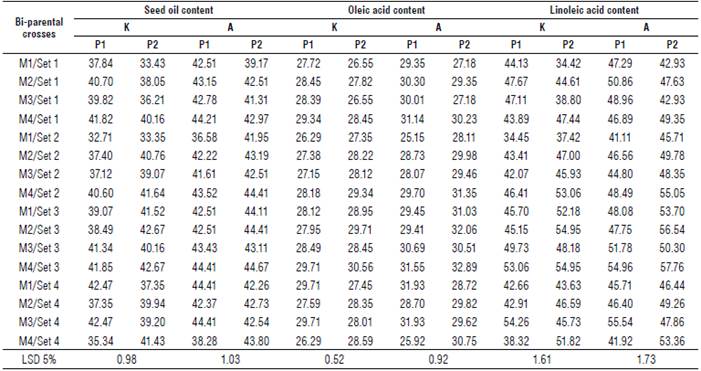
In general, set 2 of backcrosses with P1 obtained the shortest period to physiological maturity (85.00 d and 77.58 d), and the shortest (dwarf) parents (158.65 cm and 152.37 cm) at Kafr-El-Hamam and Al-Arish, respectively. However, the first order of sets was the Set 3 of backcrosses with P2 for head diameter (25.62 cm and 18.29 cm), seed weight/plant (35.46 g and 28.68 g), seed yield ha-1 (2458.88 kg ha-1and 1944.79 kg ha4), seed oil content (41.76% and 44.08%), oleic acid content (29.42% and 31.62%) and linoleic acid content (52.57% and 54.58%) at Kafr-El-Hamam and Al-Arish, respectively. Moreover, the heaviest weight of 100 seeds was detected in the Set 2 of backcrosses with P1 (7.52 g) at Kafr-El-Hamam and in the Set 3 of backcrosses with P2 (5.25 g) at Al-Arish.
Overall, backcrosses with the second parent were slightly inferior (desirable) for earliness in days to maturity (0.91% and 0.74%) than overall backcrosses with P1, which were slightly inferior (desirable) for plant height (0.14% and 0.01%) at Kafr-El-Hamam and Al-Arish, respectively. However, the overall backcrosses with the second parent were slightly superior (desirable) for head diameter (0.88% and 0.31°%), seed weight/plant (4.48% and 0.94%), seed yield ha-1 (0.83% and 2.09%), seed oil content (0.19% and 0.98%), oleic acid content (0.44% and 1.30%) and linoleic acid content (3.45% and 3.75%) than overall backcrosses with the first parent at Kafr-El-Hamam and Al-Arish, respectively.
Generally, the backcrosses had the highest mean values of all the studied traits at Kafr-El-Hamam, except for quality traits such as seed oil content and oleic and linoleic acids which exhibited the highest proportion at Al-Arish. Based on their mean performance, the backcrosses M4 x P2/Set 3 and M1 x P1/Set 4 performed well for most studied traits and consequently, seed weight/plant at both locations.
This is maybe due to the aggregation of favorable genes from different traits in these superior backcrosses. The genetic variability among bi-parental sunflower crosses is consistent with those reported by Shinde et al. (2016), Abd EL-Satar et al. (2017) and Lakshman et al. (2019).
Gene mode of action
The estimation of additive (σ 2A) and dominance variances (σ 2D) along with heritability (h2 NS) and average degree of dominance (ā) at both contrasting locations and the combined analysis are shown in Table 4. A significant variance of all the studied traits was a good indicator for computing both additive and dominance components. Hence, either hybridization breeding or selection in segregating generations is recommended for bi-parental crosses improvement. The magnitude of the additive variances for all the studied traits at both locations in proportion to the phenotypic variances was larger than dominant ones and the average degree of dominance was greater than the unit. Hence, the selection of these traits in early segregating generations to accumulate additive genes would be successful for producing superior inbred lines to be used in hybrid breeding programs (Tab. 4). Similar results were found by Karasu et al. (2010), Abd EL-Satar (2017) and Abdelsatar et al. (2020). The relative proportion variance of additive to phenotypic variance was larger than the dominance variance for days to maturity, plant height, and 100-seed weight as shown in the combined analysis (Tab. 5). On the other hand, the ratio of dominance to phenotypic variance was more significant than the additive variance, and the average degree of dominance was greater than the unit. These results were obtained for the head diameter, seed weight/plant, seed yield ha-1 and seed oil content as well as for oleic and linoleic acids as shown in the combined analysis (Tab. 5). This effect could be related to genetic interactions (Comstock and Robinson, 1948) and confirm the greatest role of dominance variance in the inheritance of these traits. However, selection in the later generations would be more effective than early selection for these traits. These findings were agreement with Lakshman et al. (2019) and Ahmed et al. (2019).
TABLE 4 Estimation of genetic parameters, additive and dominance variance, and degree of dominance in an F2 population of sunflower backcrosses at the contrasting locations of Kafr-El-Hamam (K) and Al-Arish (A) in the 2019 season.
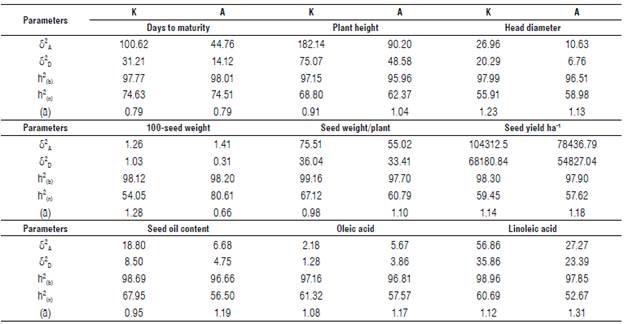
δ 2 A Additive variance; δ 2 D: Dominance variance; h2
|bl: Broad-sense heritability; h2 |nl: Narrow-sense heritability and (ā): Average degree of dominance.
TABLE 5 Estimation of genetic parameters, additive and dominance variance, and degree of dominance in an F2 population of sunflower backcrosses across the locations of Kafr-El-Hamam and Al-Arish in the 2019 season.
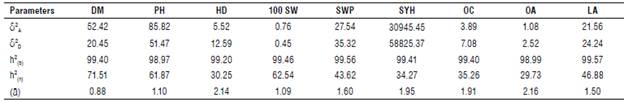
DM: Days to maturity, PH: Plant height, HD: Head diameter, 100 SW: 100-seed weight, SWP: Seed weight/plant1, SYH: Seed yield ha-1, OC: Seed oil content, OA: Oleic acid and LA: Linoleic acid.
δ2 A: Additive variance; δ2 D: Dominance variance; h2 (b): Broad-sense heritability; h2(n): Narrow-sense heritability and (ā): Average degree of dominance.
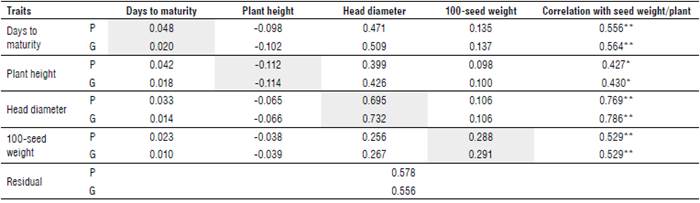
TABLE 6 Pooled phenotypic (above diagonal) and genotypic (below diagonal) correlations of 32 sunflower bi-parental crosses across two locations.
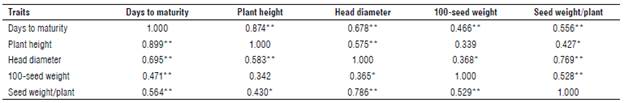
*, ** Significant at 0.05 and 0.01 probability level, respectively.
Estimates of broad sense heritability at both locations and their combined analysis were more than 95% for all the studied traits, indicating higher importance of the genetic effects of these traits. Moreover, moderate to high estimates of narrow-sense heritability were detected in all the studied traits at both locations, indicating that the effect of additive genetic variance was pronounced compared to dominance genetic variance (Tab. 4). These findings were agreement with Abd EL-Satar (2017) and Abdelsatar et al. (2020). Selection for all traits should be highly effective in this population. Regarding the combined analysis, days to maturity, plant height, and 100-seed weight are the highest heritable traits (Tab. 5). Therefore, selection for these traits should be highly effective in improving this population at early segregating generations. On the other hand, the estimates of narrow-sense heritability were low to moderate for head diameter, seed weight/plant, seed yield ha-1 and seed oil content as well as for oleic and linoleic acids. The selection of these traits in early segregating generations is not efficient but it would be effective in later generations. These findings were agreement with Abd EL-Satar (2017) and Abdelsatar et al. (2020) who reported a predominant role of additive gene action in the control of days to 50% flowering, days to physiological maturity, plant height, head diameter, number of green leaves/plant, and seed oil content. However, seed weight/plant showed an opposite trend.
Association of traits and path analysis as powerful selection criteria
Phenotypic and genotypic correlation
Phenotypic and genotypic correlations were estimated between seed weight/plant and its attributes for 32 sunflower genotypes based on the average of two locations (Tab. 6). Seed weight/plant was positively and significantly or highly significantly associated with days to maturity, plant height, head diameter, and 100-seed weight at phenotypic and genotypic levels. These results indicate that the largest diameter of head with moderate value of narrow-sense heritability and the heaviest weight of100-seed with a high value of narrow-sense heritability across locations can be considered of the main components to improve seed weight/plant; hence, selection will be more effective for these traits. The same results were obtained by Abd EL-Satar et al. (2017) who found that head diameter and 100-seed weight had the highest direct and indirect influence on seed weight/plant.
Phenotypic and genotypic path analysis
Path analysis is an important tool to partition the correlation coefficients into direct and indirect effects of attribute traits on seed weight/plant.
Genotypic correlations recorded higher values than phenotypic correlations regarding the direct and indirect effects of seed weight attributes on seed weight, suggesting the negligible role of the environment on the genotypic expression (Tab. 7 and Fig. 2). Maximum positive direct effects at both, phenotypic and genotypic levels, were observed for head diameter (P=0.695, G=0.732) with a moderate value of narrow-sense heritability, followed by 100-seed weight (P=0.288, G=0.291) with high value of narrow-sense heritability. Therefore, a preferred improvement maybe achieved by selecting genotypes with a larger head diameter and heavier seed weight. On the other hand, a negative direct effect on seed weight/plant at phenotypic and genotypic levels was exerted by plant height (P=-0.112, G= -0.114).
TABLE 7 Pooled phenotypic (P) and genotypic (G) path analysis of 32 sunflower backcrosses for seed weight/plant across two locations.
*, ** Significant at 0.05 and 0.01 probability level, respectively. Highlighted values indicate a direct effect and normal values indicate an indirect effect.
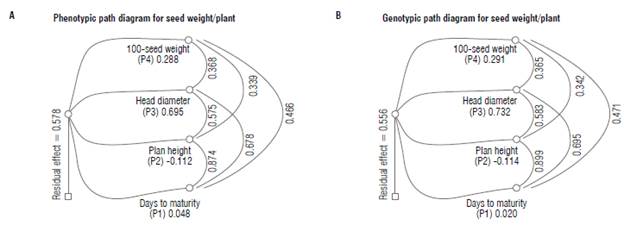
FIGURE 2 Pooled A) phenotypic and B) genotypic path diagram for seed weight/plant across the two locations.
Furthermore, the highest indirect effects at phenotypic and genotypic levels on seed weight/plant were detected in days to maturity (P=0.471, G=0.509) through head diameter followed by head diameter via plant height (P=0.400, G=0.426) and 100-seed weight (P=0.256, G=0.267). These results may be considered as identical to the previous results of correlation at both phenotypic and genotypic levels (Tab. 7 and Fig. 2). The above-mentioned results of direct and joint effects indicate that the direct selection of head diameter and 100-seed weight will be more effective in improving seed weight/plant. Days to maturity, head diameter, and 100-seed weight exhibited negative indirect effects at phenotypic and genotypic levels on seed weight/ plant through plant height. These results agreed with those of Abd EL-Satar et al. (2017). The residual effect was recorded with 0.579 and 0.556 at phenotypic and genotypic levels, respectively. These results indicate that the independent traits that are included at the phenotypic and genotypic path analysis explained 42.15% and 44.42% of the total variation, respectively, in seed weight/plant. The highest residual effects of phenotypic and genotypic path analyses indicate that the presence of other traits that are not included in the present study is associated with the highest effect on seed weight/plant.
Genetic divergence
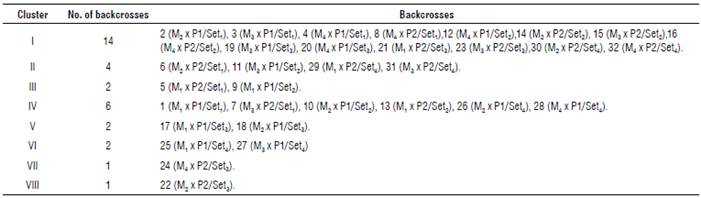
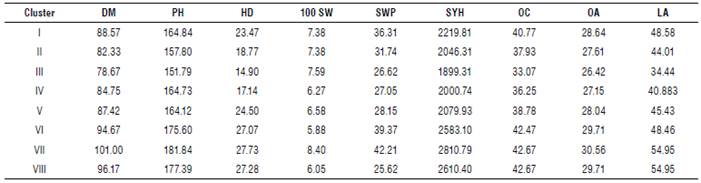
Thirty-two sunflower backcrosses were grouped into eight distinct clusters/groups by canonical analysis, as shown in Supplementary material 4 and Figure 3. Data indicated that the evaluated sunflower backcrosses were widely divergent, so they were scattered into eight clusters. The first cluster was the largest with 14 backcrosses, followed by the fourth cluster with six and the second with four backcrosses. The third and fifth clusters had two backcrosses and the seventh and eighth clusters had one backcross each.
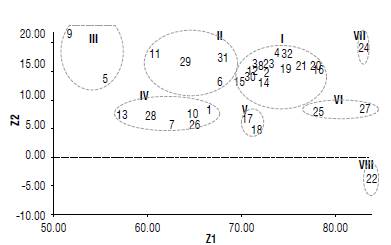
FIGURE 3 Scatter diagram of 32 sunflower backcrosses across two locations based on their canonical vectors superimposed with clustering. Code of figures as in Supplementary material 4.
Supplementary material 5 shows a comparison of cluster means on the average of both locations. The shortest period to physiological maturity (78.67 d) along with the lowest values of plant height (151.79 cm), head diameter (14.90 cm), seed yield ha-1 (1899.31 kg ha-1), seed oil content (33.07%), oleic acid (26.42%) and linoleic acid (34.44%) were spotted in the third cluster, whereas the longest period to physiological maturity (101.0 d) and the highest values of plant height (181.84 cm), head diameter (27.73 cm), 100-seed weight (8.40 g), seed weight/plant (42.21 g), seed yield ha-1 (2810.79 kgha-1), seed oil content (42.67%), oleic acid (30.56%) and linoleic acid (54.95%) were found in the seventh cluster.
Conclusion
Based on the results mentioned above, it can be concluded that selection of all the studied traits at both locations in early segregating generations to accumulate additive genes would produce superior inbred lines to be used in hybrid breeding programs. The genetic improvement may be achieved through the selection of genotypes with a larger head diameter and heavier seed weight. Moreover, the genetic variations were observed among backcrosses can be used in the future programs for sunflower improvement.