


 Inglês (pdf)
 Artigo em XML
 Referências do artigo
 Enviar este artigo por email
 Citado por SciELO
  Citado por Google
  Similares em
SciELO
Similares em
SciELO  Similares em Google
 Permalink
Introduction
Faba beans (Vicia faba L.; 2n=12) are one of the most common field pulses in Egypt (Bakry et al., 2011; Mohamed et al., 2012) and one of the oldest crops cultivated worldwide (Link et al., 1995; Zong et al., 2009). They belong to the Fabaceae family, the subfamily of Papilionoideae, and the tribe of Viceae (Duc, 1997). Faba beans are consumed for their green pods and dried seeds (Duc et al., 2010). They are considered a main source of cheap protein and energy in Africa and some parts of Asia and Latin America, where many people cannot afford a meat source of protein (Duc, 1997; Alghamdi, 2009).
A fungal disease called chocolate spot, caused mainly by Botrytis fabae (Sardina) and by B. cinerea (Pers.), is one of the most damaging diseases to this plant (Harrison, 1988; El-Komy et al., 2015; Haile et al., 2016; Aguilar-Luna et al., 2021). Symptoms oscillate from some spots on leaves to complete covering of the plant. Under severe conditions, the disease spreads from affected leaves into stems, flowers, and pods, causing damages (Bernier et al., 1993; Rahman et al., 2002; Villegas-Fernández et al., 2012; Haile et al., 2016). Various approaches are employed to control the disease, including genetic improvement (Wilson, 1937; Sahile et al., 2008; Abou-Zeid & Hassanein, 2000; Aguilar-Luna et al., 2021).
Quantitative trait loci (QTL) utilizes our knowledge of the effect of genetic control tools for selection in crop breeding programs. Various approaches are used for selecting promising traits, especially those for adapting to the local environment (Mahdy & El-Sharabasy, 2021). Phenotypic-revealed markers assess genetic diversity and performance of germplasm versus the attribute (Mahdy, 2012). These markers are based on visual observations (El-Sharabasy et al., 2021; Mahdy & El-Sharabasy, 2021) and screen the quantitative traits to increase field crop production.
PCR (polymerase chain reaction) - based markers are applied for genetic improvement and breeding, genetic diversity, and genetic relationships (Chen et al., 2008; Tomás et al., 2016). PCR is fast, reproducible, simple, and low-cost procedure. PCR-based markers are very practical in multi-disciplines, including genetic diversity and genetic improvement programs (González et al., 2005). Various PCR-based markers were applied on crops, i.e., Random Amplified Polymorphic DNA (RAPD) (Link et al, 1995), Inter-simple Sequence Repeats (ISSR) (Terzopoulos & Be-beli, 2008; Aguilera et al., 2011; Abdel-Razzak et al., 2012; Mahdy, 2012; Asfaw et al., 2018) on jew's mallow, Restriction Fragment Length Polymorphism (RFLP) (Torres et al., 1993), Start Codon Target (SCoT) (Mahdy et al, 2021) on cowpea, and Conserved DNA-Derived Polymorphism (CDDP) (Ghazzawy et al., 2021) on date palm.
We chose four faba bean parents for (1) improving genetic resistance against the chocolate spot, (2) determining the genetic variations, (3) evaluating the performance under the infection of chocolate spot, (4) measuring genetic distance, and (5) generating a molecular profile using agromorphological traits and RAPD markers.
Materials and methods
Faba bean materials, planting, and field experiment
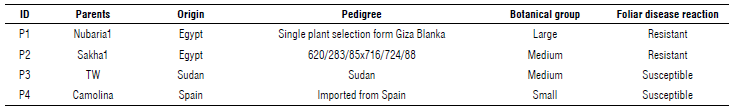
Four parents, as shown in Table 1, were sown on the experimental farm at the Nubaria Research Station, Agricultural Research Center (ARC), Egypt, during the seasons of 2016/2017, 2017/2018, 2018/2019, to evaluate their performance via the measurement of agromorphological traits. There is a high incidence of chocolate spot disease in Nubaria; moreover the disease is spread widely in the northern region of the Nile Delta of Egypt, with low temperatures and high relative humidity (Khalil et al., 1993). Four parents were hybridized in 2016/2017 to secure F1 hybrid seeds in the 2016/2017 season. In the 2017/2018 season, parents were re-hybridized; their F1 hybrids were grown in a randomized complete block design with three replicates under insect-free cages. In the 2018/2019 season, parents with F1 and F2 generations were artificially inoculated with Botrytis fabae fungus, under insect-free cages, then purified and identified according to Morgan (1971). Each plot comprised six rows 3 m long, with 0.60 m distance between rows, and 0.2 m between mounds with two seeds in each.
Measurement of agromorphological traits
Eight traits were measured: plant height (cm), number of branches/plant, days to flowering, seed number per plant, pod number per plant, seed yield per plant (g), 100-seed weight (g), and reaction to chocolate spot disease. An assessment scale of response to chocolate spot disease was estimated using a quantitative scale of 0-5, where 0 (very highly resistance) indicates no visible chocolate spot, 1 (high resistance) indicates a few chocolate spots, 2 (resistance) indicates increased and scattered spots, 3 (moderately resistance) indicates larger spots , 4 (susceptible) indicates necrotic spots reaching half of the leaf, 5 (highly susceptible) indicates majority of necrotic spots and leaf abscission (ICARDA, 2005). Homogeneity of the variance across environments was tested according to the Bartlett test (Steel & Torrie, 1980). Parents and their F1 and F2 hybrids were evaluated for the experiment traits and measurements without reciprocal.
PCR analysis
Six RAPD primers and five ISSR primers were used to detect the polymorphism among the twenty samples, which were synthesized by Metabion Corp., Germany (Tab. 2).
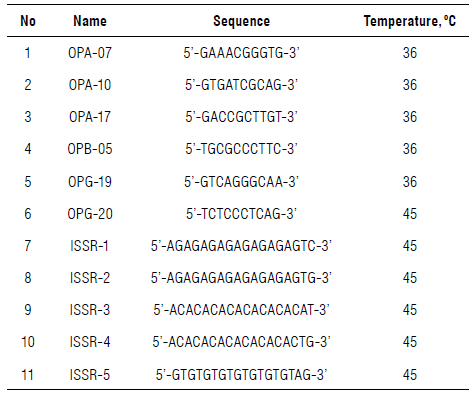
The amplification reaction was done in 25 μl reaction volume containing 12.5 μl Master Mix (sigma), 2.5 μl primer (10 pcmol), 3 μl template DNA (10 ng), and 7 μl dH2O, according to Ibrahim et al. (2019). The PCR was processed with a Perkin-Elmer/GeneAmp® PCR System 9700 (PE Applied Biosystems, USA) adjusted to fulfill 40 cycles. The initial denaturation cycle was for 5 min/94°C. Each was at 94°C in 45 s for the denaturation step and 72°C in 60 s for the elongation step. The annealing temperature was adjusted as in Table 2 for 50 s. The extension was adjusted at 72°C in 7 min in the final cycle. The amplified products were run in a 1.5% agarose gel containing ethidium bromide (0.5 μg ml-1) in 1X TBE buffer at 95 V. A 100 bp DNA ladder (Promega, USA) was standardized to determine the PCR product sizes. Gel images were visualized using a UV transilluminator and photographed using a Gel Documentation System (BIO-RAD 2000, USA). A binary matrix as present (1) or absent (0) was scored for the PCR products. The final data sets included both polymorphic and monomorphic bands.
Statistical analysis
A randomized complete block design (RCBD) with three replicates was used according to Gómez and Gómez (1984) and analyzed using MSTATC computer software. Average values and analysis of variance were conducted for all studied traits of 20 faba bean genotypes (four parents: (1) P1, (2) P2, (3) P3, (4) P4, six F1 generation: (5) P1xP2, (6) P1xP3, (7) P1xP4, (8) P2xP3, (9) P2xP4, (10) P3xP4, and ten F2 generation: (11) P1xP2, (12) P1xP3(R), (13) P1xP3(S) (14) P1xP4(R), (15) P1xP4(S) (16) P2xP3(R), (17) P2xP3(S), (18) P2xP4(R), (19) P2xP4(S) and (20) P3xP4 (SxS)) in each generation according to Steel et al. (1997). The least significance difference (LSD) test (P≤0.05) was calculated (Steel & Torrie, 1980).
We calculated the number of total bands, unique bands, polymorphic bands, and the percent of polymorphism. We also estimated some genetic parameters. Shannon information index was calculated {I = -1 x (p x Ln (p) + q x Ln(q))} according to Shannon (1948). The observed number of alleles (N
a
), effective number of alleles {N
e
= 1 / (p
2
+ q2)}, Nei genetic diversity {uh = 1 - Z (p
2
+ q2)}, and Unbiased Diversity {uh = (N / (N - 1)) x h)}; where p = band frequency and q = 1 - p estimated according to Hartl and Clark (1997) and Liu and Muse (2005). Nei's genetic identity and distance used Nei (1972) and Nei (1978). Nei's genetic identity was calculated with the following formula:
 , where Σ
i=1
k
PixPiy, Jx = Σ
i=1
k
Pix
2, Jy = Σ
i=1
k Piy
2. Nei genetic distance was estimated with the formula NeiD = -lnI, where I is the genetic identity. F-test was determined trait-marker associations. Power marker software V3.0 was fed. The association analysis selected markers with a high P-value (P>0.01).
, where Σ
i=1
k
PixPiy, Jx = Σ
i=1
k
Pix
2, Jy = Σ
i=1
k Piy
2. Nei genetic distance was estimated with the formula NeiD = -lnI, where I is the genetic identity. F-test was determined trait-marker associations. Power marker software V3.0 was fed. The association analysis selected markers with a high P-value (P>0.01).
Results and discussion
Phenotype-based traits
The average values of the agromorphological traits were calculated (Tab. 3). The results showed broad significance, as evidenced by the characteristic ranges for chocolate spot disease (1.30 to 5.63, resistant to susceptible, respectively), days to flowering (40.80 to 63.66), plant height (93.30 to 131.66 cm), number of branches per plant (3.10 to 10.80), number of pods per plant (25.46 to 111.36), number of seeds per plant (83.13 to 295.83), 100 seed weight (47.30 to 137.20 g), and seed yield per plant (56.37 to 199.96).
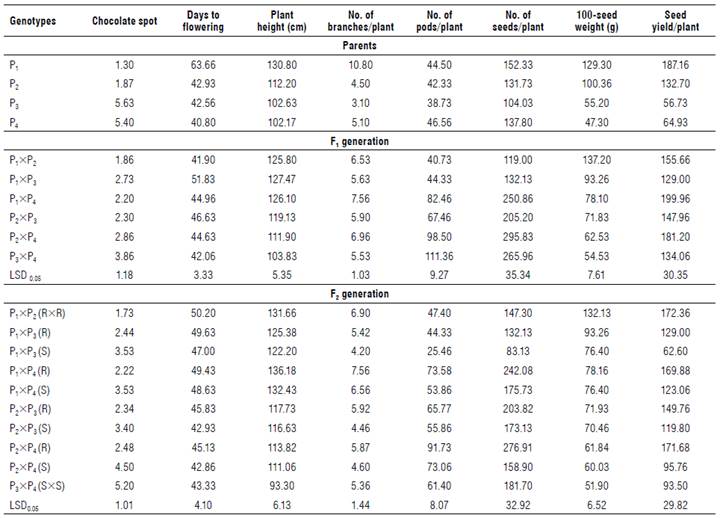
As shown in Table 3, Nubaria 1 recorded the highest mean values of 100-seed weight, seed yield/plant, and plant height (cm). Meanwhile, Camolina recorded a higher number of pods/plant, seed/plant, and branches/plant than the other parents. On the other hand, TW recorded the lowest mean values of the number of pods and seeds per plant. The two parents, Nubaria 1 and Sakha 1, gave the highest mean values of plant height. The parents, Nubaria 1 and Sakha 1, were considered highly resistant; their estimated mean values were (1.30 and 1.80) for chocolate spot infection. The parents TW and Camolina had the highest susceptible values (5.63 and 5.40) for the chocolate spot.
F1 generation
The mean values of the sex-tested hybrids were calculated (Tab. 3). Results indicated that the cross (P1xP2) had the highest mean value of 100-seed weight (137.20 g). The two crosses, P1xP3 and P1xP4, produced the last cross. For plant height, the crosses, P1xP3 and P2xP4, had the highest mean values (127.47 cm and 126.10 cm, respectively) of plant height and the lowest value (103.83 cm) obtained from the cross (P3xP4). The genotypes Camolina, Sakha1, and TW were the parents which flowered quickest. Also, cross P1xP2 (41.90 d) was the cross which flowered quickest, followed by the cross P3xP4 with a mean value of 42.06 d. Concerning the number of branches/plant, the results showed that three crosses (P1xP4), (P2xP4), and (P1xP2) had the highest values.
Concerning the number of pods per plant, the parental variety Camolina (P4) showed the highest mean value (46.56), whereas cross (P1xP2) gave the lowest number of pods/plant. For the number of seeds per plant, the cross P2xP4 gave the highest mean value (295.83), followed by the two crosses P3xP4 (265.96) and P1xP4 (250.86).
The two crosses (P1xP2) with 137.20 g and (P1xP3) with 93.26 g had the highest mean of 100-seed weight and highest seed yield per plant.
The highest seed yield per plant could be attributed to the high number of seeds and seed weight/plant. The two mentioned crosses were the most promising for yielding ability and tended to combine high seed yield and its components.
F2 generation
The cross (P1xP2) gave the highest mean values of the number of seeds per plant, seed yield per plant, and 100-seed weight and gave the lowest infection value for chocolate spot (1.73) (Tab. 3). The cross (P1xP3) had the lowest mean values for number of pods per plant and number of seeds per plant and the highest infection value of the cross P1xP2 (3.53). The cross (P3xP4) had a low mean value for 100-seed weight, and the reaction for chocolate spot gave the highest susceptible value (5.20).
Three crosses, P2xP3, P2xP4, and P3xP4, were the earliest crosses for the flowering date. The cross (P2xP4) gave the highest number of pods per plant, number of seeds per plant, and the highest susceptible value for reaction chocolate spot (4.50). The lowest values were scored by the two crosses, P1xP4 and P2xP3, which also gave the lowest value for chocolate spot infection (3.53 and 3.40, respectively). Those genotypes considered promising for chocolate spot resistance and the best performing F1 crosses had mean values slightly better than those of F2 crosses in most of the studied traits.
Significant differences among faba bean genotypes in all studied traits were considerable evidence for the existence of a suitable amount of genetic diversity valid for further assessments (Ahmed et al., 2016; Abdalla et al., 2017; Hamza & Khalifa, 2017; Abou-Zaid & El-Gendy, 2019; El-Abssi et al., 2019).
The results suggest that these genotypes carry genes for resistance to chocolate spot disease, coming from their parents according to their pedigree (Tab. 1). Similar results have been reported for faba bean yield traits and components, as well as for disease resistance traits (Abid et al., 2015; Zakaria et al., 2015; Beyene et al., 2016; Eldemery et al., 2016; Belal et al., 2018; El-Rodeny et al., 2020).
Polymorphism revealed via RAPD markers
Performance among twenty faba bean genotypes was analyzed by PCR-based markers, RAPD and ISSR (Figs. 1-2). Table 4 summarizes the data resulting from all analyzed loci that resulted from 148 amplified fragments ranging from 60 for ISSR and 88 for RAPD. The RAPD markers ranged from 130-2000 bp while the ISSR markers oscillated from 160-1500 bp. The polymorphism averaged a score of 74%, oscillating from 57% for ISSR to 74% for RAPD. RAPD markers revealed a high percentage of polymorphism compared with ISSR. The RAPD markers scored four positive unique bands by the primer OPA-07. Unique bands were at 1350 and 140 bp for P1xP2 (F1), 920 and 130 bp for P1xP4 S and P1xP3 S (F2), respectively. On the contrary, the ISSR revealed negative unique bands across the F2 generation. The primer ISSR-1 scored a negative unique band at a distance of 160 bp (P1xP4 R); ISSR-3 scored at 650 bp (P2xP4 R), 360 (P1xP3 S), and 250 bp (P2xP3 R); and ISSR-5 scored 529 bp (P2xP4 R).
TABLE 4 Polymorphism revealed by ISSR and RAPD markers.
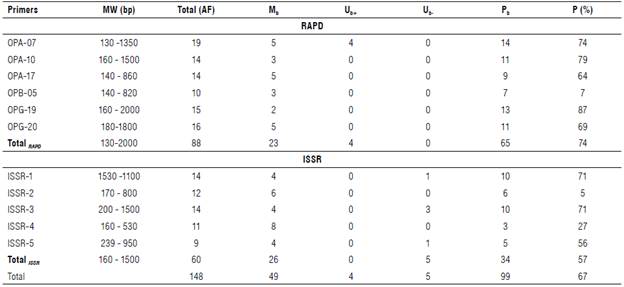
MW=molecular weight, AF=amplified fragment, Mb=monomorphic bands, Ub+=positive unique bands, Ub-=negative unique bands, Pb=polymorphic bands, P=polymorphism percentage.
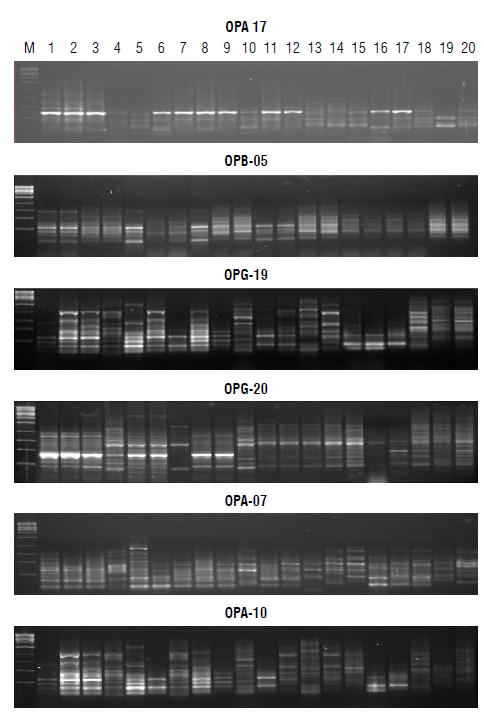
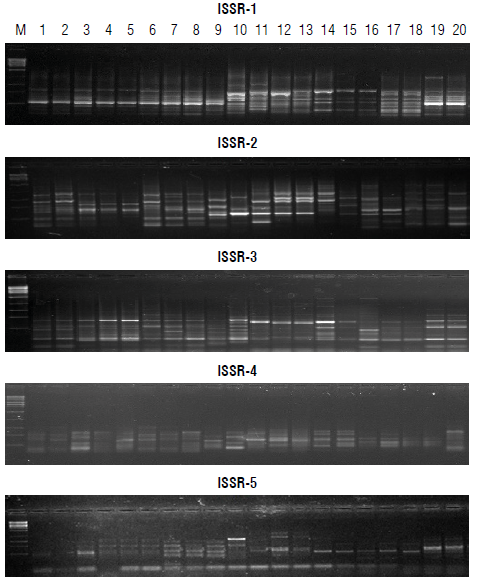
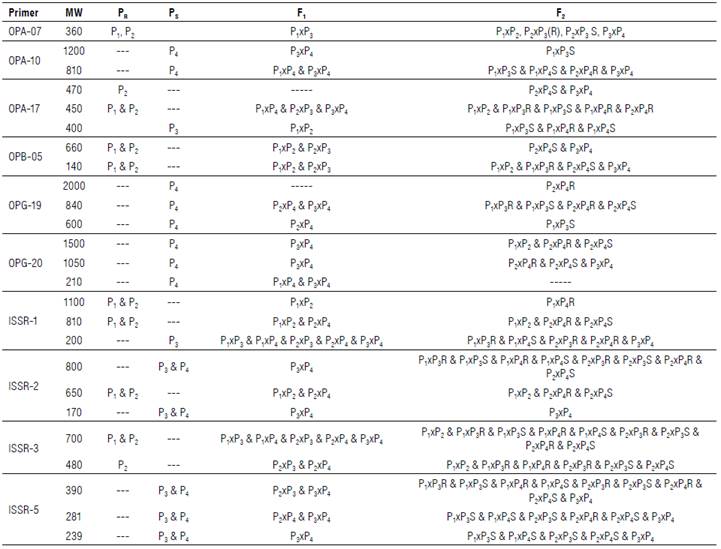
Table 5 summarizes specific loci in parents segregated during subsequent generations. These loci can be used directly for the breeding program for resistance to chocolate spot disease. RAPD markers patterned specific loci of resistant parents at a length of 360 bp for OPA-07, 470 bp (P2), and 450 bp (Pj and P2) for OPA-17, 660 and 140 bp (P 1 and P2) for OPB-05. Primers, OPA-10, OPG-19, and OPG-20, patterned specific loci of susceptible P4 except the primer OPA-17 owing to a specific locus for susceptible parent (P3) at a distance of 400 bp. ISSR patterned resistant specific loci at a length of 1100 & 810 bp by ISSR-1, 650 bp by ISSR-2, and 700 & 480 bp by ISSR-3 for parents 1 and 2. The primers ISSR-2 and ISSR-5 patterned susceptible specific loci at 800 & 170 bp for P3 and P4 and 390, 281 and 239 bp, respectively. The primer ISSR-1 characterized P3 only at a length of 200 bp.
We found the RAPD markers showed higher polymorphism than the ISSR, in contrast to other results detected in wheat (Nagaoka & Ogihara, 1997) and vigna beans (Ajibade et al, 2000). Terzopoulos and Bebeli (2008) found 68% polymorphism between the Greek faba bean populations using eleven ISSR primers. Khalaf et al. (2015) found 73% polymorphism between seven faba bean genotypes using fifteen ISSR primers.
Genetic parameters, identity, and distance
Genetic parameters are vital for the efficiency of a marker technique used in discriminatory objects based on polymorphism. The number of genetic parameters was estimated to evaluate the informative and discriminatory power during subsequent faba beans generation, as shown in Table 6. Heterozygosity (h) averaged 0.18, oscillating from 0.16 to 0.20 for RAPD, from 0.15 to 0.23 for ISSR, and from 0.16 to 0.21 for both markers, h reveals important polymorphism information content (PIC), with high informative marker value.
TABLE 6 Genetic parameters calculated among parents and their generations.
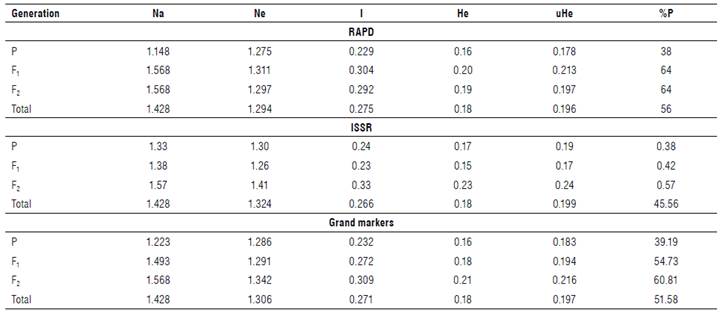
Na=number of alleles, Ne=effective number of alleles, I=Shannon index, He=expected heterozygosity, uHe=unbiased expected heterozygosity, and %P=percentage of polymorphism.
The Shannon index (I) revealed an average of 0.271 for both markers used. The RAPD markers ranged from 0.229 for Parents to 0.304 for Fl, with an average of 0.275. The ISSR markers oscillated from 0.23 (F1) to 0.33 (F2), with an average of 0.266. The effective number of alleles (N e ) of RAPD markers ranged from 1.275 (Parents) to 1.311 (F2), while ISSR revealed the range from 1.26 (F1) to 1.1 (F2), with a grand average of 1.306.
Duc et al. (2010) reported an enormous genetic variability for faba beans, useful for breeding purposes. The results of h agree with those of Suresh et al. (2013), who recorded PIC values of 0.45 in faba beans genotypes revealed by developing 55 novel polymorphic cDNA-SSR markers. Also, Oliveira et al. (2016) recorded PIC values from 0.07 to 0.66, with an average of 0.33. Hemeida (2008) used PIC to evaluate the primer efficiency of ISSR and established the relationships, and successfully discriminated among the genotypes tested.
The difference between the mean diversity (h) of both markers and between markers was undoubtedly due to mirror inbreeding or selection method against heterozygotes. The nature of used markers might be due to the level of observed heterozygosity resulting in the non-detection of homozygotes from heterozygotes because of the presence of null alleles. The heterozygosity represents the direct count of heterozygosity in the population and is estimated based on the allele frequency of individuals in that population according to the Hardy-Weinberg equilibrium. The PIC evaluates the informative potential of markers in different germplasm (Grativol et al., 2011; Mahdy, 2018). The h value of a marker with many amplicons desirable for variation splits into three main classes based on Botstein et al. (1980). The PIC values are more than 0.5 for highly informative markers, between 0.25-0.5 for reasonably informative markers, and less than 0.25 for slightly informative markers. The Shannon information index (I) is one of the most important genetic diversity measurements (Sherwin et al., 2006). The effective number of alleles (N e ) is a reciprocal of gene homozygosity (Hartl & Clark, 1997). The N e is used as a corollary to h; when h is high, N e will be the high.
Table 7 summarizes the estimates of genetic distance and genetic identity between generations and their parents according to the Nei coefficient (Nei, 1972; Nei, 1978). It reflects the genetic relationships and the direction of the genetic improvement process. Results show that the RAPD markers revealed high genetic identity and distance values. The highest genetic distance value scored by RAPD was 0.089 on parents versus F1, and the lowest value scored 0.028 on F1 versus F2. Genetic identity oscillated from 0.914 (parent versus F1) to 0.972 (F1 versus F2), as revealed by RAPD.
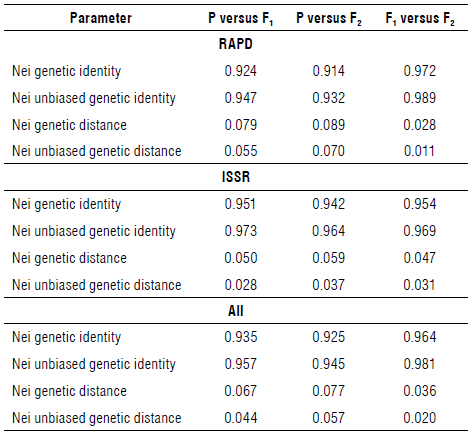
Nei genetic identity ranges from 0 to 1. Consequently, Nei genetic distance ranges from 0 to infinity (Nei 1972; Nei, 1978). ISSRs are more efficient markers for polymorphism and potent for intra- and inter-genomic diversity than other arbitrary markers like RAPDs (Zietkiewicz et al., 1994). Both markers target different portions of the genome.
Genetic variations in genotypes of interest may be more directly due to polymorphism detected by technique rather than which techniques are employed.
Cluster analysis and similarity between twenty genotypes
Cluster analysis derived from both markers based on UPG-MA in accordance with Jaccard (1908; Fig. 3). The twenty genotypes divided into two main groups at a distance of 0.65. Cluster I (right cluster) divided into two subgroups at a distance of 0.668. The first subgroup (left subgroup) consists of P1 and P2 in the sub-sub group and P1xP2 (F1) only in a sub-sub group. The second subgroup (right subgroup) split further into sub-sub groups, which include the genotypes of P1xP2(F2) and P2xP4(F1) grouped in a cluster, P1xP3(F1) only in a group, P2xP3(F1) only in a group, and P2xP3 S(F2) and P2xP3R(F2) together in a group.
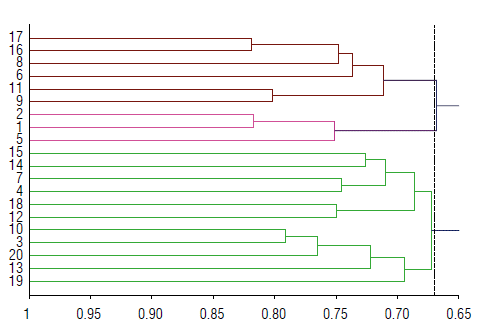
FIGURE 3 Dendrogram tree constructed using UPGMA according to Jaccard similarity. Cluster analysis based on RAPD and ISSR markers; (1)-P1,(2)-P2, (3)-P1 (4)-P4, "six F1" (5)-P1,xP2, (6)-P1,xP3, (7)-P1,xP4, (8)-P2xP3, (9)-P2xP4, (10)-P3xP4, "ten F2" (11)- P1, (12)-P1xP3 (R), (13)-P1,xP, (S) (14)-P1,xP4(R), (15)-P1,xP4(S) (16)-P2xP3(R), (17)-P2xP3 (S), (18)-P2xP4 (R), (19)-P2xP4 (S) and (20)-P3xP4 (SxS)".
Cluster II (left cluster) separated into two subgroups at a distance of 0.672. Each split further into sub-sub groups. The first sub-sub group (right one) includes P1xP2R(F2) and P2xP4 R(F2) together, P4 and PxP4(F1) in a cluster, and P1xP4 R(F2) and P1xP4 S(F2) in a group. The second one consists of P2xP4 S(F2), P1xP3 S(F2), and P3xP4(F2) in a separated cluster for each and P3 and P3xP4(F1) in a cluster.
El-Ghadban et al. (2017) and Mahdy et al. (2021) reported similar results. The differences in the clustering pattern of genotypes may be due to marker sampling error, the level of polymorphism, or the number of loci and their coverage across the genome (Loarce et al, 1996).
Association analysis
Trait-marker association was analyzed using a single locus F-test module in Power maker software (Fig. 4). The results show the property of one trait for one locus characterized. The characterized locus generated by OPG-20 was associated uniquely with seed yield per plant. Moreover, several traits were associated with one or more than one locus. Amplified loci of OPA-07 were associated with the different characterized chocolate spots, days to flowering, the number of branches per plant, and seed yield per plant.
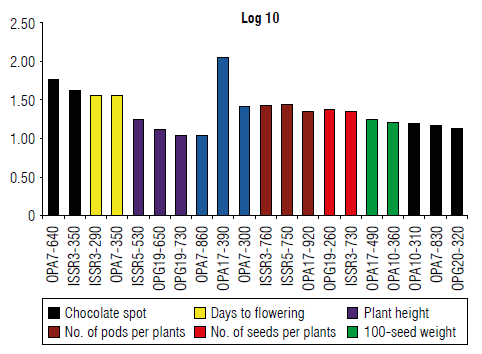
FIGURE 4 Association analysis. Trait-marker association was achieved through F-test analysis. Power marker software V3.0 was used and markers with high P-value (P>0.01) were selected in the association analysis. X and Y axes refer to -Log P values and the name of primers associated with certain traits.
Previous results have suggested the high potential use of molecular markers in search for genes affecting crop productivity and resistance to chocolate spots. Also, defense mechanisms against biotic and abiotic stress factors identified statistical associations between the genetic markers and the traits of interest.
Marker-trait associations were generally diverse in the amount of genetic variation valid for assessment. The results exhibited that a greater number of primers was possibly involved in controlling traits at resistance to chocolate spot disease. This variation described by identified associations for each trait may be attributed to the role of many minor genes controlling the trait, performance, and reaction of faba bean genotypes to chocolate spot disease, markers exhibiting minor quantitative effect, rare alleles, and complex allelic interactions (Yang et al, 2010; Debibakas et al, 2014). These results correspond with the findings of Lou etal. (2015) and Sunef al. (2015). Association data can be used for faba beans breeding, especially in terms of its resistance to biotic and abiotic stresses.
Conclusion
The parents Nubarial, Sakhal, TW, and Camolina could be considered good for crossing for resistance to foliar chocolate spot disease. Crosses 1,2, and 3 (P1xP2 Nubaria-1 x Sakha-1, P1xP3, Nubaria-1 x TW, P1xP4 Nubaria-1 x Camolina, respectively) showed resistance to disease during both generations, F1 and F2 with high values for yield and its components, especially date of flowering and 100-seed weight per plant. Both markers exhibited interest specific loci relating to performance of chocolate spot that are 360 bp (OPA-07), 450 and 470 bp (OPA-17), 140 and 660 bp (OPB-05), 810 and 1100 bp (ISSR-1), 650 bp (ISSR-2), and 480 and 700 bp (ISSR-3). The genetic distance valued by RAPD was 0.089 on parents versus F1; and the lowest value scored 0.028 on F[ versus F2. Genetic identity oscillated from 0.914 (parent versus FJ to 0.972 (F1 versus F2), as revealed by RAPD. Estimating genetic relationships and differences generated by both markers could be moderately clarified by the product number of PCR, the number of bands, and coverage along the genome with the association of agromorphological traits. The current research could provide information on the morphological and molecular characteristics of faba beans chocolate spot disease. Inter-varietal hybridization (resistant and susceptible) is still considered one of the most promising methods for obtaining germplasm with resistance and high yield.

