


 Inglês (pdf)
 Artigo em XML
 Referências do artigo
 Enviar este artigo por email
 Citado por SciELO
  Citado por Google
  Similares em
SciELO
Similares em
SciELO  Similares em Google
 Permalink
INTRODUCTION
The Convention on the Rights of Persons with Disabilities states that people with disabilities “include those who have long-term physical, mental, intellectual or sensory impairments which in interaction with various barriers may hinder their full and effective participation in society on an equal basis with others”,1 and the World Health Organization (WHO), through the International Classification of Functioning, Disability and Health (ICF), links disability to limitations for activity and restrictions on participation. Disabilities are problems that affect body structure or function; activity limitations are difficulties in performing actions or tasks, and participation restrictions refer to problems to participate in vital situations.2
It has been estimated that about 12% of the Latin American and Caribbean population live with at least one disability.3 In Colombia, the estimates of disabilities prevalence according to the 2005 national census was 6.3%, being higher in men (with 6.6%) than women (with 6.2%), with the Department of Cauca presenting higher percentages compared to national levels, ranging from 7.8 to 9.5%.4
Colombia is home to about 87 indigenous peoples; this includes the Misak people, which represents 1.5% of the country’s total indigenous population.5 This community consists of 4,582 families and 22,987 individuals, including 25 Nasa families with 273 residents. Located in the Guambia reserve in Silvia, Cauca, its internal organization is known for maintaining ancestral cultural patterns, like traditional medicine.6-8
The Economic Commission for Latin America and the Caribbean (ECLAC) reports a disability proportion of about 17.1% in the indigenous population in Brazil. The report does not include data on Colombia.9 The combination of the indigenous population social conditions plus disabilities leads to an increase in exclusion, marginalization and vulnerabilities of this population,10 as well as deterioration of health in general and oral health in particular.11 Some authors12-15 state that the scientific literature exploring race/ ethnicity, disability and health is very limited, and therefore the relationship among these variables and its extent is still unknown for the most part. The studies have generally shown unconnected data concerning inequalities per disability type16 or race/ ethnicity,17-19 showing poor levels of oral health (cavities/bacterial plaque) among the disabled persons and the indigenous population.20,21
The few studies that do connect race/ethnicity, disability and oral health have been conducted in North America and in adult population,14 showing the existence of poor or deficient dental conditions as a result of multiple social, economic, and physical factors.22,23
The United Nations Children’s Fund (UNICEF) explains that “children with disabilities who live in rural and indigenous communities contend with multiple disadvantages: They have disabilities, they belong to a marginalized group and they live in remote locations. They have little or no access to services that could ensure their development, protection and participation in community life.”24
Obtaining basic information on the oral health status of the Misak (Guambiano) indigenous community with disabilities by means of the Community Plaque Index25 helps understand this problem and seek mechanisms to improve the promotion, prevention, and quality of life in oral health, as well as their access to health services, while respecting their cultural independence. Therefore, the aim of this study is to describe the oral hygiene status and the habits of people with disabilities living in the indigenous reserve Misak (Guambiano) in Silvia, Cauca (Colombia).
METHODS
A descriptive, observational, cross-sectional study was conducted in persons with disabilities from the Misak (Guambiano) indigenous reserve in Guambia, Silvia, Department of Cauca (Colombia). The study included all the indigenous persons with disabilities living in the reserve in 2016 and meeting the following inclusion criteria: have no limitations to open the mouth, have natural teeth in the mouth, not being hospitalized at the time of the study, and express willingness to participate both themselves and their caregivers.
The information was collected through a survey (gathering data on sociodemographic variables, disability type, access to a health insurance system, hygiene habits, and the like) and a clinical examination in order to establish oral hygiene status by means of the Community Plaque Index (CPI).25 This method consists on applying a plaque disclosing solution for two minutes in order to evaluate the marked surfaces as follows: 0 = no plaque; 1 = presence of plaque in any area of the evaluated side. The results are presented in percentage values, dividing the total surfaces with plaque over the total surfaces examined by two, minus the six palatine sides of teeth 13, 12, 11, 21, 22 and 23. The result of this operation is multiplied by 100.24 Four rating categories were obtained, as follows: 0-10: good, 11-25: acceptable, 26-50: poor, >51: bad.
In order to assess the CPI, the operator was theoretically and clinically standardized at the facilities of Universidad Nacional de Colombia (Kappa > 0.8 inter and intra examiner), and a pilot test was applied to non-disabled indigenous people from the community. The collection tools (survey and clinical examination) were validated during this pilot test. All people with some degree of disability (physical, cognitive, or sensory) were identified and listed during a prior visit to the indigenous council, in company with the indigenous authorities and the local nursing assistant. The ICF parameters were used to know the participants’ homes and places of residence by the time the fieldwork was completed.
This study is part of the research project titled “Oral hygiene status according to Community Plaque Index in the Misak community with disabilities between January and July 2016,”26 which was a requirement to qualify for the title of Specialist in Pediatric Stomatology; this is why data collection was carried out by the researcher intern in Pediatric Stomatology and Maxillary Orthopedics at Universidad Nacional de Colombia and a nursing assistant of the Misak community, who in turn was in charge of the translation into the indigenous community’s dialect (Namtrik).
During the fieldwork, all persons with disabilities were visited, recording the information on the survey and the CPI form. All the data were entered into an Excel spreadsheet and exported to Stata, version 13.0, for processing and analysis. Prior to the analysis, the database was double checked, and all inconsistencies were compared against the corresponding surveys in order to make corrections or enter missing data where possible.
This study was approved by the Ethics Committee of the Universidad Nacional de Colombia School of Dentistry as a low risk investigation, and was also approved by the authorities of the indigenous council. Informed consents were obtained from adults and caregivers, as well from minors as needed. An explanatory brochure was available in Spanish and Namtrik language.
The statistical analysis included exploratory analysis using descriptive statistical techniques to determine the distribution of variables. A bivariate analysis was performed, categorizing by disability type. Even though there was access to the population census, a description of the various disability types was made using contingency tables, chisquared and Fischer tests according to disability type and the degree of plaque index; a statistical significance lower than 0,05 (p < 0.05) was used.
RESULTS
46 disabled people were identified, surveyed, and assessed. 82.6% of them were born in the same Guambia reserve; 54.3% were men and 45.7% women, aged 22.6 (SD 11) years in average. Concerning marital status, most (91.3%) were single, and in terms of schooling, 28.2% had no formal education. As for occupation, the main economic activities among the studied population were manual labor, such as agriculture and handcrafting, which do not require formal training. The distribution of these sociodemographic variables by sex is shown in Table 1.
Table 1 Sociodemographic characteristics of the Misak indigenous community with disabilities from the indigenous reserve of Guambia, Silvia-Cauca, Colombia
| Variable | Male | Female | ||
|---|---|---|---|---|
| Frequency | Percentage | Frequency | Percentage | |
| Marital status | ||||
| Single | 23 | 92.0 | 19 | 90.4 |
| Domestic partnership | 1 | 4.0 | 0 | 0.0 |
| Married | 1 | 4.0 | 1 | 4.7 |
| Widow/er | 0 | 0.0 | 1 | 4.7 |
| Total | 25 | 100.0 | 21 | 100.0 |
| Education | ||||
| Preschool | 3 | 12.0 | 1 | 4.7 |
| Primary school | 10 | 40.0 | 9 | 42.8 |
| Secondary school | 6 | 24.0 | 3 | 14.3 |
| Other | 0 | 0.0 | 1 | 4.7 |
| None | 6 | 24.0 | 7 | 33.3 |
| Total | 25 | 100.0 | 21 | 100.0 |
| Occupation | ||||
| Farming | 6 | 24.0 | 3 | 14.3 |
| Handcrafting | 0 | 0.0 | 4 | 19.0 |
| Home | 3 | 12.0 | 4 | 19.0 |
| Fish farming | 1 | 4.0 | 0 | 0.0 |
| None | 4 | 16.0 | 3 | 14.3 |
| Other | 10 | 40.0 | 7 | 33.3 |
| No information | 1 | 4.0 | 0 | 0.0 |
| Total | 25 | 100.0 | 21 | 100.0 |
Source: Research Archives, 2016
As for disability type, cognitive impairment was the most prevalent with 45.6%, while physical and sensory disabilities had a similar distribution, with 36.9%. An analysis to identify the amount of disabilities in the population showed that 76.1% had only one disability, 19.6% had two disabilities, and the remaining 4.3% three simultaneous disabilities. The distribution by sex, type and number of disabilities is shown in Table 2. Note that no woman has three simultaneous disabilities.
Table 2 Distribution by sex, type and number of disabilities. Guambia indigenous reserve, Cauca
| Variable | Male | Female | Total | ||
|---|---|---|---|---|---|
| Frequency | Percentage | Frequency | Percentage | Frequency | |
| Number of disabilities | |||||
| One | 19 | 54.2 | 16 | 45.7 | 35 |
| Two | 4 | 44.4 | 5 | 55.5 | 9 |
| Three | 2 | 100 | 0 | 0.0 | 2 |
| Disability type | |||||
| Physical | 9 | 52.9 | 8 | 47.1 | 17 |
| Cognitive | 16 | 64 | 9 | 36 | 25 |
| Sensory | 8 | 47.1 | 9 | 52.9 | 17 |
Source: Research Archives, 2016
In terms of disability type distribution by age range, there was a higher proportion of people in the age range of 11 to 20 years, with 41.2%, 35.3% and 40.0% for sensory, physical and cognitive disabilities respectively, as shown in Table 3.
Table 3 Distribution of disability type by age range. Guambia indigenous reserve, Cauca
| Age range | Sensory | Physical | Cognitive | ||||
|---|---|---|---|---|---|---|---|
| Frequency | Percentage | Frequency | Percentage | Frequency | Percentage | ||
| < 10 | 3 | 17.6 | 2 | 11.7 | 5 | 20 | |
| 11 to 20 | 7 | 41.2 | 6 | 35.3 | 10 | 40 | |
| 21 to 30 | 3 | 17.6 | 4 | 23.5 | 4 | 16 | |
| 31 to 40 | 3 | 17.6 | 3 | 17.6 | 6 | 24 | |
| > 40 | 1 | 5.9 | 2 | 11.7 | 0 | 0 | |
Source: Research Archives, 2016
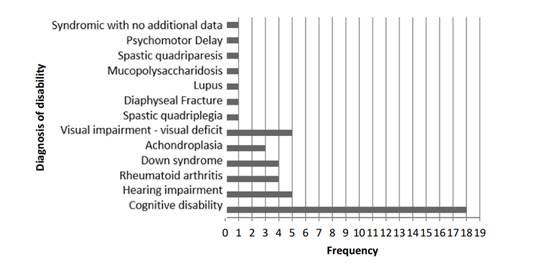
Concerning primary and secondary diagnosis of disability, cognitive impairment appears as first diagnosis; other systemic alterations leading to disability were found, including osteogenesis imperfecta, hearing loss, and pseudoarthrosis of the femur (Figure 1).
As for oral hygiene habits, the disabled persons were interviewed first, followed by the caregiver or adult present at the time of survey. As in some cases the accompanying person present at the interview was not the caregiver (and so they did not know the answers), some questions did not produce 100% of the information. Concerning oral hygiene, 43.4% of people with disabilities brush their teeth at least once a day (Table 4).
Table 4 Distribution of oral hygiene habits in the Misak community with disabilities, Guambia indigenous reserve, Silvia-Cauca, Colombia
| Oral hygiene habit | Frequency | Percentage | Accumulated Percent |
|---|---|---|---|
| Tooth brushing frequency | |||
| Once/day | 7 | 15.2 | 15.20 |
| Twice/day | 6 | 13.1 | 28.30 |
| Three times/day | 7 | 15.2 | 43.50 |
| No brushing | 1 | 2.2 | 45.70 |
| No information | 25 | 54.3 | |
| 100.00 | |||
| Total | 46 | 100 | |
| Brush use | |||
| Yes | 32 | 69.6 | 69.6 |
| No | 2 | 4.3 | 73.9 |
| No information | 12 | 26.1 | |
| 100 | |||
| Total | 46 | 100 | |
| Dental floss use | |||
| Yes | 5 | 10.9 | 10.9 |
| No | 28 | 60.9 | 71.8 |
| No information | 13 | 28.2 | |
| 100 | |||
| Total | 46 | 100 | |
| Mouthwash use | |||
| Yes | 3 | 6.5 | 6.5 |
| No | 30 | 65.2 | 71.7 |
| No information | 13 | 28.3 | |
| 100 | |||
| Total | 46 | 100 | |
Source: Research Archives, 2016
Regarding the specific tooth brushing activity by people with disabilities, 56.5% perform this activity by themselves. As for learning how to brush their teeth, 30.4% were taught by their mothers, 15.2% by their fathers, and 10.9% by a non-relative. In terms of dental care experience, 32.6% experienced pain in previous months, and 24% saw a dentist during the last year due to oral hygiene reasons (28.2%).
The average Community Plaque Index (CPI) value in the disabled population was 91.9%, a “poor” category according to this index. Gender distribution shows a value of 90.6% for males and 93.4% for females. On the other hand, the persons had 23 teeth in average, suggesting that they have lost teeth. Concerning sociodemographic variables, a lower CPI was observed in partnered people, and in persons with some degree of education and an occupation (Table 5).
Table 5 Community Plaque Index by sociodemographic variables
| Sociodemographic variables | Frequency | Average CPI |
|---|---|---|
| Marital status | ||
| Single | 42 | 92.4 |
| Partnered | 4 | 86.0 |
| Total population | 46 | 91.9 |
| Education | ||
| Some level of education | 33 | 91.2 |
| No education | 13 | 93.4 |
| Total population | 46 | 91.9 |
| Occupation | ||
| With occupation | 38 | 91.7 |
| No occupation | 5 | 92.9 |
| Total population | 46 | 91.9 |
Source: Research Archives, 2016
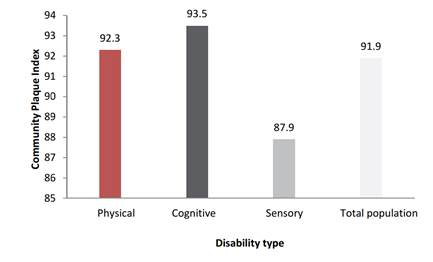
When evaluating CPI by type of disability, a higher index for cognitive disability is observed, as shown in Figure 2.
Source: Research Archives, 2016
Figure 2 Community Plaque Index by disability type in the Misak community with disabilities, Guambia indigenous reserve, Silvia-Cauca, Colombia
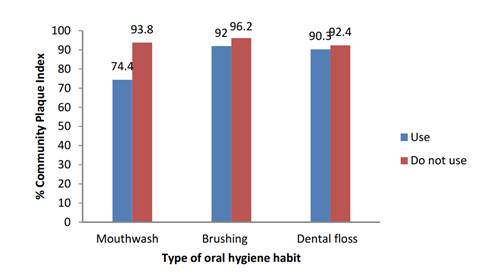
Recategorization was performed by asking “yes” “no” questions for variables like dental floss and mouthwash use, finding out a lower CPI among those who use complementary oral hygiene items (Figure 3).
DISCUSSION
The Misak community with disabilities is composed mostly by males, as opposed to the literature reports, in which disabilities are more frequent in females.27 It is worth noting that the male/female ratio differs in terms of disability type (more men with physical disabilities and more women with sensory disabilities). Cognitive disability is the one with the highest proportion, while physical and sensory disabilities occur in the same percentage. In Native American communities, physical, sensory, and cognitive disabilities were reported in equal proportion.12 It is important to bear in mind that cognitive disabilities must be analyzed from different perspectives, including the social, academic and communication domains,22,23 as these disabilities further limit interpersonal relationships and increase unfair differences in this population.
The sociodemographic variables are a valuable source of information on health inequities as they help uncover barriers to dental promotion, prevention, and treatment. The disabled Misak persons with low education levels have a higher CPI, a shared situation with other indigenous populations,12,13,22 where low educational levels negatively influence oral health care.
A low socio-economic level appears as a health risk factor among people with disabilities.28 The Misak population, like most indigenous peoples in Colombia, has limited financial resources, putting them at greater risk of suffering from health problems; add a disability to this indigenous situation, and the risk of disease increases.
Concerning oral hygiene habits, a 2011 study in indigenous population of the Colombian Amazon29 reported a proportion of 35,3% use of oral implements, compared to 25.5% in the Misak population with disabilities, showing better oral hygiene habits among the Amazonian indigenous (with no disabilities). The indigenous from the Amazon region use mouthwash in 5%, half of the value reported for the Misak in Cauca. The use of dental floss is similar in both indigenous communities, with about 7%.
As for health services and frequency of dental visits in the Misak population, the proportion (24%) is similar to the findings reported for non-disabled indigenous people in Australia,30 with 15.4% to 35.5% of non-disabled Australian natives visiting the dentist in the last 12 months, according to the report. In the United States, there are reports of indigenous people with disabilities who have never seen a dentist.22
The low number of dental visits among the Misak indigenous people indicates low health care levels in promotion and prevention activities, while for the Colombian health system it is higher than 95%; therefore, this population lacks information on adequate hygiene habits, increasing the risk of developing oral diseases, such as periodontal problems (bone loss, dental loss, periodontal disease) and poor oral health.11
Overall, the Misak community with disabilities have poor oral hygiene, which may compromise their well-being in the future, violating their right to oral health and quality of life.31-35 This in turn suggests that categories like race/ethnicity and disability increase the oppressions, exclusions and vulnerabilities by decreasing their quality of life and increasing their risks, with higher levels of dental care needs among racial, ethnic, and disabled groups.12
One of the strengths of the present study is the fact that it was conducted using the census on disabled people of the indigenous community. In addition, having a translator to the indigenous dialect helped ask questions clearly and consistently when interviewing the study subjects or their caregivers; the researchers also counted with the authorization, simultaneous work, and communication with indigenous and health authorities, and the fieldwork was carried out in the participants’ homes, without them needing to travel. Finally, the person performing the CPI was adequately standardized. As limitations, there was a short time for each clinical evaluation, which in the case of disabled people makes it difficult to conduct the CPI test one more time with revealing substance during the same visit, as it temporarily dyes teeth, prompting to schedule a second visit if the person’s disability does not allow for immediate cleaning. In addition, in cases of persons with multiple caregivers there were different responses to questions about the habits and practices of people with disabilities.
CONCLUSIONS
The Misak population with disabilities has a high bacterial plaque index, suggesting the presence of poor oral hygiene habits; in addition, they have low levels of dental care, putting them at a higher risk for cavities and/or periodontal disease, and therefore a decreased quality of life.
Similarly, national and international health care principles advocate for equity in care, respecting the dignity, autonomy and needs of persons with disabilities. However, these health care principles are not available to the Misak population. In addition, there are social, economic, and geographical determinants, which marginalize this population and reveal unfair inequalities in health. Failure to correct these determinants will further deteriorate the indigenous population’s health.
Comparative studies are recommended in other Colombian indigenous populations with disabilities to better understand the intersection race/ethnicity-disability, favoring the development of public health programs and policies to improve the oral health services and therefore the population’s oral hygiene status-in line with the principles stated in the country’s policy for comprehensive health care.

