


Serviços Personalizados
Journal
Artigo
 Inglês (pdf)
 Artigo em XML
 Referências do artigo
 Enviar este artigo por email
Indicadores
-
 Citado por SciELO
 -
 Acessos
Links relacionados
-
 Citado por Google
 -
 Similares em
SciELO
Similares em
SciELO -
 Similares em Google
Compartilhar

 Permalink
CT&F - Ciencia, Tecnología y Futuro
versão impressa ISSN 0122-5383versão On-line ISSN 2382-4581
C.T.F Cienc. Tecnol. Futuro v.3 n.2 Bucaramanga jan./dez. 2006
Freddy-Humberto Escobar 1 , Matilde Montealegre M.2, and José -Humberto Cantillo3
1,2 Universidad Surcolombiana, Programa de Ingeniería de Petróleos, Grupo de Investigación en Pruebas de Pozos, Neiva, Huila, Colombia. e-mail: fescobar@usco.edu.co
3 Ecopetrol S.A.- Instituto Colombiano del Petróleo, A.A. 4185 Bucaramanga, Santander, Colombia. e-mail: matildemm@usco.edu.co e-mail: jose.cantillo@ecopetrol.com.co
(Received Jun. 24, 2006; Accepted Nov. 23, 2006)
ABSTRACT. It is difficult to ignore a 0,36-slope line, bi-radial flow, which shows up in the pressure derivative plot of many well pressure tests conducted in hydraulically fractured vertical wells. Needless to say that interpretation of this flow regime as linear flow introduces errors in the estimation of the fracture parameters.
Very few technical papers have dealt with the bi-radial or elliptical flow. Even though, none of the commercial well test interpretation packages name it, they can reproduce the typical pressure behavior in which elliptical flow is seen.
For more than half a century, conventional techniques have been a very reputed and respected method for interpretation of well pressure tests. Therefore, it is necessary to add a new methodology to complement the conventional technique so that the bi-radial/elliptical flow can be characterized, and of course, its application leads to an appropriate evaluation and assessment of a fracture treatment. Therefore, this paper provides a new alternative which allows to obtain the slope of the cartesian plot of pressure vs. either t 0,36 (for drawdown) or ([ t p +?t ] /?t ) 0,36 (for buildup) from which the half-fracture length is readily estimated. The proposed technique was verified by the application of a field case and a simulated example.
Keywords: reservoir, permeability, fracture (rock), fluid flow.
RESUMEN. Resulta difícil ignorar la presencia de un línea recta con pendiente de 0,36, flujo bi-radial, que se presenta en el gráfico de la derivada de presión en muchas pruebas de presión conducidas en pozos con fracturas hidráulicas verticales. Sobra decir, que la interpretación de este régimen de flujo como si fuese un régimen de flujo lineal introduce errores en la estimación adecuada de los parámetros de la fractura.
Muy pocos artículos técnicos han hablado acerca del flujo bi-radial o elíptico. Incluso, ningún paquete comercial de interpretación de pruebas de presión lo nombra como tal, en muchos casos, éstos pueden reproducir el comportamiento del flujo elíptico.
Por más de medio siglo, las técnicas convencionales han sido un método muy famoso y respetado para analizar pruebas de presión. Por lo tanto, surge la necesidad de complementar esta metodología de modo que el flujo bi-radial/elíptico pueda caracterizarse, y por supuesto, su aplicación conlleve a una evaluación y valoración adecuada de un tratamiento con fracturas hidráulicas. Por ello, este artículo trata de, precisamente, proporcionar una alternativa nueva que permita obtener la pendiente cartesiana de un gráfico de presión ya sea contra t 0,36 (para pruebas de declinación) o ([ t p +?t ] /?t ) 0,36 (para pruebas de restauración) de la cual se obtiene fácilmente la longitud media de la fractura. La metodología propuesta se verificó mediante la aplicación exitosa a un caso de campo y una prueba sintética.
Palabras clave: yacimientos, fracturas (rocas), flujo de fluidos, permeabilidad.
INTRODUCTION
Gringarten, Ramey, and Raghavan (1974), Cinco-Ley (1982), Cinco-Ley and Samaniego (1981), Tiab, Azzougen, Escobar and Berumen (1999) have presented several significant studies for interpretation of well pressure test data in vertically fractured wells. The analytical model of Gringarten et al. (1974) describes the pressure behavior of a hydraulically fractured well and allows to visualize the presence of a 0,36-slope line on the pressure derivative curve. Tiab (1993b) was the first one to point out the behavior of the 0,36-slope line which he baptized as "bi-radial flow regime". He provided the governing pressure derivative equation for this flow regime and included the unique method, so far, for its characterization based upon his Tiab Direct Synthesis (TDS) techinque, Tiab (1993a). Although, TDS is a powerful tool, it has not been very well utilized. Our proposal consists of constructing a cartesian plot of bottom-hole pressure drop from either a buildup or drawdown test versus t0,36 or ([ t p +?t ] /?t ) 0,36 and, then, estimate its slope during the bi-radial/elliptical flow regime so that half-fracture length can be estimated.
CONVENTIONAL TECHNIQUE FOR ELLIPTICAL/BI-RADIAL FLOW
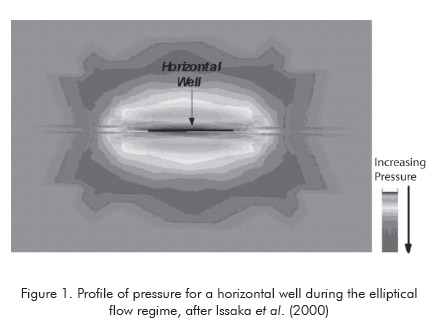
The bi-radial flow regime was initially characterized by Tiab (1993b) for infinite- conductivity vertical fractured wells. Later, Issaka, Zaoral, Ambastha and Mattar (2000) identified the presence of this flow regime in some pressure tests of horizontal wells. They simulated this behavior and plotted an isobar map as shown in Figure 1. The extension of the TDS technique in the elliptical flow regime of horizontal wells was presented by Escobar, Mu?oz and Sep?lveda (2004).
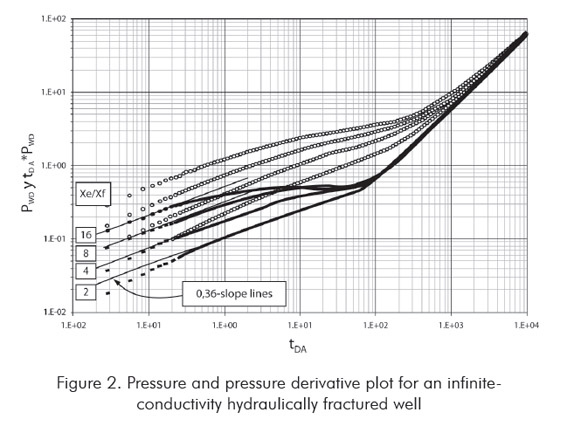
A log-log plot of the dimensionless pressure and pressure derivative vs. dimensionless time for a well with a infinite-conductivity fracture is presented in Figure 2 for different values of the reservoir length and half-fracture length ratio, xe/xf, we can observe the existence of four possible straight lines as a) linear flow, b) bi-radial or elliptical flow, c) radial flow regimes, and d) pseudosteady (or steady) state. As pointed out by Tiab (1993b), as the xe/xf ratio increases the duration of the bi-radial flow regime increases. For ratios greater than 16, the bi-radial flow completely dominates the test and, therefore, linear flow is practically unseen.
For many decades, the oil industry has extensively used conventional analysis, a methodology that utilizes cartesian plots, semilog plots, and many combinations of pressure versus time plots from which the slope and intercept are readily used to estimate reservoir parameters, to characterize well test data or to complement other interpretation techniques. Therefore, the conventional method continues to be a very respectful tool for interpretation of transient pressure data. However, there have recently appeared new scenarios, such as the bi-radial flow regime, in which the conventional technique does not possess the required equations to characterize them. Therefore, this study is focused on presenting the mathematical formulation for bi-radial flow occurring in vertically fractured vertical wells, so an equation for the estimation of the half-fracture length is developed and applied.
Using linear regression analysis, Tiab (1993b) determined the dimensionless pressure derivative equation governing the bi-radial flow, as follows:
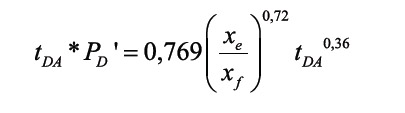 (1)
(1)
In oilfield units, Equation 1 becomes:
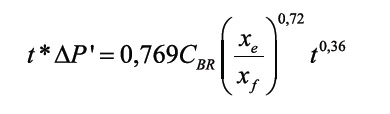 (2)
(2)
Where:
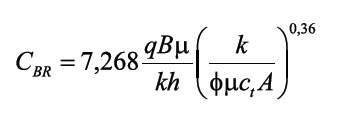 (3)
(3)
Integration of Equation 1, for dimensionless time between 0 and tDA, and dimensionless pressure between 0 and PD, allows us to obtain for pressure drawdown:
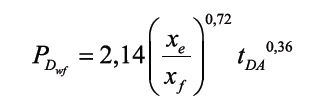 (4.a)
(4.a)
For buildup cases, superposition in time is required, therefore:
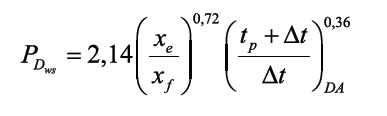 (4.b)
(4.b)
The corresponding versions of Equations 4.a and 4.b in oil field units are given, respectively, by:
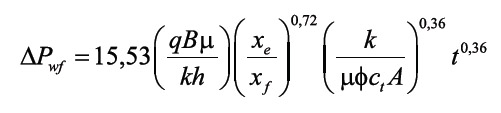 (5.a)
(5.a)
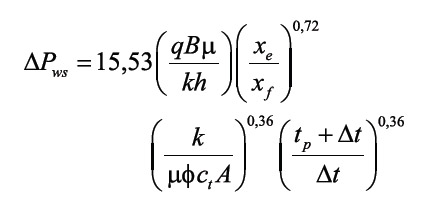 (5.b)
(5.b)
Equations 5.a and 5.b indicate that a cartesian plot of either ? Pwf vs. t0,36 or ?Pwf vs. ([tp+?t]/?t)0,36 will display a straight line during the bi-radial dominated period, as shown in field examples. The slope, mef, allows to determine the half-fracture length, xf, if reservoir permeability and reservoir drainage area are known, by means of the following expression solved from Equations 5.a and 5.b:
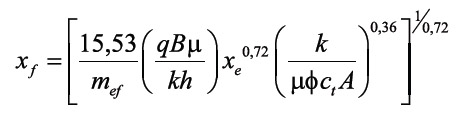 (6)
(6)
EXAMPLES
Simulated 3 example
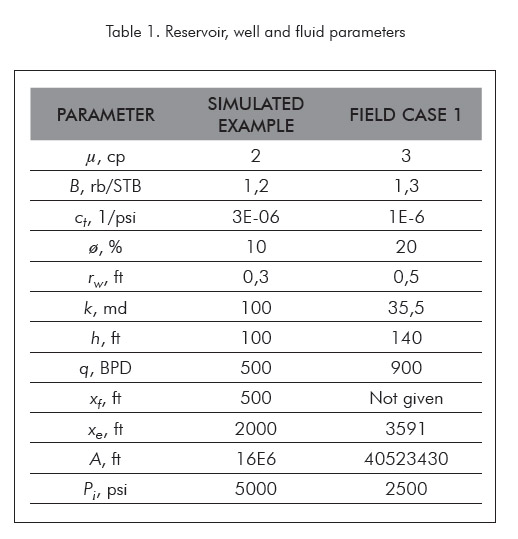
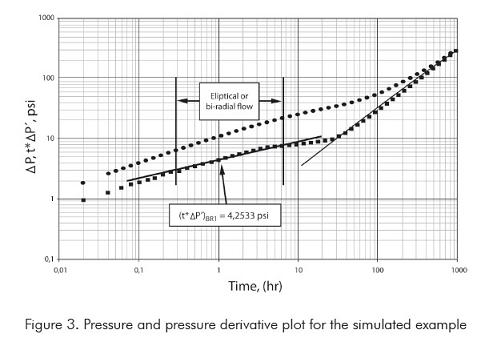
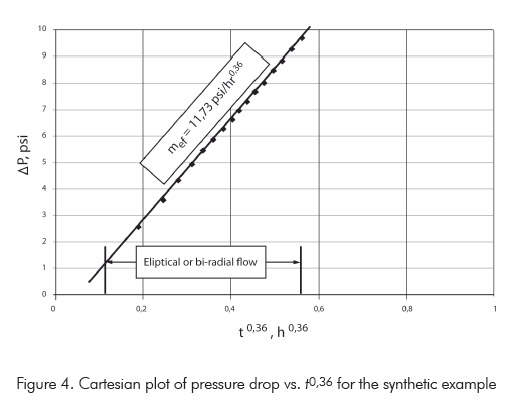
In Table 1, we present the reservoir and fluid parameters used to simulated a drawdown test of a vertical fractured well with infinite conductivity. The pressure and pressure derivative resulting from the simulation are provided in Figure 3. It is required to estimate the half-fractured length.
Solution
Figure 3 presents a log-log plot of pressure and pressure derivative for this simulated test. We observe there that a 0,36-slope line on the pressure derivative curve shows up between 0,25 and 6 hours, period at which, the slope of the cartesian plot, Figure 4, was measured to be 11,76 psi/hr0,36. By using Equation 6, we found a half-fracture length, xf, of 501,2 ft, which agrees certainly well with the simulated input value of 500 ft. This was also verified by using the TDS technique, Tiab (1993b), which utilizes the pressure derivative value of the bi-radial flow line at time of one tour, ( t*?P´)BR1, extrapolated if necessary. According to Tiab (1993b) the half-fracture length, xf, is determined from:
(7)
From Figure 3, a value for (t*?P´)BR1 of 4,2533 psi was read. Using Equation 3, a CBR value of 2,03 was obtained and, from Equation 7, we determined a half-fracture length, xf, of 496,4 ft . This value agrees very well with the simulated one and the value obtained by our proposed methodology.
Field example
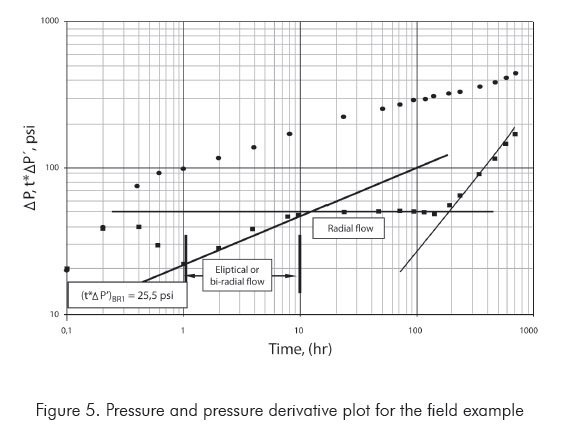
Estimate the half-fractured length for a fractured well located in the north of Africa which well and reservoir parameters are given in third column of Table 1 and the simulated pressure and pressure derivative data are given in Figure 5.
Solution
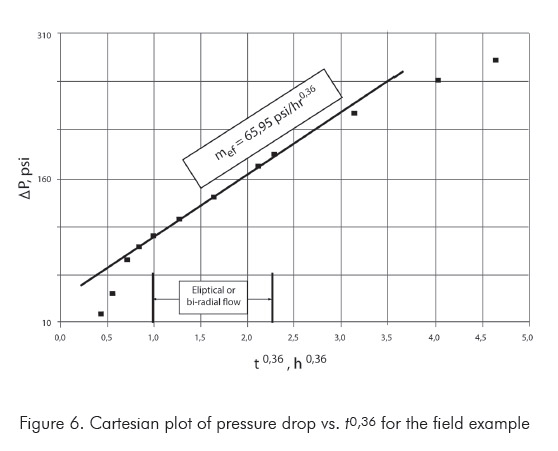
In Figure 5, we can observe the presence of the bi-radial flow regime between 1 and 10 hours. From Figure 6, the cartesian plot of pressure versus t0,36, a value of mef = 65,95 psi/hr0,36 was estimated for use in Equation 6. This follows a half-fracture length, xf, of 359,2 ft .
To validate Equation 6, we unsuccessfully tried to solve it by history matching using a commercial and very popular well test software. After several attempts, it was difficult to closely match the pressure data since wellbore storage partially masks the earliest data points. Therefore, by applying the TDS technique, a CBR = 2,03 was found from Equation 3. From the pressure derivative curve a value of (t*?P´)BR1 = 22,5 psi was read to lead to an estimation of a half-fracture length, xf, of 354,9 ft by means of Equation 7.
Notice that the half-fracture length obtained from the proposed and the TDS technique agree quite well.
CONCLUSION
The conventional technique has been complemented by constructing a Cartesian plot of pressure versus either time or superposition time to the power of 0,36. During the bi-radial flow period, a straight line behavior is seen. From the slope of this line the half-fracture length for an infinite-fractured conductivity vertical well can be readily estimated by using an equation developed here. The methodology was successfully tested and verified with a simulated and a field example.
ACKNOWLEDGMENTS
The authors gratefully acknowledge the financial support of Ecopetrol S.A. - Instituto Colombiano del Petrsleo (ICP), under the mutual agreement number 008, 2003 signed between this institution and Universidad Surcolombiana ( Neiva , Huila , Colombia ).
REFERENCES
Cinco-Ley, H. (1982). Evaluation of hydraulic fracturing by transient pressure analysis methods. SPE International Petroleum Exhibition and Technical Symposium, Beijing , China , Mar. 18-26. SPE 10043. [ Links ]
Cinco-Ley, H., & Samaniego, F. (1981). Transient pressure analysis for fractured wells. J. Petroleum Technol., 33 (9), 1749-1766. [ Links ]
Escobar, F. H., Mu ? oz, O. F., & Sep ? lveda J. A. (2004). Horizontal permeability determination from the elliptical flow regime for horizontal wells. CT&F – Ciencia, Tecnología y Futuro, 2 (5), 83-95. [ Links ]
Gringarten, A. C., Ramey, H. J., Jr., & Raghavan, R. (1975). Applied pressure analysis for fractured wells. J. Petroleum Technol., July, 887-892. [ Links ]
Issaka, M. B., Zaoral, K., Ambastha, A.K., & Mattar, L. (2000). Determination of horizontal permeability anisotropy from horizontal well tests. SPE Saudi Arabia Section Technical Symposium, Dhahran, Saudi Arabia , 21-23. [ Links ]
Tiab, D. (1993a). Analysis of pressure and pressure derivative without type-curve matching: 1- factor de da?o and wellbore storage. SPE Production Operations Symposium, Oklahoma City , OK , Mar. 21-23, 203-216. Also, J. Petetroleum Scien. and Engineer., 3 (1995), 171-181. SPE 25423. [ Links ]
Tiab , D. (1993b). Analysis of pressure derivative without type-curve matching: vertically fractured wells in closed systems. J. Petetroleum Scien. and Engineer., 11 (1994), 323-333. Originally presented at the 1993 SPE Western Regional Meeting, Anchorage, Alaska , May, 26-28. SPE 26138. [ Links ]
Tiab, D., Azzougen, A., Escobar, F. H., & Berumen, S. (1999). Analysis of pressure derivative data of a finite-conductivity fractures by the direct synthesis technique'. Originally presented at the 1999 SPE Mid-Continent Operations Symposium, Oklahoma City , OK , Mar.28-31, 1999, and presented at the 1999 SPE Latin American and Caribbean Petroleum Engineering Conference, Caracas, Venezuela, April, 21–23. SPE 52201. [ Links ]

