


 Inglês (pdf)
 Artigo em XML
 Referências do artigo
 Enviar este artigo por email
 Citado por SciELO
  Citado por Google
  Similares em
SciELO
Similares em
SciELO  Similares em Google
 Permalink
INTRODUCTION
Cape gooseberry (Physalis peruviana L.) is a native plant from the Andean region that belongs to the Solanaceae family (Fischer and Melgarejo, 2020). The cape gooseberry fruits contain high amounts of vitamins A, B, and C, polyunsaturated fatty acids, phytosterols, essential minerals, antioxidants, withanolides, and physalins. It has medicinal benefits, with antitumor, anti-inflammatory, antiparasitic antimicrobial, and anticancer properties (Demir et al., 2014; El-Beltagi et al., 2019; Huang et al., 2020, Miranda and Fischer, 2021).
About 80 species of Physalis have been reported worldwide, but only three ecotypes have been cultivated in Colombia: Kenya, South Africa, and Colombia, whose names are derived from the country where they come from (Peña et al., 2010; Valderrama and Núñez, 2021). The Colombia ecotype is the most important genetic material in the producing areas since it stands out for its color, aroma, and high sugar content in the fruit (Miranda, 2005). However, the commercial plantations of this ecotype have shown high phenotypic variability probably due to the mixture of the different ecotypes grown in the country (Bonilla et al., 2019).
Colombia produces around 20,000 t year-1 of cape gooseberry fruits, mainly in the departments of Cundinamarca, Boyaca, Antioquia, and Nariño. This fact has positioned Colombia as the world's leading producer of cape gooseberries (Minagricultura, 2020, 2022). However, the national yields have decreased by 30%, from 17.8 t ha-1 in 2009 to 10.4 t ha-1 in 2020 (Agronet, 2020; Minagricultura, 2020) due to the discarding of cracked fruits (up to 50%) (Fischer, 2021; Criollo et al., 2014), also due to the use of plant material of unknown origin and identity, and mixture of ecotypes (Rodríguez and Bueno, 2006). Therefore, it is important to develop high-yielding varieties with high-quality fruit to meet national demand and access new export destinations.
Several studies have been carried out to identify genetic resources useful for the cape gooseberry breeding program. Some of these investigations include the study of ploidy level and genetic diversity, agronomic characterization, the development of haploid and dihaploid lines via anther culture, and the generation of F1 populations (Suescún et al., 2011; Liberato et al., 2014; García-Arias et al., 2018; Mayorga-Cubillos et al., 2019; Franco-Florez et al., 2021; Sánchez-Betancourt and Nuñez, 2022). From these studies, nine promising materials with desirable attributes of yield and fruit quality were chosen for evaluation across multiple locations to assess G×E interaction and select genotypes with specific or broad adaptation in Colombia.
Several multivariate methods have been proposed to study G×E interaction, including analysis of variance (ANOVA), principal components analysis (PCA), linear regression, genotype plus genotype by environment (GGE), and additive main effects and multiplicative interactions (AMMI). The AMMI is one of the most used multivariate methods for statistical analysis of yield trials and includes ANOVA and PCA analysis in a unified approach (Zobel et al., 1988; Crossa, 1990). According to Gauch et al. (2008), this model has shown results with a clear agronomic meaning and has been effective due to its ability to capture the G×E interaction. At the same time, this model facilitates the identification of mega-environments and allows breeders to interpret the data and make reliable decisions in the selection of superior genotypes for each environment (Zobel et al., 1988; Gauch et al., 2008; Movahedi et al., 2020).
The AMMI model includes more than one model, that is, a family of models, discriminated by the number of components that it retains and are called AMMI0, AMMI1, AMMI2, AMMI3, and so on. AMMI0 being the one that does not contain components, while AMMI1 contains a component, etc. The model AMMI1 is used to estimate the prediction of yield across environments and combines the additive main effect from genotypes and environments with the interaction effects estimated from the principal component 1 (PC1). According to Crossa et al. (1991) and Gauch (2013), AMMI1 is a simpler and more suitable model for mega-environment delineation and identification of winning genotypes in each environment compared to the other AMMI family members.
Considering the few reported studies in G×E interaction in cape gooseberry and the need to identify genotypes with differential response across the environments, it is crucial to carry out studies on this topic. Therefore, this research aimed to evaluate the G×E interaction of 13 cape gooseberry genotypes in different locations and identify high-yielding genotypes with broad or specific adaptation to Colombia.
MATERIALS AND METHODS
Genetic material and experimental locations
The plant material included nine elite genotypes labeled “A to I” and four commercial cape gooseberry genotypes (N, R1, R2, and R3) currently in use in the Agrosavia breeding program. These genotypes were previously evaluated in different studies and selected for their high yield and high sugar content (García-Arias et al., 2018; Mayorga et al., 2019). The elite genotypes came from the Universidad Nacional de Colombia - UNAL and Corporación Colombiana de Investigación Agropecuaria - Agrosavia collections, whereas the commercial genotypes came mostly from farmers in the different producing areas. The genotype N (Colombia ecotype) is widely cultivated across the country and the genotypes R1, R2, and R3 are cultivated in Cundinamarca, Antioquia, and Nariño departments, respectively (Tab. 1).
Table 1. Passport information of cape gooseberry genotypes included in the study.
| Label | Genotype | Other * codes | Country | Department | Town | Germplasm collection | Observation |
|---|---|---|---|---|---|---|---|
| A | 12U336 | - | Colombia | -- | -- | Agrosavia | Experimental genotype derived from anther culture |
| B | 12U346 | - | Colombia | -- | -- | Agrosavia | Experimental genotype derived from anther culture |
| C | 12U372 | - | Colombia | -- | -- | Agrosavia | Experimental genotype derived from anther culture |
| D | 13U406 | 09U047 | Colombia | Boyaca | Tota | UNAL | Experimental genotype |
| E | 13U413 | 09U279 | Colombia | Nariño | Pasto | Agrosavia | Experimental genotype |
| F | 13U416 | 12U381 | Colombia | Boyaca | Pesca | UNAL | Experimental genotype |
| G | 09U089 | - | Colombia | Antioquia | San Pedro de Uraba | Agrosavia | Experimental genotype |
| H | 09U278 | - | Colombia | Nariño | Pasto | Agrosavia | Experimental genotype |
| I | 12U396 | - | Colombia | Antioquia | El Peñol | Agrosavia | Experimental genotype |
| R1 | 13U411 | 09U274 | Colombia | Cundinamarca | -- | Private company | Cundinamarca Regional control |
| R2 | 09U171 | - | Colombia | Antioquia | -- | Farmer | Antioquia Regional control |
| R3 | 13U417 | - | Colombia | Nariño | Ipiales | Farmer | Nariño Regional control |
| N | 09U275 | Colombia | Cundinamarca | Choconta | Agrosavia | National control |
The evaluation of the genotypes was conducted across seven locations in three departments (Antioquia, Cundinamarca, and Nariño) in Colombia. The locations were La Union (LU), Rionegro (RN), and San Vicente (SV) in Antioquia; Mosquera (MO) in Cundinamarca; and Ipiales (IP), Pasto (PA), and Puerres (PU) in Nariño. The locations are representative of the producing areas of the country, and they are located between 2,117 and 2,856 m a.s.l. with different rainfall regime that range from 700 to 1,800 mm. The average of temperature of the locations ranges from 10.2 to 17.0°C and showed a soil pH between 4.9 to 6.19 (Tab. 2).
Table 2. Geographic and environmental characteristics of the experimental locations in Colombia.
| Department | Location | Latitude (N) | Longitude (W) | Altitude (m a.s.l.) | Soil texture | Soil pH | Average temperature (°C) | Average rainfall (mm) | Topography |
|---|---|---|---|---|---|---|---|---|---|
| Antioquia | La Union (LU) | 05º08′01.40" | 75°23´40.40" | 2,444 | Silty | 5.68 | 13.0 | 1,800 | Strongly wavy |
| Antioquia | Rionegro (RN) | 06°08´12.42" | 75°25´06.70" | 2,117 | Silty | 5.90 | 17.0 | 1,800 | Flat |
| Antioquia | San Vicente (SV) | 06°20´48.70" | 75°16´14.10" | 2,354 | Clay loam | 4.90 | 17.0 | 1,500 | Wavy |
| Cundinamarca | Mosquera (MO) | 04°41´50.65" | 74°12´17.64" | 2,550 | Silty loam | 6.19 | 12.9 | 700 | Flat |
| Nariño | Ipiales (IP) | 00°51′52.00" | 77°35´10.00" | 2,856 | Sandy loam | 5.30 | 10.2 | 743 | Slight slope |
| Nariño | Pasto (PA) | 01°12´06.00" | 77°18´27.00" | 2,760 | Silty loam | 5.53 | 11.8 | 870 | Slight slope |
| Nariño | Puerres (PU) | 00°54´58.00" | 77°28´55.00" | 2,612 | Clay loam | 5.70 | 12.5 | 798 | Slight slope |
Trial establishment and data collection
Genotypes were tested under field conditions during the same year using a randomized complete block design with four replicates in each location. Each experimental plot had five plants per replicate and was planted with a spacing of 2.5 m between rows and 2.0 m between plants, with a total area of 5 m2 per plot. Fertilization was carried out according to the soil analysis for each location.
The evaluated traits were fruit yield and fruit weight. Fruit yield (FY) was determined from the accumulated fruit weight collected in 15 harvests from 5.5 to 10 months after transplantation, expressed as t ha-1 per year for each genotype; and fruit weight without calyx (FW) as the average weight of one fruit obtained from weighing 5 fruits per replicate and harvest.
Statistical analysis
Data from yield and fruit weight trials at all locations were summarized and subjected to analysis of variance (ANOVA), with Dunnett’s and Tukey’s test, at P<0.05, for genotypes and locations, respectively. The G×E interaction was analyzed using the AMMI method through SAS Enterprise software, version 8.3 (SAS Institute, 2020).
The AMMI model combines the ANOVA with principal component analysis (PCA) (1):
where Y ijk is the observed value of the i th genotype in the j th environment and k th repetition; μ is the grand mean; G i and E j are the deviation of the i th genotype and j th environment from the grand mean, respectively; λ n is a singular value of the n axis in the PCA; γin and δ jn are genotype and environment factors, respectively, in the singular vectors associated with λn from the interaction matrix; R ij is the part of the interaction that is explained by the PCA, and ɛ ijk is the deviation of the i th genotype in the j th environment of the k th repetition (Gauch, 1992).
RESULTS AND DISCUSSION
There were significant differences among genotypes, environments, and G × E interactions for fruit yield and fruit weight, indicating a differential response of the genotypes across the environments, therefore the possibility of selecting superior and stable genotypes. The environment explained 62.0 and 77.3% of the total sum of squares for fruit yield and fruit weight, respectively, whereas genotypes and G×E interactions each accounted for less than 9% of the variation (Tab. 3). The significantly higher contribution of the environments suggests that the environmental impact on fruit yield and fruit weight is more relevant than the main effect of each genotype, affecting the physiological processes of the plant, and in turn impacts yield (Sánchez et al., 2015). In line with this finding, Panayotov et al. (2016) also found a statistically significant contribution of environment to cape gooseberry yield, which was greater than the effect of genotypes and G×E interaction. Similarly, Rosero et al. (2021) found highly significant genotype-environment interaction in the evaluation of the combinatory ability of 36 cape gooseberry hybrids, obtained from nine inbred lines in four locations in the department of Nariño: Gualmatan, Puerres, Pasto, and Ipiales. Therefore, substantial variation is generated between genetic materials depending on the environment in which they develop. Likewise, Gauch and Zobel (1997) reported in Solanum tuberosum that the main effect of environments could account for 80% of the total variation, whereas the effects of genotype and G×E interactions only accounted for 10%, as found in the present study. Ngailo et al. (2019) also reported great contribution of environments (64%) and G×E interactions (25%) for variation in storage root yield compared with the main effect of genotypes (11%) in sweet potato. In the same way, Ceballos-Aguirre et al. (2020) also reported a larger contribution of the environment (34.37-75.08%), compared to that of genotypes (1.24-11.83%) and G×E interaction (23.68-53.80%) for quality traits in cherry tomatoes.
Table 3. AMMI analysis of variance for fruit yield and fruit weight of 13 cape gooseberry genotypes over seven locations.
| Source of variation | Fruit yield (FY) | Fruit weight (FW) | ||||
|---|---|---|---|---|---|---|
| df | MS | %SS | df | MS | %SS | |
| Genotype (G) | 12 | 180.1*** | 6.3 | 12 | 2.58*** | 8.8 |
| Environments (E) | 6 | 3567.5*** | 62.0 | 6 | 45.42*** | 77.3 |
| Block (Environment) | 21 | 84.3 | 5.1 | 14 | 0.06 | 0.2 |
| G×E interactions | 72 | 35.6* | 7.4 | 72 | 0.35*** | 7.1 |
| PC1 | 17 | 68.1** | 45.2 | 17 | 0.75*** | 50.9 |
| PC2 | 15 | 38.1ns | 22.3 | 15 | 0.32** | 19.2 |
| Residual | 40 | 20.8 | 32.5 | 40 | 0.19 | 29.9 |
| Error | 252 | 26.35 | 19.2 | 168 | 0.14 | 6.6 |
| CV | 20.7 | 7.4% | ||||
df: Degree of freedom; MS: Mean square; %SS: explained percentage of the sum of square; CV: coefficient of variation. Asterisks indicate significant differences at *5%; **0.5%; ***<0.01%; ns not significant.
The portioning of G×E components of fruit weight showed that the two first principal components (PC1 and PC2) of the interaction were significant and captured 50.9 and 19.2% of the variation, respectively. Nevertheless, the AMMI analysis for fruit yield indicated that only the first principal component of the G×E interaction was significant (P<0.005), and PC1 accounted for more than 45% of the interaction. However, the eigenvalues of the first two principal components were greater than one, explaining the interaction in 67.5%. Thus, the analysis of AMMI with PC1 seems appropriate and can explain the effect of the interaction, as it has been shown in G×E interaction studies in tomato (Ceballos-Aguirre et al., 2020) and sesame (Movahedi et al., 2020). There are no studies on cape gooseberry in this regard.
According to the unadjusted means, six genotypes had high yield in at least one environment, this number of genotypes is elevated, unwieldy, and impractical for planting recommendation in the producing areas. The methodology proposed by Crossa et al. (1991) and Gauch (1992); 2013) using the AMMI1 model reduce the number of winning genotypes and identifying mega-environments. The mega-environment is a subregion with similar genotypic responses and better performing cultivars (Yan et al., 2023). The locations of this study were grouped in two mega-environments based on PC1 scores (Tab. 4), which were primarily defined by having similar climatic and soil conditions. Mega-environment 1 (ME1) consisted of Rionegro, Puerres, Ipiales, and Mosquera, with a mean of 24.1 t ha-1, whereas mega-environment 2 (ME2) consisted of La Union, Pasto, and San Vicente, with a mean of 25.7 t ha-1. These mega-environments presented similar conditions between some locations. The locations in ME1 are mainly at >2,500 m a.s.l. and had rainfall between 700 and 900 mm, except Rionegro, and most had soils with high pH values (>5.7). On the other hand, ME2 locations are located below 2,500 m a.s.l., have soils with pH values below 5.7, and rainfall > 1,500 mm, except Pasto. Higher and well-distributed precipitation throughout the year compared to ME1, favored fruit production. Similar results have been reported by Fischer and Miranda (2012), who reported that well-distributed precipitation of 1,000 to 1,800 mm favors the vegetative and reproductive development of cape gooseberry, especially the fructification and guarantees high yields.
Table 4. AMMI1 estimates (top line) with their rank (in parenthesis) and unadjusted means (bottom line) for fruit yield (t/ha) of 13 cape gooseberry genotypes grown over seven locations.
| Environment (E) | Mean E | Genotype (G) | |||||||||||||
|---|---|---|---|---|---|---|---|---|---|---|---|---|---|---|---|
| A | B | C | D | E | F | G | H | I | N | R1 | R2 | R3 | |||
| ME1 | RN | 18.0 de | 9.2 (13) 11.8* | 19.7 (7) 24.0 | 17.0 (9) 17.1 | 18.8 (8) 14.5 | 11.3 (11) 12.4* | 20.5 (5) 20.9 | 24.1 (1) 22.9 | 15.2 (10) 11.6* | 23.1 (3) 22.7 | 23.2 (2) 24.3 | 11.1 (12) 11.0* | 20.6 (4) 20.7 | 19.9 (6) 20.6 |
| PU | 25.9 bc | 17.7 (13) 16.0 | 27.6 (6) 23.4 | 25.0 (9) 23.3 | 26.7 (8) 28.4 | 19.7 (12) 20.5 | 28.2 (4) 26.8 | 31.2 (1) 32.5 | 23.7 (10) 27.8 | 30.5 (3) 31.0 | 30.6 (2) 29.5 | 19.9 (11) 19.3 | 28.1 (5) 31.2 | 27.5 (7) 26.9 | |
| IP | 31.4 b | 25.0 (13) 21.2*+ | 33.0 (4) 33.1 | 30.8 (10) 29.9 | 32.2 (8) 37.0 | 26.4 (12) 23.8*+ | 33.0 (5) 32.0 | 34.4 (3) 33.9 | 30.9 (9) 32.6 | 34.6 (1) 34.0 | 34.6 (2) 37.0 | 27.8 (11) 30.4 | 32.8 (6) 29.3 | 32.3 (7) 34.3 | |
| MO | 21.0 cd | 15.4 (13) 17.1 | 22.6 (4) 21.9 | 20.6 (10) 24.6 | 21.8 (7) 22.9 | 16.5 (12) 17.2 | 22.2 (5) 23.3 | 23.0 (3) 24.8+ | 21.3 (9) 19.4 | 23.6 (1) 23.2 | 23.5 (2) 21.7 | 18.6 (11) 17.2 | 21.9 (6) 20.5 | 21.5 (8) 19.0 | |
| ME2 | LU | 13.6 e | 9.4 (13) 11.9 | 15.2 (2) 14.0 | 13.4 (10) 14.1 | 14.4 (5) 12.5 | 10.1 (12) 8.8 | 14.3 (6) 18.2 | 13.8 (8) 13.2 | 15.3 (1) 14.9 | 15.1 (3) 18.0 | 14.9 (4) 12.3 | 13.1 (11) 12.5 | 13.8 (7) 14.8 | 13.6 (9) 11.2 |
| PA | 38.2 a | 35.2 (13) 34.5 | 39.7 (2) 40.9 | 38.3 (8) 38.5 | 39.0 (4) 38.5 | 35.6 (12) 34.7 | 38.4 (7) 37.0 | 36.9 (11) 35.8 | 41.1 (1) 41.4 | 38.7 (5) 38.1 | 38.5 (6) 38.4 | 39.4 (3) 39.4 | 37.8 (9) 36.9 | 37.7 (10) 42.4 | |
| SV | 25.4 c | 23.0 (13) 22.5 | 26.9 (3) 27.4 | 25.6 (5) 23.4 | 26.2 (4) 25.5 | 23.1 (12) 25.3 | 25.4 (7) 23.7 | 23.4 (11) 24.1 | 28.8 (1) 28.9 | 25.5 (6) 24.4 | 25.2 (8) 27.2 | 27.4 (2) 27.7 | 24.7 (9) 26.8 | 24.6 (10) 22.4 | |
| Mean ME1 | 24.1 | 16.5 | 25.6 | 23.7 | 25.7 | 18.5 | 25.8 | 28.5 | 22.9 | 27.7 | 28.1 | 19.5 | 25.4 | 25.2 | |
| Mean ME2 | 25.7 | 23.0 | 27.4 | 25.3 | 25.5 | 22.9 | 26.3 | 24.4 | 28.4 | 26.8 | 26.0 | 26.5 | 26.2 | 25.3 | |
| Mean G | 24.8 | 19.3* | 26.4 | 24.4 | 25.6 | 20.4* | 26.0 | 26.7 | 25.2 | 27.3 | 27.2 | 22.5* | 25.7 | 25.3 | |
*Significant according to Dunnett's test at 5% level (control genotype N); +Significant according to Dunnett's test at 5% level (control genotypes R1, R2, and R3 of Cundinamarca, Antioquia, and Nariño departments, respectively). Locations with the same letter are not significantly different according to Tukey test. Locations: RN: Rionegro; PU: Puerres; IP: Ipiales; MO: Mosquera; LU: La Union; PA: Pasto; SV: San Vicente.
In warmer locations or when there are long periods of high temperature, the yields can be affected due to insufficient fruit set or increased fruit drop (Fischer and Orduz-Rodríguez, 2012), as observed in the locations of Rionegro and San Vicente of Antioquia department, where the temperature can ranged from 17 to 22°C. The locations of the Nariño department contributed to obtaining high yields, probably due to its natural soil conditions and microclimates suitable for the cape gooseberry production, specifically good availability of water resources, optimal temperatures, solar radiation, appropriate wind regime, and high fertility.
The fruit yield reported for most of the genotypes in this study ranged from 19.3 to 27.3 t ha-1, being above the national commercial yield reported in 2020, with a mean of 12.1 t ha-1 (Minagricultura, 2020). Genotypes I, N, G, B, D and H presented the best yields and were above the grand mean, whereas genotypes A and E had lower yield (Tab. 4). The N genotype or Colombia ecotype is cultivated throughout the country despite the lack of uniformity in cultivation and fruit traits; therefore, it was considered a national reference in the analysis.
The AMMI estimates and unadjusted fruit yield means showed different top-ranking genotypes in five of the seven locations tested. Based on unadjusted means, six of 13 genotypes (D, F, G, H, N, and R3) “won” in at least one environment; however, according to AMMI1 estimates, there were three winners: genotypes G, H, and I (Tab. 4). The genotypes G and I were the best genotypes for ME1, and their performance was better compared to the three regional controls. The genotype H was the genotype with the highest performance for ME2 and superior to the three regional controls. Additionally, genotypes D and B presented the PC1 scores closest to zero, suggesting that they were the most stable genotypes (Fig. 1). However, only genotype B showed a mean yield higher than 26 t ha-1; its yield was similar to that of Colombia ecotype (genotype N) in La Unión, Rionegro, San Vicente, and Mosquera and its yield was higher in Pasto and La Union. This high-yielding genotype was the most stable in all the locations evaluated, which indicates a broad adaptation. Thus, genotype B can be recommended for planting in the locations of the departments of Cundinamarca, Antioquia, and Nariño. The genotype B and genotypes G, I, and H could contribute significantly to the economic growth of the country's producing regions and maintain Colombia's position as the leading producer of cape gooseberry worldwide and, above all improve the quality of life of small farmers. Also, these could potentially be used in other countries with similar climatic conditions.
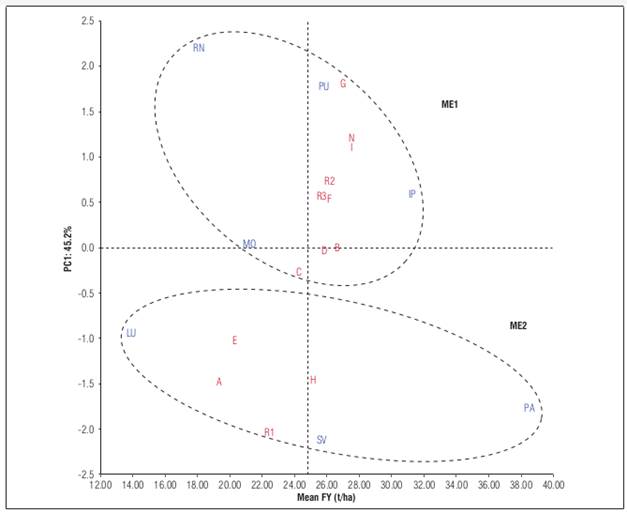
Figure 1. AMMI1 biplot fruit yield (FY) vs. PC1 of 13 cape gooseberry genotypes grown in seven locations.
The most unstable genotypes were G, H, I, N, A, and R1. The genotypes G, H, I, and N, as mentioned above, exhibited high yield, whereas R1, A, and E were among the lowest yielding ones. The genotype R1, used as a regional control of the Cundinamarca department, presented low yields in ME1 and its mean yield was 19.5 t ha-1. The regional control of Antioquia (genotype R2) and Nariño (genotype R3) had a lower performance than genotype N, except in Pasto. The Cundinamarca regional control (genotype R1) showed low adaptation to Mosquera environmental conditions in comparison with the other genotypes, although this material has traditionally been cultivated in this department. The regional controls R2 and R3 had good yields, but these were lower than those of genotypes I, N, G, B, and H.
For fruit weight, the AMMI analysis identified only one mega-environment, but the Ipiales locality was far from the other locations that made up the mega-environment (Fig. 2). Ipiales locality showed the higher fruit weight followed by Pasto and Puerres of Nariño department, indicating that Nariño department is suitable environment to fruit weight. In contrast, Rionegro, La Union and San Vicente showed the smallest fruit weights and Mosquera exhibited fruits with intermediate weight. This suggest that locations with altitudes above 2,500 m a.s.l. and temperatures between 12 and 15°C stimulated production of heavier fruits, as was the case in the locations of Nariño. Similar results were reported by Angulo (2005), who observed that fruits developed in low altitude regions were lighter than those from higher altitudes, directly affecting fruit yield. Likewise, Mazorra et al. (2003) found that to low altitude, the fruits of cape gooseberry were smaller than high altitudes.
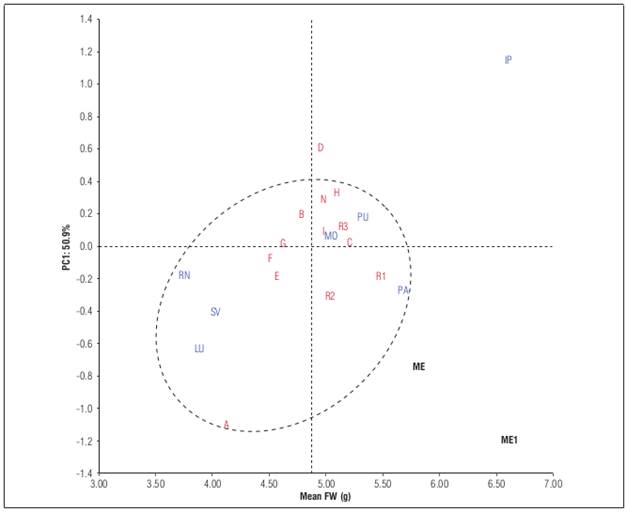
Figure 2 AMMI1 biplot fruit weight (FW) vs. PC1 of 13 cape gooseberry genotypes grown in seven locations.
In the same way that fruit yield, the selection of winner genotypes for fruit weight was realized based on AMMI estimates. According to this, two genotypes were the winners: genotypes D and R1 with 4.9 and 5.5 g (Tab. 5). The genotype D showed an adaptation for Ipiales while the genotype R1 for the mega-environment conformed by Puerres, Mosquera, Rionegro, Pasto, San Vicente, and La Union. However, the genotype R1 was one of the lowest fruit yielding genotypes with only 22.5 t ha-1. The stable genotypes were G and C; while the unstable were D and A. The genotype A exhibited low fruit weight with 4.2 g, but genotype D exhibited a fruit weight higher of the average. The high yielding genotypes G, and B had a fruit weight below the average, suggesting that the fruit yield was a result of the number of fruits and not their weight. Conversely, the genotypes I, and H with good fruit yield and adaptation to ME1 and ME2, respectively, showed a fruit weight above average and similar to national and regional controls. Similar results have been reported by Mendoza et al. (2012), who found an average of fruit weigh of 4.7 g in different farms of Cauca, demonstrating that the fruit satisfies with the national and international standards.
Table 5. AMMI1 estimates (top line) with their rank (in parenthesis) and unadjusted means (bottom line) for fruit weight (g) of 13 cape gooseberry genotypes grown over seven locations.
| Environment (E) | Mean E | Genotype (G) | |||||||||||||
|---|---|---|---|---|---|---|---|---|---|---|---|---|---|---|---|
| A | B | C | D | E | F | G | H | I | N | R1 | R2 | R3 | |||
| ME1 | IP | 6.6 a | 4.6 (13) 4.6* | 6.7 (8) 7.0 | 7.0 (6) 6.7 | 7.4 (1) 7.3 | 6.1 (12) 6.0 | 6.1 (11) 6.4 | 6.3 (10) 6.2 | 7.2 (2) 7.3 | 6.8 (7) 6.6 | 7.1 (3) 7.1 | 7.0 (4) 7.0 | 6.5 (9) 6.5 | 7.0 (5) 7.0 |
| PU | 5.3 c | 4.4 (13) 4.6 | 5.3 (9) 4.7 | 5.6 (2) 5.6 | 5.5 (7) 6.0+ | 5.0 (11) 5.3 | 4.9 (12) 4.7 | 5.0 (10) 5.5 | 5.6 (3) 5.3 | 5.5 (8) 5.5 | 5.5 (5) 5.4 | 5.9 (1) 6.0 | 5.5 (6) 5.0 | 5.6 (4) 5.5 | |
| MO | 5.0 d | 4.3 (13) 4.1 | 5.0 (9) 4.6 | 5.4 (2) 5.8 | 5.1 (8) 4.9 | 4.7 (11) 4.8 | 4.7 (12) 4.4 | 4.8 (10) 4.6 | 5.3 (3) 5.5 | 5.2 (7) 5.8 | 5.2 (6) 4.9 | 5.6 (1) 5.3 | 5.2 (5) 5.5 | 5.3 (4) 5.3 | |
| RN | 3.7 f | 3.2 (13) 3.0* | 3.6 (9) 3.6 | 4.0 (2) 4.0 | 3.6 (8) 3.4 | 3.4 (10) 3.2 | 3.3 (12) 3.3 | 3.4 (11) 3.4 | 3.9 (5) 3.8 | 3.8 (6) 3.9 | 3.8 (7) 3.9 | 4.4 (1) 4.6 | 4.0 (3) 4.2 | 3.9 (4) 3.7 | |
| PA | 5.6 b | 5.2 (13) 5.0 | 5.5 (8) 5.7 | 5.9 (2) 6.1 | 5.5 (9) 5.3 | 5.4 (10) 5.5 | 5.3 (12) 5.3 | 5.3 (11) 5.3 | 5.8 (5) 5.4 | 5.7 (6) 5.3 | 5.7 (7) 5.8 | 6.3 (1) 6.7 | 5.9 (3) 6.0 | 5.8 (4) 6.1 | |
| SV | 4.0 e | 3.7 (11) 3.8 | 3.8 (8) 4.0 | 4.3 (3) 4.1 | 3.7 (10) 3.8 | 3.8 (9) 3.6 | 3.6 (13) 3.8 | 3.7 (12) 3.8 | 4.1 (5) 4.1 | 4.0 (6) 3.9 | 4.0 (7) 3.9 | 4.7 (1) 4.6* | 4.3 (2) 4.1 | 4.1 (4) 4.2 | |
| LU | 3.9 ef | 3.8 (7) 3,9 | 3.6 (10) 3.7 | 4.1 (3) 3.8 | 3.5 (13) 3.6 | 3.7 (9) 3.7 | 3.5 (12) 3.8 | 3.5 (11) 3.5 | 3.8 (6) 4.0 | 3.9 (5) 3.8 | 3.8 (8) 3.6 | 4.6 (1) 4.4* | 4.2 (2) 4.3 | 4.0 (4) 3.9 | |
| Mean ME1 | 4.6 | 4.1 | 4.5 | 4.9 | 4.5 | 4.3 | 4.2 | 4.3 | 4.7 | 4.7 | 4.6 | 5.2 | 4.9 | 4.8 | |
| Mean G | 4.9 | 4.2 | 4.8 | 5.2 | 4.9 | 4.6 | 4.5 | 4.6 | 5.1 | 5.0 | 5.0 | 5.5* | 5.1 | 4.9 | |
*Significant according to Dunnett's test at 5% level (control genotype N); +Significant according to Dunnett's test at 5% level (control genotypes R1, R2, and R3 of Cundinamarca, Antioquia, and Nariño departments, respectively). Locations with the same letter are not significantly different according to Tukey test. Locations: RN: Rionegro; PU: Puerres; IP: Ipiales; MO: Mosquera; LU: La Union; PA: Pasto; SV: San Vicente.
The fruit yield and fruit weight are critical traits to select genotypes for commercial plantation. Considering both traits, AMMI1 analysis revealed that genotype I can be recommended for planting in ME1 conformed by Rionegro, Puerres, Ipiales and Mosquera, genotype H for ME2 conformed by La Union, Pasto and San Vicente, and genotype B can be planting for both ME1 and ME2 due to stable performance in fruit yield, although it has a slightly smaller fruit that genotypes I and H. The locations from Nariño department were top environments with high yield and fruit weight of cape gooseberry.
CONCLUSION
Significant differences among genotypes, environments, and G×E interactions were found in this study. The AMMI1 analysis simplified and enable the identification and selection of potential genotypes of cape gooseberry with high yield and fruit weight for two mega-environments with specific and abroad adaptation. Besides, the analysis identified suitable environments for cape gooseberry crops according to the evaluated traits.

