


 Inglês (pdf)
 Artigo em XML
 Referências do artigo
 Enviar este artigo por email
 Citado por SciELO
  Citado por Google
  Similares em
SciELO
Similares em
SciELO  Similares em Google
 Permalink
Introduction
Modern growth theory identifies R&D as innovation tout cours. In fact, the Neo Schumpeterian tradition à la Aghion-Howitt (Aghion and Howitt, 1998) indigenizes the technical progress through a relation between new products discovery and R&D activity.
Nevertheless, the empirical literature has provided large evidence that R&D is only part of the overall innovation expenditure (Mohnen and Roller, 2005; Mairesse and Mohnen, 2004 for evidence using Community Innovation Survey data). On the one hand, the global markets and the recent advances in science and technology make very difficult for a firm to rely only on internal sources (Arora and Gambardella, 1990; Cassiman and Veugelers, 2006). On the other hand, there is a large group of industries that perform innovative efforts through acquisition of know-how, adoption of capital embodied technology and incremental and no formalized process innovation. This latter statement goes back to the very origin of the economics of innovation and the possibility to classify industries according to their technological trajectories (Bogliacino and Pianta, 2013; Dosi, 1988; Pavitt, 1984).
Allowing for complex interactions among innovation activities raises a set of related questions. If we can speak of knowledge production function in the same way in which standard economics deal with activity analysis, can we speak of complementarity/ substitutability relationships?
As an example, some contributions put forth the hypothesis of absorptive capacity (Leiponen, 2005; Griffith et al., 2003; Cohen and Levinthal, 1990), stressing the key role of R&D labs in the absorption of knowledge produced elsewhere. In other words, engaging in some research activity generates internal capabilities that can be exploited to learn or imitate the codified knowledge available for sale (or through spillover) on the market.
We talk about complementarity whenever the return on one input is increased by the contemporaneous adoption of other activities. Generally speaking, these properties are local, in the sense that they may not work everywhere in the domain of the activities space. As an example, there can be threshold effects: complementarity holds only once a certain level of use of some of the inputs is implemented. Topkins (1998) and Milgrom and Roberts (1995) provide a full characterization of these properties using the theory of supermodular functions on lattice structures.1
Recently the issue of complementarity has been raised for environmental friendly innovation. Given the urgency of reducing Carbon Dioxide emissions due to the threat of Global Warming, the issue of complementarity has a strong policy relevance to achieve the required targets (Mazzanti and Zoboli, 2009 and 2008).
Econometrically, testing for complementarity in this general approach poses a series of empirical problems, starting from the need of an explicit measure of performance, which may not be available in innovation surveys. This is precisely the kind of problem we have to face with the Colombian data from the Segunda Encuesta de Desarrollo e Innovación Tecnológica (Second Innovation Survey). In the literature, most of the scholars have relied on indirect measures. Although we follow this line of research, one of the main novelty of this work is the use of a more general approach, based on a Tobit I system.
Complementarities are important from a policy perspective. If firms are not able to internalize them, inefficiencies arise: as in the case of any positive externality, economic agents tend to underinvest. Managerial slackness, lack of proper organizational practices scarce information circulation in compartmentalized large firms may be reason behind difficulties to capture these externalities.
This paper proceeds as follows: Section II discusses Data and Methodology, Section III presents the results, Section IV concludes.
DATA AND METHODOLOGY
We use data from the Segunda Encuesta de Desarrollo y Innovación Tecnológica, an innovation survey over 6670 Colombian manufacturing firms. For each company, the survey collects information over innovative expenditure in 2003 and 2004. The Survey design is based on the Manual de Bogotá (2001), an adaptation of the Oslo Manual (OECD 2005). The expenditure is deflated using the GDP Deflator (taken from the Colombian Statistical Office, the DANE) using as a base year the 2003.
We consider four innovation inputs: R&D, licensing, Information and Communication Technology (ICT) expenditure, and capital embodied technology (CET) acquisition. In Figure 1 and Figure 2 we plot the distributions of the variables in the two years. The pattern is quite striking: as can be seen there is a density mass in zero, given by a large number of firms without any expenditure; secondly, there is a relatively large support of the distribution. The pattern is qualitatively similar across types of expenditure and within years.
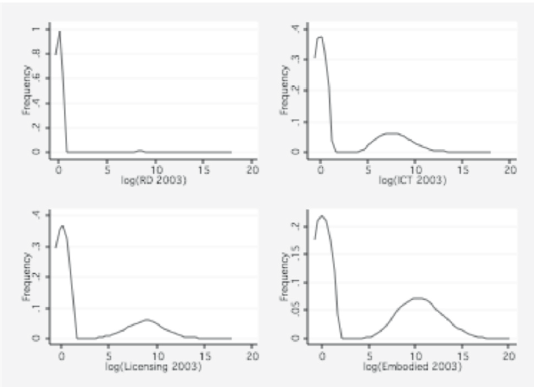
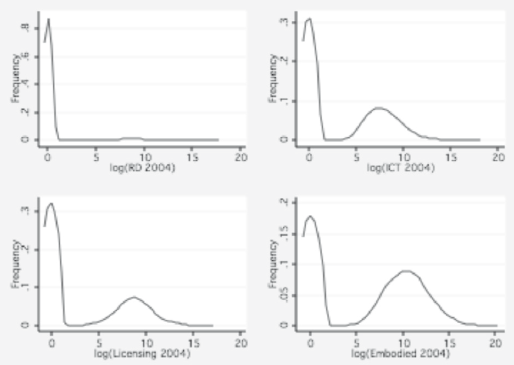
In order to use log demand without introducing selection bias, we perform the following data transformation: we let the demand equal to zero whenever the expenditure is null and equal to the log of the expenditure whenever the latter is positive (there are no “1” value, so there isn’t induced measurement error).
There are two different approaches to empirically test for complementarity (for a general discussion see Catozzella and Vivarelli, 2007): a direct approach and an indirect approach.
The direct approach is based on the idea that the simultaneous adoption of different inputs should prove to be more valuable than adopting each one individually. Empirically, it can be assessed through the estimation of the effect of alternative combinations of inputs over some measure of economic performance. This is equivalent to identifying the effect of the (cross) second derivative. We can write a system of inequalities and test it. It is computationally demanding but feasible with the proper data (Lokshin et al., 2004; Catozzella and Vivarelli, 2004).
Given the difficulties related to the direct approach, most authors use an indirect one. They test the implications of complementarity instead of complementarity itself. In fact, if the latter holds firms will at least partly internalize it and ceteris paribus demands will move together. The advantage of this method is that we do not need a measure of payoff. Econometrically, some authors use cluster techniques (Athey and Stern, 1998), other ones propose a correlation analysis (Arora and Gambardella, 1990).
In this article we follow the indirect approach. The rationale behind this choice is the lack of economic performance measure in Colombia’s Innovation Survey.
To assess co-movements among innovative input demands, we calculate the unconditional correlations, as a first measure, and the robust conditional correlations, i.e. controlling for all the observable characteristics of the firm and of the environment. To compute the residuals, we directly estimate the system of input demands (for four innovative inputs), keeping into account the potential corner solutions and accommodating cross-equations restrictions.
There are two basic econometric issues to face. First of all, the investment is highly persistent in the period covered by the analysis. Regressing the 2004 value over the one for the previous year, we get very high coefficients, as shown in Table 1. This is consistent with the evidence of firm level investment and the existence of financial frictions (Holt, 2003). Its time profile is thus not continuous. For our analysis there are two possibilities: either using the lag of the expenditure variable as a regressor or considering the total amount spent over the two years.
Table 1 Persistence in Expenditure Variables
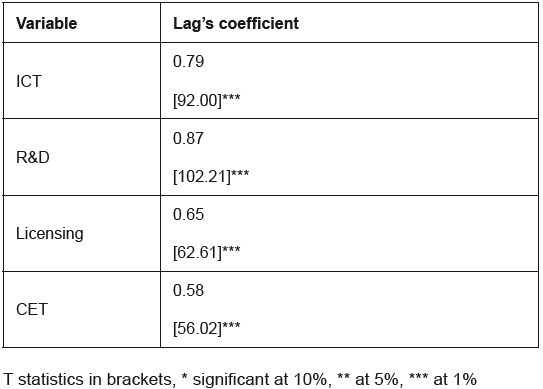
Fuente: Segunda Encuesta de Desarrollo e Innovación Tecnológica
The first option ends up not being viable: since we have just one point in time for all variables (except for the expenditure ones), we cannot control for unobserved heterogeneity, so the lag is potentially endogenous. Moreover, since we are in presence of corner solutions models, we need to use nonlinear models. For the latter, identification require sequential exogeneity of the repressors. We decided to run test of exogeneity, using a simple two steps procedure illustrated in Woolridge (2002), which is strongly confirmed;2 so we proceed using the total amount spent. We transfer all the money to 2003, using a nominal interest rate at 1 year.
The second issue is that the demands for the various inputs have to be estimated jointly: we have to write a system of non-linear equations, since the corner outcome at zero require a Tobit I estimation. As one may think, writing a full simulated maximum likelihood program (SML) is going to pose major problem in terms of computational effort, and convergence may be very difficult. However, we know from Cameron and Trivedi (2005) that by maximizing the sum of the individual equation (quasi maximum likelihood, QML) we get consistent estimates of the Betas (allowing the computation of the residuals). Moreover, Barslund (2007) recently compares SML and QML for a demand system (using Monte Carlo simulations): his finding point out that the former never provides a statistically significant improvement. For these reasons, we proceed by estimating the full system with QML, then computing the residuals and finally calculating the correlation matrix.
After a careful revision of the literature we use the following battery of controls:
The share of graduated workers, the share of workers with some college, the share of workers with secondary education or less as a measure of skills and capabilities (Piva and Vivarelli, 2009).
The foreign share of capital (which controls for multinational), a dummy for large firms (more than 250 employees) as a measure of scale effects (Cohen and Levin, 1989).
A set of dummies for hampering factors declared by the firm (Crépon et al. 1998);
The rate of change of value added at three digits CIIU3 (for both 2002-2003 and 2003-2004)4, to control for demand pull effects (Piva and Vivarelli, 2007; Kleinknecht and Verspagen, 1990; Scherer, 1982).
A dummy for firms that innovate under cost pressures, as a measure of technology push driver (Mowery and Rosenberg, 1979).
Finally, a dummy for the source of innovation (equal to one if the idea comes from an internal department).
RESULTS
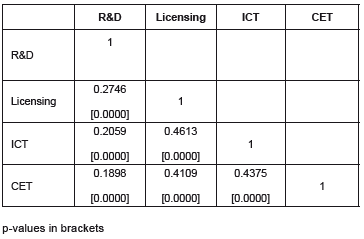
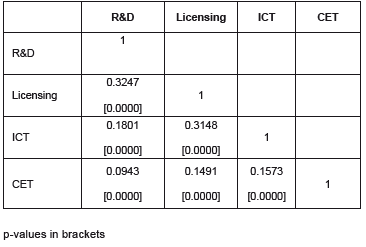
In Table 2 and Table 3 we report the unconditional and conditional correlation matrices, respectively.
Table 2 Unconditional Correlation Analysis
Fuente: Segunda Encuesta de Desarrollo e Innovación Tecnológica
Table 3 Conditional Correlation Analysis
Fuente: Segunda Encuesta de Desarrollo e Innovación Tecnológica
The results suggest two main conclusions: on the one hand, there is the strong correlation between licensing and R&D, which we interpret as empirical evidence for absorptive capacity (e.g. without a lab it is difficult to manage a patent); on the other side, we underline that the ICT is correlated with all inputs, and show the largest coefficients, which suggests that investing on new technologies can help manage other innovative inputs.
At the same time, the poor but positive correlation between R&D and CET is certainly driven by the contrasting effect between the make or buy decision (from one point of view CET is an alternative to internal research) and the complementarity between the lab machinery and R&D.
The above results suggest that innovation policies should be multifaceted and especially focused on supporting research activities and adoption of ICT.
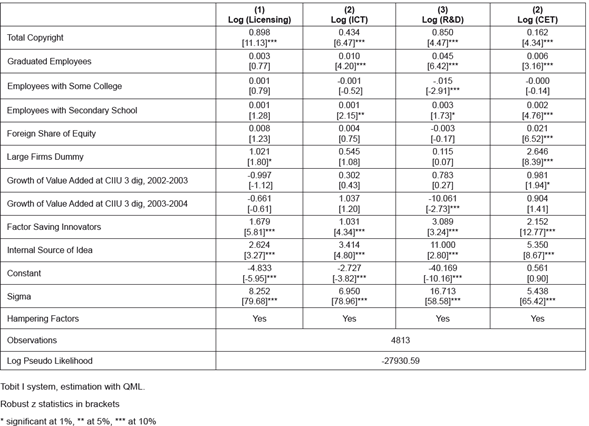
Table 4 reports the full system. Regarding this last one, it should be stressed how firms with formalized innovation (captured through the copyright measure) invest more in all inputs. Human capital impacts significantly over three of the four inputs. Size and multinational dimension seem to impact only on CET expenditure, probably reflecting the general feature of the Colombian Industrial structure, where R&D and other more “make” choice of innovation are likely to be less important.
Conclusions
In this paper we show how to assess complementarity in the knowledge production function when data do not provide performance measure. This approach can be very important in dealing with Latin American Innovation Surveys that still suffer some limitations.
Our identification strategy follows a new approach; we assess complementarity through an indirect approach based on the estimation of the demand system, using a QML estimator, which is both robust and computationally cheap.
Our results stress a significant role played by ICT in driving innovative effort and the role of R&D as absorptive capacity.
Through the identification of the complementarity relationships, this framework allows a deeper exploration of the effects of public interventions and subsidies. In fact, most of the literature considers additionally versus crowding-out in a pure unidimensional input perspective without considering neither the possible interrelationships between different inputs nor the relationship between input and output (Catozzella y Vivarelli, 2011).

