


Serviços Personalizados
Journal
Artigo
 Inglês (pdf)
 Artigo em XML
 Referências do artigo
 Enviar este artigo por email
Indicadores
-
 Citado por SciELO
 -
 Acessos
Links relacionados
-
 Citado por Google
 -
 Similares em
SciELO
Similares em
SciELO -
 Similares em Google
Compartilhar

 Permalink
Earth Sciences Research Journal
versão impressa ISSN 1794-6190
Earth Sci. Res. J. vol.18 no.1 Bogotá jan./jun. 2014
https://doi.org/10.15446/esrj.v18n1.34048
http://dx.doi.org/10.15446/esrj.v18n1.34048
HYDROGEOLOGY
Hydrogeochemistry and Quality Assessment of Shallow Groundwater in the Southern Part of the Yellow River Alluvial Plain (Zhongwei Section), Northwest China
Peiyue Li*, Jianhua Wu, Hui Qian
School of Environmental Science and Engineering, Chang'an University, No. 126 Yanta Road, Xi'an, 710054, China. Key Laboratory of Subsurface Hydrology and Ecological Effect in Arid Region of the Ministry of Education, Chang'an University, No. 126 Yanta Road, Xi'an, 710054, China.
* Email: peiyueli@chd.edu.cn, Fax: 86-29-82339952, Tel: 86-29-82339327
Record
Manuscript received: 18/10/2012 Accepted for publication: 29/04/2014
ABSTRACT
Statistical analyses, a Piper diagram, the saturation index and the correlations of chemical parameters were used to reveal the hydrogeochemistry and hydrogeochemical evolution of shallow groundwater in the southern part of the Zhongwei section of the Yellow River alluvial plain. The water quality for agricultural and domestic uses was also assessed in the study. The results suggest that the shallow groundwater in the study area is fresh to moderately mineralized water. Higher Ca2+ and HCO3- are observed in the less mineralized water, whereas Na+ and SO42- are common ions in the highly mineralized water. The major hydrochemical facies for groundwater with total dissolved solids (TDS) <1 g/L are HCO3-Ca·Mg and HCO3-Ca·Na·Mg, and for groundwater with TDS > 1 g/L, SO4 ·Cl-Na and SO4·Cl-Na·Mg·Ca are the predominant hydrochemical types. The main reactions in the groundwater system are the dissolution/precipitation of gypsum, fluorite, halite, calcite and dolomite. Cation exchange is also important in controlling the groundwater chemistry. The water samples assessed in the paper are of acceptable quality for agricultural use, but most of them are not fit for direct human consumption (drinking). TDS, total hardness (TH), Cl- and SO42- are the main indices that result in the poor drinking water quality.
Keywords: hydrogeochemical characteristics; groundwater protection; hydrochemistry; water-rock interaction; groundwater.
RESUMEN
Análisis estadísticos, un diagrama de Piper, el índice de saturación y la correlación de los parámetros químicos fueron utilizados para revelar la hidrogeoquímica y la evolución hidrogeoquímica de las aguas subterráneas poco profundas en la parte sur de la sección Zhongwei en la planicie aluvial del río Amarillo. La calidad del agua para el uso doméstico y agrícola también fue evaluada en este estudio. Los resultados sugieren que las aguas subterráneas poco profundas en el área de estudio son entre frescas y moderadamente mineralizadas. Un índice mayor de Ca2+ y HCO3- se observó en las aguas menos mineralizadas, mientras que Na+ y SO42- son iones comunes en las aguas altamente mineralizadas. Los perfiles hidroquímicos predominantes para las aguas subterráneas con Total de Sólidos Disueltos (TDS) <1 g/L son HCO3-Ca·Mg y HCO3-Ca·Na·Mg, y para las aguas subterráneas con TDS >1 g/L, SO4·Cl-Na y SO4·Cl-Na·Mg·Ca. Las mayores reacciones en el sistema de aguas subterráneas son la disolución/precipitación de yeso, fluorita, halita, calcita y dolomita. El intercambio de cationes también es importante en el control de la química de las aguas subterráneas. Las muestras de agua evaluadas en este manuscrito son de calidad aceptable para el uso agrícola, pero la mayoría no son aptas para el consumo humano. El índice TDS, la dureza total del agua (TH), Cl- y SO42- son las razones principales que influyen en la baja calidad de esta agua.
Palabras clave: Características hidrogeoquímicas; protección de aguas subterráneas; hidroquímica; interacción agua-roca; aguas subterráneas.
Introduction
Groundwater is an important source of fresh water for domestic, agricultural and industrial uses in China, especially in North China and Northwest China, where surface water is scarce (Wang et al. 2007). Compared to deep groundwater, shallow groundwater is much easier to exploit, but it is more vulnerable to pollutants, and its quality is more easily influenced by natural water-rock interactions and anthropogenic activities. Thus, shallow groundwater requires more attention and protection. Shallow groundwater underneath the alluvial plain is usually of good quality because it usually receives large amounts of recharge from the rivers. However, the aquifers underlying the alluvial plain are usually composed of coarse sand and gravels, which not only enables the groundwater to flow quickly through the pores but also allows pollutants to travel easily through the aquifers. A small disturbance from natural processes or human activities can easily change the chemical constituents and quality of shallow groundwater. Therefore, the understanding of the hydrogeochemical evolution and water quality status is a key component in addressing effective protection measures and implementing sustainable management of shallow groundwater beneath alluvial plains.
The investigation and assessment of groundwater chemistry and quality is a hot topic worldwide, triggering international attention from both researchers and policy makers due to its relevant link with environmental objectives and regional development. Groundwater chemistry has been extensively studied, and a great deal of literature can be found in various scientific journals and databases. These previous investigations have involved many different hydrogeological and hydrogeochemical methods and techniques, including multivariate statistics, major solute analyses, stable oxygen and hydrogen isotope analyses and groundwater geochemical modeling. For example, Reghunath et al. (2002) studied the interaction of river water with adjacent groundwater and the mixing/non-mixing of different types of groundwater in the Nethravathi catchment (India) using multivariate statistical techniques. Similarly, Menció and Mas-Pla (2008) used principal component analysis (PCA) and cluster analysis (CA) to determine surface water origins and interactions with groundwater in Mediterranean streams. Guo and Wang (2005) researched the geochemical characteristics of shallow groundwater in the Datong Basin. Xu et al. (2010) measured major ion concentrations in various waters around the Lake Qinghai catchment and identified the major factors influencing their chemical characteristics. Isotopic and geochemical modeling techniques are rapidly becoming widely used in the study of groundwater chemistry and groundwater cycling. Li et al. (2010a) investigated the geochemical processes of groundwater in the southern plain area of Pengyang County using a geochemical modeling approach. Qian et al. (2007) used hydrogen and oxygen isotopes to study the dynamics of groundwater and surface water. The evaporation fraction was also calculated in their study by hydrogen and oxygen isotopes. Kanduč et al. (2012) investigated the spring water chemistry and carbon cycling of Alpine springs in Slovenia using stable isotopes. All these existing studies have provided useful instructions for groundwater protection.
The shallow groundwater in the Yellow River alluvial plain is a regional strategic resource for sustainable economic development. For better management of the groundwater resources, it is necessary and important to study the groundwater characteristics and hydrogeochemical processes. However, the shallow groundwater in the Yellow River alluvial plain (Zhongwei section) is rarely investigated because there are no large cities, only small towns and villages. The struggling economy has resulted in few government investments, and therefore no funds have been arranged to support environmental studies. In recent years, with the increased awareness of groundwater protection, the local government has been trying to change this situation and provide some economic support to perform various studies related to the water environment. For example, Wu et al. (2014) performed an investigation of soil salinization in this area, and they related secondary soil salinization to irrigation and groundwater quality. The purposes of the present study are (1) to investigate the hydrogeochemistry and geochemical evolution of shallow groundwater and (2) to assess the groundwater quality for drinking and agricultural uses. The study will be extremely important and useful in regional groundwater protection and management.
Study Area
Location and climate
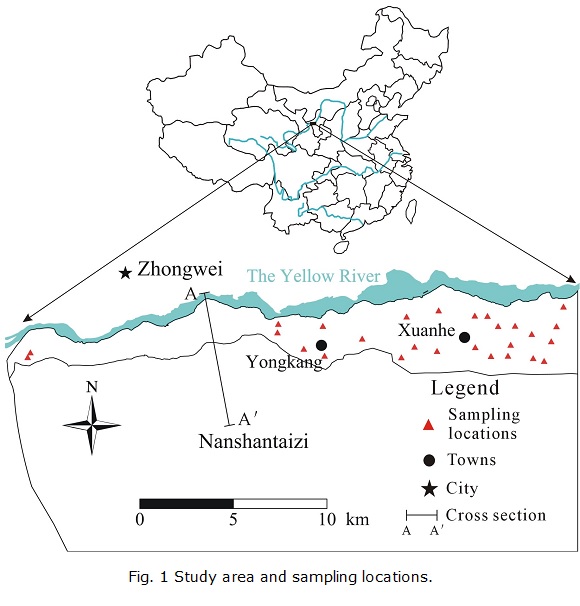
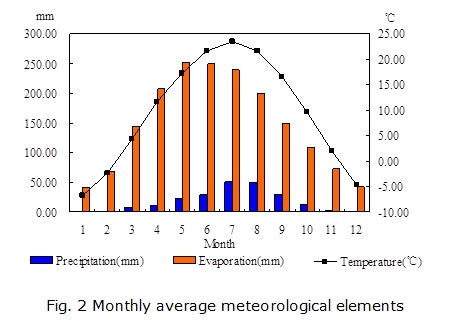
The study area is a part of the Yellow River alluvial plain. It is located to the south of the Yellow River, between longitudes 105°09'05'' to 105°29'55''E and latitudes 37°22'22'' to 37°30'06''N, covering an area of 79.28 km2. The location of the study area is shown in Fig. 1. The Yellow River, the main surface water body primarily used for irrigation, runs through the area along the northern boundary. Zhongwei city, to the north of the area, is the economic and cultural center of the area. Nanshantaizi, composed of Quaternary alluvial and pluvial deposits, lies to the south of the study area. Located in a semi-arid area, the study area is characterized by scant precipitation, strong winds in the winter, and high temperatures and intense evaporation in the summer. According to the data from the Zhongwei weather station, the multi-year average temperature is 9.37°C in the area. The highest and lowest temperatures are usually observed in January and July, respectively. The multi-year mean precipitation is 185.18 mm, with the majority (72%) falling between June and September (Fig. 2). The mean evaporation of the area is 1774.25 mm, and over 73% of the annual evaporation occurs between April and September.
Geology
The study area lies within a fault-formed basin. The occurrence and distribution of groundwater in the area are controlled by geologic structures. Thebasin belongs to the Cenozoic Zhongwei-Chenmajing depression zone. Pluvial and piedmont deposits formed the Red Tertiary clasolite underlying the Quaternary deposits. According to borehole data, the Quaternary deposits can be over 130 m in thickness, comprising sands and gravels interbedded with loess-like clayey sands. The lower part of the Quaternary deposits forms a phreatic aquifer or semi-confined aquifer. The neotectonic movement in the area has been intense. The Nanshantaizi is rising relative to the alluvial plain. The elevation of the front zone of Nanshantaizi is 100 m higher than that of the alluvial plain. The underlying Tertiary formations contain fissure water, but the groundwater is poor in quality and not suitable for use. The alluvial plain is composed of gravels and sands, which are good groundwater-bearing formations. Calcite, dolomite, fluorite, gypsum and halite are common minerals in the aquifer media of the plain.
Hydrogeology
Since the Quaternary, a thick pile of loose sediments has been deposited in the area, forming good water-bearing formations. From the top down, Holocene and Pleistocene deposits are observed as per the borehole data, and they constitute the phreatic aquifer and confined aquifer.
The phreatic aquifer in the alluvial plain was formed by Holocene (Q4al) and Late Pleistocene (Q3al) alluvial deposits. The thickness of the phreatic aquifer can reach over 50 m (Fig. 3). This aquifer is the most important water supply in the area and is characterized by a broad and stable aquifer distribution, shallow groundwater table, good water quality and abundant water yield. According to field investigations, the groundwater depth in general is 0.11-4.99 m, and the TDS content in most areas is lower than 1 g/L. High-salinity water is observed along the front zone of Nanshantaizi.
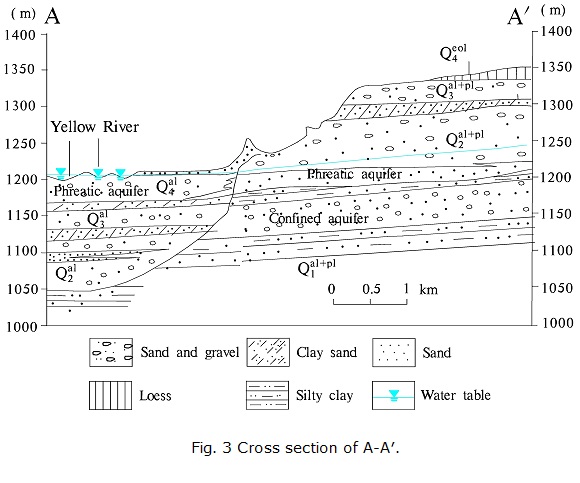
The confined aquifer in the alluvial plain is composed of alluvial sands and gravels from the Middle Pleistocene (Q2al). This aquifer is rarely used because its distribution is not stable and its depth is too great. The thickness of the confined aquifer is within the range of 18.85-67.38 m.
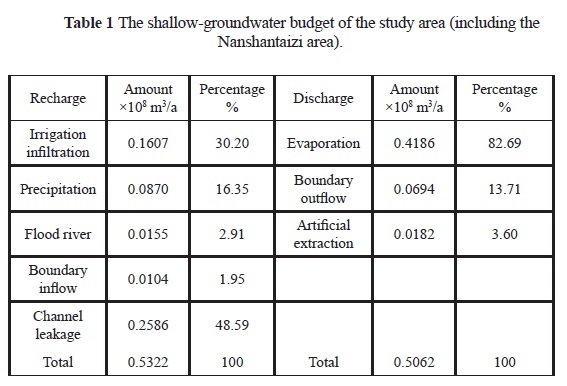
The shallow groundwater flows in general from south to north and from west to east, influenced by topography and artificial irrigation over the Nanshantaizi area. The Yellow River water is diverted by pipes and channels to Nanshantaizi for agricultural uses, after which it infiltrates into the aquifer and flows back to the alluvial plain. During the diversion, a large amount of water percolates into the phreatic aquifer through channel leakage. A water budget of the area (including the Nanshantaizi) during the period of September 2009 to August 2010 was calculated. The total recharge of the period is 0.5322x10⁸ m3, and the channel leakage and irrigation infiltration account for over 75% of the total recharge (Table 1). Precipitation is also an important recharge of the aquifer, although the annual precipitation is less than 200 mm in the area. Groundwater is mainly discharged by evaporation and as boundary outflow during the period; artificial extraction only represents a small proportion (less than 4%). This small amount of extracted groundwater is used mostly for drinking and irrigating vegetables in the inhabitants' gardens.
Materials and Methods
Data collection and analysis
For this work, a total of 27 shallow groundwater samples (NW1, NW2, and NW4 to NW28) and 1 Yellow River water sample (NW3) were collected in August 2010. All groundwater samples were collected from hand-pumped wells at depths of 8-12 m. The sampling locations are shown in Fig. 1. Most of the samples are located in the eastern portion of the study area, and only two samples were collected from the western portion because most villages are located in the east. Samples were collected in 5 L white plastic bottles. Prior to sampling, the containers were washed three times with the water to be sampled. After the collection, the containers were labeled for identification and brought to the laboratory. During sample collection, handling, and preservation, standard procedures recommended by the Chinese Ministry of Water Resources were followed to ensure data quality and consistency.
The groundwater samples were analyzed in the laboratory of the Ningxia Geo-Environmental Monitoring Station. All samples were analyzed for Total Dissolved Solids (TDS), pH, total hardness (TH), and major ions, including sodium (Na+), potassium (K+),calcium (Ca2+), magnesium (Mg2+), sulfate (SO42-), chloride (Cl-), carbonate (CO3 2-) and bicarbonate (HCO3-). Certain trace constituents, such as free carbon dioxide (CO2), total solubleiron (TFe), nitrate-nitrogen (NO3--N), ammonia-nitrogen (NH4+-N), nitrite-nitrogen (NO2--N), fluoride (F-), and metasilicic acid (H2SiO3), were also analyzed. Among the analyzed parameters, Na+ and K+ were determined by using a flame photometer. Ca2+, Mg2+, HCO3-, and Cl - were analyzed with the titrimetric method, and Fe was analyzed with an atomic absorption spectrophotometer. The pH and electrical conductivity (EC) were measured in situ.
After physiochemical analysis, the accuracy of the analysis results was checked via charge balance. Generally speaking, the relative error should be within ±5%, i.e., . The results suggest that the maximum relative error is 4.56%, which is within the acceptable error limit. The analysis results are accurate and can be used for the study.
Saturation index
The saturation index (SI) is a widely used indicator in hydrogeochemical studies. The geochemical program PHREEQC (Parkhurst and Appelo 1999) was used to compute the saturation index (SI) of certain major minerals, including calcite, dolomite, fluorite and gypsum. When SI = 0, the minerals in the aqueous solution are in equilibrium. When SI < 0, the minerals in the aqueous solution are unsaturated and follow a dissolution trend, and when SI > 0, the supersaturated status of minerals in the aqueous solution causes deposition to occur (Li et al. 2010a). The saturation index (SI) is defined as
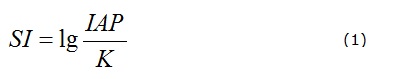
where IAP is the relevant ion activity product in a mineral dissolution reaction, which can be obtained by multiplying the ion activity coefficient γi and composition concentration mi; and K is the equilibrium constant of mineral dissolution at a certain temperature.
Irrigation water quality assessment
There are several methods for assessing irrigation water quality (Li et al. 2013a). The Sodium Adsorption Ratio (SAR) is likely the most popular metric used around the world. It is calculated from the ratio of sodium to calcium and magnesium (Fipps 2003). The equation is expressed as follows (Hakim et al. 2009):
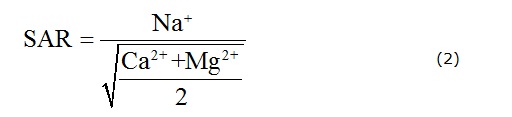
where all the ions are expressed in meq/L.
The Soluble Sodium Percentage (%Na) is also a useful indicator in determining the suitability of groundwater for agricultural uses. The parameter %Na is defined as the ratio of sodium to the total cations in meq/L (Li et al. 2010b). Water with a %Na value greater than 60% may result in sodium accumulations that will cause a breakdown in the soil's physical properties (Khodapanah et al. 2009). The index %Na is expressed as follows:
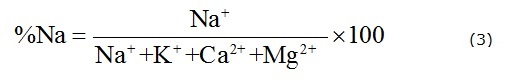
where all the ionic concentrations are expressed in meq/L.
Drinking water quality assessment
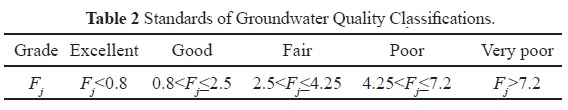
For drinking water quality assessment, the most common method used in China is the comprehensive water quality index method (CWQI), which is recommended by the Quality Standard for Groundwater of China (Bureau of Quality and Technical Supervision of China 1994). As per the standard, the groundwater is classified into five grades: excellent (grade I), good (grade II), fair (grade III), poor (grade IV), and very poor (grade V). The CWQI can be calculated using formulas (4) and (5). Groundwater with grades I and II is of excellent and good quality and is suitable for all uses. Grade III is fair-quality water, which is generally suitable for drinking, irrigation, and industrial production. Grade IV is poor-quality water, which is fit only for irrigation and industrial production and may be used for drinking after proper treatment. Grade V groundwater is very poor-quality water that cannot be used for any purpose.
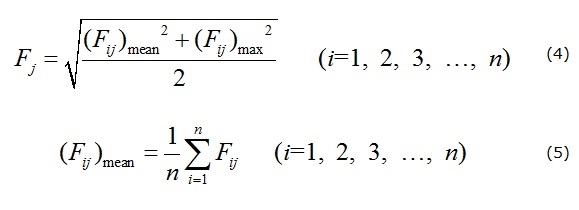
where Fj is the comprehensive evaluation value of sample j, Fij is the evaluation value of the ith index of the jth water sample, which can be determined as per the Quality Standard for Groundwater (Bureau of Quality and Technical Supervisionof China 1994). The term (Fij)mean represents the average value of Fij for n indices of the jth water sample, (Fij)max is the maximum value of Fij, and n is the numbers of index for sample j. Based on the calculated comprehensive evaluation value Fj, the groundwater quality is classified according to Table 2.
Results and Discussion
General hydrochemical characteristics
The analytical results of the physiochemical indices are shown in Table 3. Table 3 also lists the statistical analysis results. The TDS in the groundwater ranges from 539.75 to 2248.98 mg/L, indicating fresh to moderately mineralized water (Table 3). The EC of the groundwater is higher thanthat of the surface water, suggesting mineral dissolution in the groundwater. Among the mean ion concentrations, the main anion is HCO3 -, ranging from 213.69 to 609.65 mg/L, followed by SO42- and Cl-, with averages of 267.92 and 207.50 mg/L, respectively. The main cations are Na+ and Ca2+, with averages of 146.26 and 129.07 mg/L, respectively. The pH of the groundwater is within the range of 8.01 to 8.15, indicating an alkalescent tendency. The contents of TFe and F- are low, and both are within the permissible limits for drinking purposes. TH ranges from 363.10 to 1108.69 mg/L and is therefore categorized as hard or very hard water. No ammonia nitrogen and nitrate nitrogen pollution was detected, but local nitrite nitrogen pollution was observed. The coefficients of variation can reveal the spatial variability of ions. The statistical analysis results listed in Table 3 show that the EC possesses the highest coefficient of variation, suggesting it has a higher spatial variability than the other indices. The spatial variabilities of TDS, TH and HCO3- are also very high. The physiochemical analysis of the Yellow River water (NW3) was also included in Table 3 for comparison. The comparison reveals that most major indices of the surface water have lower values than those of the groundwater. This suggests that the water quality of the Yellow River water is better than that of the groundwater.
Tri-linear diagrams are perhaps the most commonly used technique for finding hydrochemical patterns in major ion data. In the present study, a Piperdiagram (Piper 1953) was used to understand the major hydrochemical facies (Fig. 4). These figures were drawn in Aq•QA® (RockWare, Inc. 2004). Fig. 4 reveals that Ca2+ is the predominant cation in groundwater with TDS < 1 g/L, followed by Na+ and Mg2+. For groundwater with TDS > 1 g/L, Na+ is the major cation, followed by Mg2+ and Ca2+. In groundwater with TDS > 1 g/L, the Na+ content is higher, but the Ca2+ content is lower compared to groundwater with TDS < 1 g/L. With respect to anions, HCO3- is predominant in groundwater with TDS < 1 g/L, but in groundwater with TDS > 1 g/L, SO42- and Cl- are the most prevalent anions. The main hydrochemical facies for groundwater with TDS <1 g/L are HCO3-Ca·Mg and HCO3-Ca·Na·Mg,and for groundwater with TDS > 1 g/L, SO4·Cl-Na and SO4·Cl-Na·Mg·Ca are the predominant hydrochemical types. The pH values of groundwater with TDS <1 g/L, in general, are lower than those of groundwater with TDS > 1 g/L. The Yellow River water possesses the lowest TDS among all collected water samples.
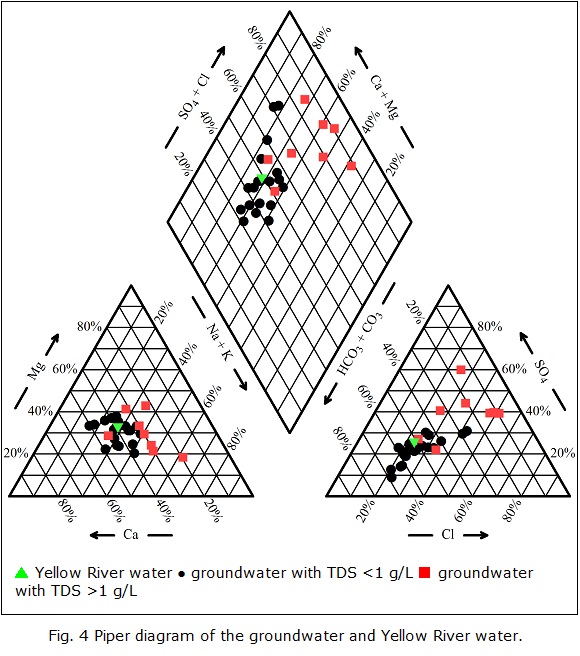
▴ Yellow River water • groundwater with TDS <1 g/L ▪ groundwater with TDS >1 g/L
Saturation index
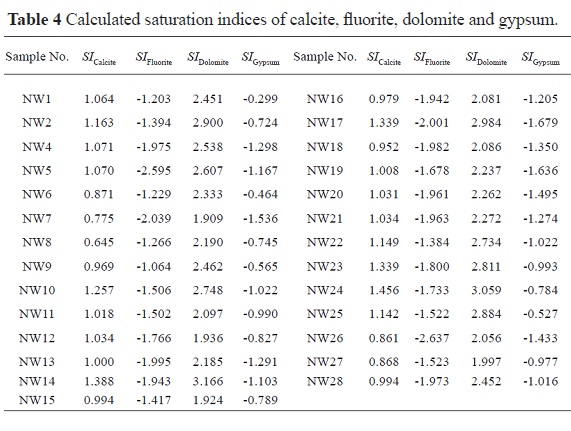
The saturation indices for gypsum, fluorite, dolomite and calcite were calculated with PHREEQC (Parkhurst and Appelo 1999). The calculation results are listed in Table 4. The SI values of calcite and dolomite for all groundwater samples are greater than zero (Table 4), indicating oversaturation and potential precipitation of these carbonate minerals. In contrast, the SI values of gypsum and fluorite for all groundwater samples are less than zero (Table 4), indicating that gypsum and fluorite could feasibly be dissolved by the groundwater along the flow path.
Generally speaking, groundwater in the recharge zones or in the upgradient areas of a regional flow system is unsaturated with regard to gypsum, fluorite, dolomite and calcite because of short contact time with the aquifer media and/or insufficient mineral sources. With the groundwater flowing to the runoff area and then to the discharge area, many water-rock interactions will take place, and groundwater may reach equilibrium with these minerals. Accordingly, the TDS in groundwater will also increase along the groundwater flow path due to progressive mineral dissolution. Therefore, the plot of SI versus TDS (Fig. 5) is very useful in analyzing groundwater evolution along the flow path.
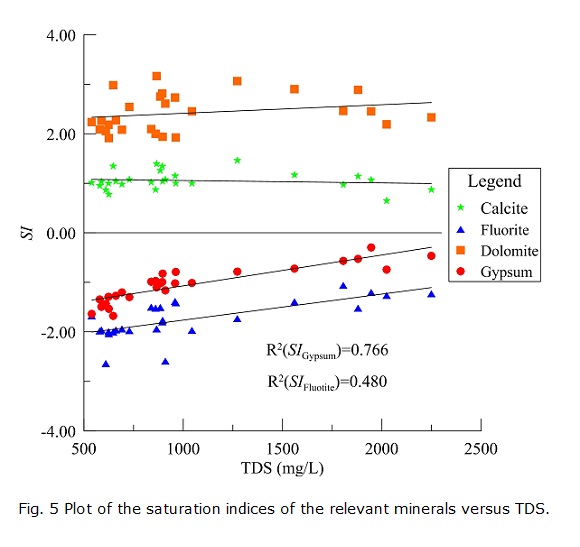
The SI values of calcite and dolomite range from 0.645 to 1.456 and from 1.909 to 3.166, respectively. The correlations between them and the TDS are not significant (Fig. 5), which indicates that calcite and dolomite do not continue to dissolve along the flow path. In contrast, the SI values of fluorite and gypsum are less than zero, and they exhibit good positive correlations with TDS (Fig. 5), which suggests that gypsum and fluorite dissolve into the groundwater along the flow path and increase the concentrations of TDS. The dissolution of gypsum and fluorite will increase the Ca2+ in groundwater, which will in turn increase the SI values of calcite and dolomite and may make them precipitate from the groundwater. The slight increase in the SI values of calcite and dolomite supports this inference (Fig. 5).
Correlation of major chemical indices
The relationships among TDS and the major ions are useful to interpret the major hydrogeochemical evolution processes within an aquifer and can also beused to deduce the sources of ions and the origin of the groundwater (Kumar 2009; Wu et al. 2013). For cations, there is a good correlation between Na + and TDS (R2=0.828, Fig. 6a), and the correlations of Ca2+ and Mg2+ with TDS are also good, with R2 =0.626 and 0.650, respectively (Figs. 7b and 7c). For anions, SO42- and TDS exhibit the highest correlation (R2= 0.922, Fig. 6e), followed by the correlation between Cl- and TDS (R2=0.859, Fig. 6d). Considering the slopes of the fitted lines, Na+ increases with TDS more rapidly than other cations, and the rate of increase of SO42- is much larger than that of Cl -. The concentration of HCO3- decreases with TDS (Fig. 6f).
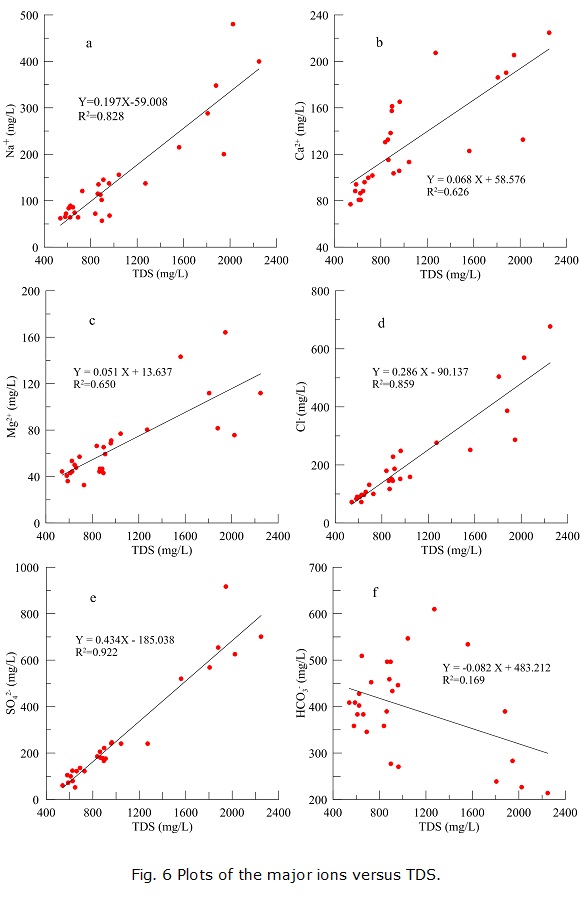
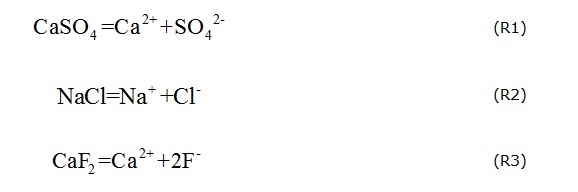
The correlations between these major ions and TDS and the saturation indices of minerals listed in Table 4 suggest the following reactions along the flow path:
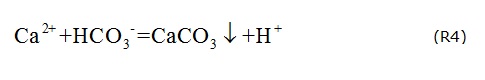
When there is excessive Ca2+, calcite may become oversaturated and precipitate from the groundwater (R4), decreasing the concentration of HCO3-. This may be the reason why HCO3- decreases with increasing TDS.
However, many reactions are involved in the evolution of groundwater, and a great deal of work is required to explain the ionic characteristics in the groundwater system. Generally, the ratios of different physiochemical parameters are useful in explaining the groundwater evolution. In the present study, certain parameters are used to interpret the possible processes controlling the groundwater chemistry.
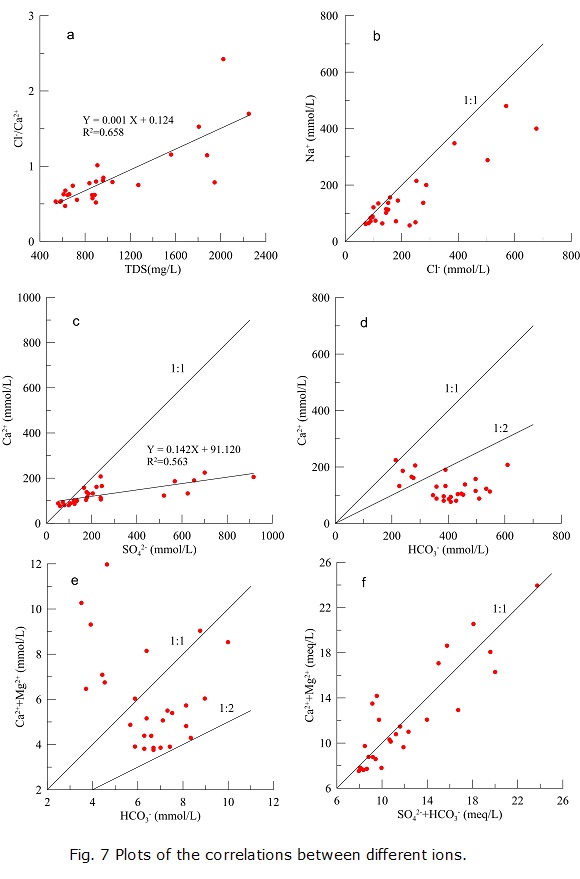
The ratio of Cl- and Ca2+ in meq/L is a parameter charactering the hydrodynamics (Li et al. 2011). Usually, Ca2+ is a dominant cation in a low-mineralized environment. With the TDS increasing, Mg2+ will gradually increase, and with further TDS increasing, Na+ will become the dominant cation in the groundwater. When the TDS value is high, Cl- isdifficult to migrate; therefore, the concentration of Cl- will increase with TDS (Li et al. 2011). As a result, the Cl-/Ca2+ will increase with TDS, suggesting a worsening of the hydrodynamic conditions. With respect to the results in the present study, Cl -/Ca2+ exhibits a linear increase with TDS (Fig. 7a), which indicates the presence of the aforementioned processes.
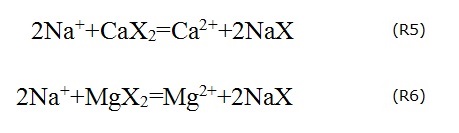
Theoretically, if Na+ and Cl- are derived solely from the dissolution of halite, the ratio of Na+ and Cl- inmmol/L should be equal to 1 (Li et al. 2013b). In the present study, most samples are plotted below the 1:1 line (Fig. 7b), which suggests that the Cl- content is higher than Na+. In other words, the dissolution of halite is not the only source of Na+ and Cl-, and other reactions influencing the contents of Na+ and Cl- may have occurred as well. Cation exchange (R5 and R6) may explain the deficiency of Na+. The cation exchange makes Na+ in groundwater adsorbed onto the surface of the aquifer media, resulting in the decrease of Na+ in the water and forcing the samples to be plotted below the 1:1 line (Fig. 7b).
Additionally, the ratio of Na+/Cl- less than 1:1 may also be explained by the infiltration of domestic sewage and animal excrement, which contain excessive chloride. There are no large cities or chemical plants in the area, and there is no waste-water treatment system either. The residents living in small villages raise many animals, such as pigs, sheep and chickens. The domestic sewage and animal excrement are indiscriminately discharged without any proper supervision or management. The pollutants contained in the domestic sewage and animal excrement may infiltrate into the aquifer with the precipitation, causing the increase of Cl- in the groundwater.
Similarly, if the dissolution of gypsum is the only explanation to the origin of Ca2+ and SO42-, the ratio of Ca2+ and SO42- in mmol/L should be 1:1. As shown in Fig. 7c, Ca2+exhibits a significant positive correlation with SO42- (R2=0.563), but the ratio of Ca2+ and SO4 2- is only 0.142. The calcite is saturated; therefore, calcite precipitation (reaction R4) is most likely the most appropriate explanation for the Ca2+ deficiency versus SO42-.
If the origins of Ca2+ and HCO3- can be exclusively explained by the dissolution of calcite, the slope for Ca2+ /HCO3- in mmol/L should range from 1:1 to 1:2 due to the following:
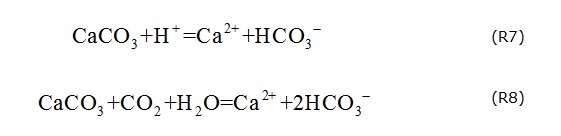
The concentration of Ca2+ exhibits a slight negative trend with HCO3- (Fig. 7d). Because the concentration of HCO 3- decreases with TDS (Fig. 6f), it can be inferred that the concentration of Ca2+ increases with TDS along the flow path, which is verified by Fig. 6b. In Fig. 7d, most samples are plotted below the line of 1:2, which indicates that the dissolution of calcite is not the onlysource of Ca2+. Furthermore, groundwater is oversaturated with respect to calcite within the study area, which is supported by the SI Calcite value listed in Table 4. Therefore, calcite dissolution is not likely to take place within the study area. Likewise, the SIDolomite is greater than 0, and the concentration of Ca2++Mg2+ does not increase with HCO3- (Fig. 7e), indicating that the dissolution of dolomite is not likely to occur in the area either. Considering the dissolution of gypsum and fluorite and the cation exchange dynamics discussed above, it is reasonable to conclude that the concentration of Ca2+ is mainly controlled by the dissolution of gypsum and fluorite, and cation exchange between Ca2+ and Na+ occurred within the study area.
However, the dissolution of carbonate minerals no doubt contributed greatly to the regional groundwater evolution, especially with respect to the origins of Ca2+, Mg2+, and HCO3-, because most samples are plotted between the 1:1 and 1:2 lines in Fig. 7e. The dissolution of the two minerals may have taken place in the upper reaches of the study area, and the groundwater may become oversaturated with the twominerals before the groundwater flows into the study area, which can be verified by the results of saturation index. The plots of SO4 2-+HCO3- versus Ca2++Mg2+ in meq/L (Fig. 7f) also indicate the contribution of the dissolution of carbonate minerals to the relevant ions.
In summary, the dissolution of carbonate minerals (calcite and dolomite) may make important contributions to the Ca2+, Mg2+ and HCO 3- in groundwater, but their dissolution may have occurred in the upper reaches rather than taking place within the study area. The groundwater has already become oversaturated with calcite and dolomite before it flows into the study area. In contrast, gypsum and fluorite are undersaturated in the groundwater, and their dissolution can be a significant contribution to the increased Ca2+ in the groundwater. The increase of Mg2+ in the groundwater may be explained by cation exchange. For Na+, the dissolution of halite contributes greatly to its concentration, but cation exchange makes the Na+ and Cl- vary differently. Furthermore, the potential artificial pollution in the area may also contribute to the different patterns of Na+ and Cl-. The reactions in a groundwater system are complex but interesting, and therefore require much more work.
Irrigation water quality assessment
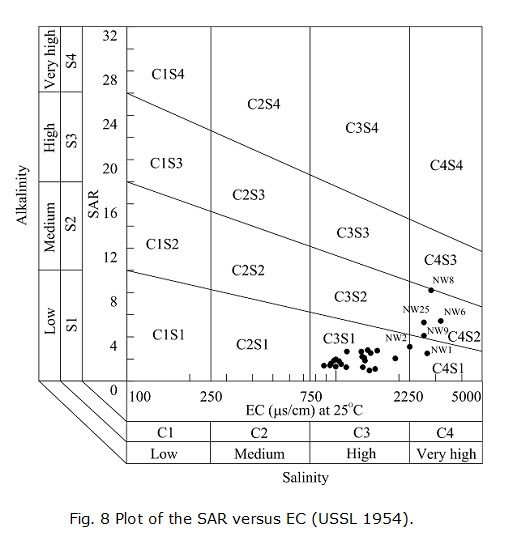
The suitability of groundwater for agricultural purposes depends on the effect of the water's mineral constituents on both plants and the soil (Tyagi et al. 2009). Wilcox (1948) and the US Salinity Laboratory Staff (USSL 1954) proposed irrigation specifications for evaluating the suitability of water forirrigation use. The USSL diagram relates SAR (representing the alkalinity hazard) to EC (representing the salinity hazard). The EC of irrigation water can be classified into low (C1), medium (C2), high (C3) and very high (C4) salinity zones. In terms of the classification of irrigation water, the alkalinity hazard is classified as low (S1, <10), medium (S2, 10-18), high (S3, 18-26) and very high (S4, >26). The irrigation water quality was assessed with the methods introduced above. The SAR value varies from 0.95 to 8.21, with an average of 2.51, indicating a low-alkalinity hazard according to the USSL classification.
In the present study, the values of SAR and EC were plotted on a US Salinity diagram (Fig. 8). The results show that most groundwater samples belong to the category C3S1, which is generally suitable for agricultural purposes. NW1 and NW2 belong to C4S1, and NW6, NW8, NW9 and NW25 belong to C4S2, which indicates that although these samples represent a low alkalinity hazard, they are not suitable for irrigation under ordinaryconditions because they represent a very high-salinity hazard. However, these waters may be used for salt-tolerant plants on permeable soils with special management practices.
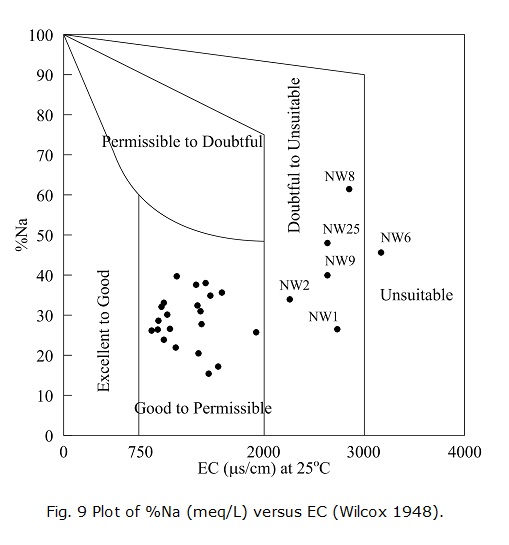
In the Wilcox diagram, the EC is related to %Na (meq/L). Generally speaking, a %Na value lower than 60% is acceptable. In the present study, most samples in the Wilcox diagram are plotted in the good to permissible zone, accounting for 77.78% of the total samples. NW1, NW2, NW8, NW9 and NW25 belong to doubtful to unsuitable category, which requires special practices for hazard control due to the high-salinity hazard. NW6 is unsuitable for irrigation (Fig. 9).
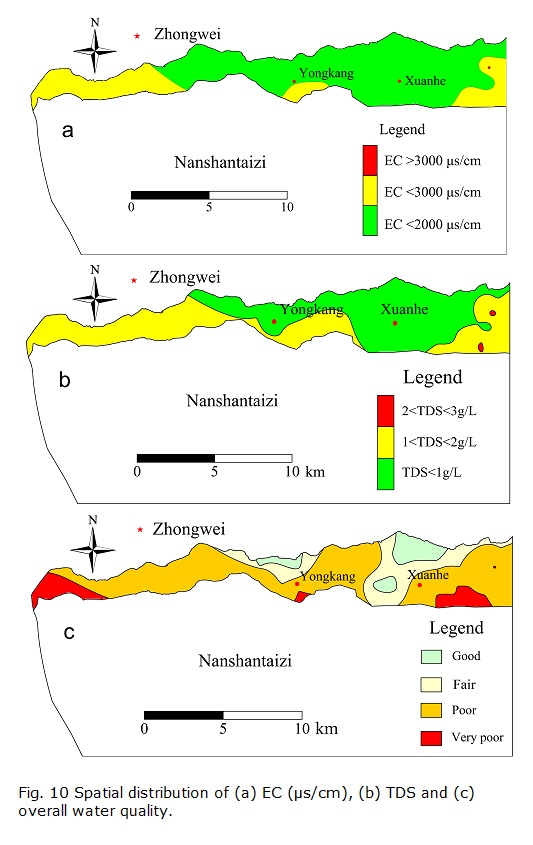
There is no high-alkalinity hazard in groundwater with respect to agricultural uses, and the only potential agricultural hazard may be the salinity hazard. Therefore, the spatial variation of EC can reflect the distribution of irrigation water quality. Fig. 10a shows the EC distribution, and it is clear that the groundwater is acceptable for agricultural use in most areas. However, in the western area and in local areas of the middle and eastern areas, the groundwater has EC values of more than 2000 µs/cm, indicating doubtful utility for irrigation.
Drinking water quality assessment
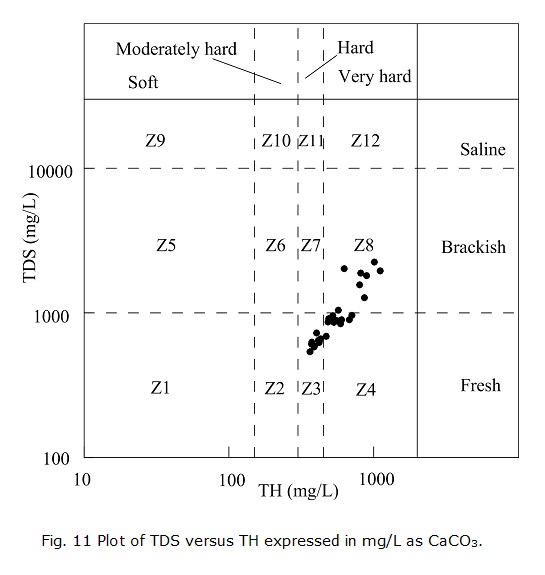
TDS and TH are two important parameters in assessing drinking water quality. TDS represents the total weight of dissolved solids in a solution and expresses the degree of salinity of a medium (Mitra et al. 2007). According to the level of TDS, groundwater can be classified as fresh groundwater(TDS<1000 mg/L), brackish water (1000<TDS<10000 mg/L) and saline water (TDS>10000 mg/L) (Wanda et al. 2011). TH is a measure of dissolved Ca 2+ and Mg2+ in water and is expressed as CaCO3. As per the grading standards of TH (as CaCO3), groundwater can be classified as soft water (TH<150 mg/L), moderately hard water (150<TH<300 mg/L), hard water (300<TH<450 mg/L) and very hard water (TH>450 mg/L) (Li et al. 2011).
Three major zones in the study area can be identified according to the level of TDS (Fig. 10b). Fresh water is mainly located in the middle and east, and groundwater with TDS values of 1-2 g/L is observed in the western and southeastern areas. Groundwater with TDS values higher than 3 g/L is found only locally in the east. It appears that the groundwater around Xuanhe Town is good with respect to TDS. Figs. 10a with 10b appear similar. This is because the two parameters both reflect the groundwater salinity, and they can be approximately converted into each other using the relationship EC=γTDS, where γ is in the range of 0.55-0.75 (Qian and Ma 2005). The plot of TDS versus TH (Fig. 11) suggests that the groundwater samples lie in the zones Z3, Z4 and Z8, indicating different quality levels among these samples. Samples that belong to zone Z3 are suitable for human consumption because they are fresh water with acceptable degrees of hardness. However, the samples that belong to zones Z4 and Z8 are not fit for direct consumption because they are either too hard or too salty.
Although TDS and TH are two very important parameters for indicating the suitability of water for drinking, they do not comprehensively reflect the overall water quality. Other indices may also have large influences on the overall water quality. In the present study, the comprehensive water quality index (CWQI), recommended by the Quality Standard for Groundwater of China (Bureau of Quality and Technical Supervision of China 1994), was selected to comprehensively assess the drinking water quality, and the comprehensive assessment results are illustrated in Fig. 10c.
Fig. 10c reveals that poor-quality water, with respect to drinking purposes, is widespread in the study area, and good- and fair-quality water is only observed locally near Xuanhe Town and Yongkang Town. In the front zone of Nanshantaizi, very poor quality water is observed. The results suggest that the groundwater in most regions of the study area is not fit for direct consumption, and special pretreatments should be performed if it is used for drinking. The poor quality of the groundwater is caused by excessive levels of TDS, TH, Cl- and SO42-, which result from the dissolution of minerals in the aquifer media. No serious anthropogenic pollution was detected in this study. However, agricultural activities in Nanshantaizi, such as irrigation by diverting water from the Yellow River, may cause water quality deterioration along the front zone of Nanshantaizi, and this requires further specific investigation.
Conclusions
This research demonstrated the hydrogeochemical evolution of shallow groundwater via multiple approaches. The groundwater quality with respect to agricultural and drinking purposes was assessed. The conclusions can be summarized as follows.
• There are higher concentrations of major ions and higher values of chemical parameters in the groundwater than in the Yellow River water. The groundwater in the study area is fresh to moderately mineralized, with TDS values ranging from 539.75 to 2248.98 mg/L. No ammonia nitrogen pollution or nitrate nitrogen pollution was detected, but local nitrite nitrogen pollution was observed.
The groundwater samples with different concentrations of TDS possess different hydrochemical characteristics. For groundwater samples with TDS < 1g/L, Ca2+ is the predominant cation, followed by Na+ and Mg2+, whereas for groundwater samples with TDS > 1 g/L, Na + is the major cation, followed by Mg2+ and Ca2+. For anions, HCO3- is predominant in the groundwater samples with TDS< 1 g/L. In contrast, for groundwater samples with TDS > 1 g/L, SO42- and Cl- are the most prevalent anions. The main hydrochemical facies for groundwater samples with TDS < 1 g/L are HCO3-Ca·Mg and HCO3 -Ca·Na·Mg, but for groundwater samples with TDS > 1 g/L, SO4·Cl-Na and SO4·Cl-Na·Mg·Ca are the predominant hydrochemical types. The pH values of groundwater samples with TDS < 1 g/L are lower than those of groundwater with TDS > 1 g/L.
• Most major ions, with the exception of HCO3-, increase with TDS. The increase of Ca2+ and SO42- can be attributed to the dissolution of gypsum and fluorite. The deficiency of Ca2+ against SO42- may be attributed to the precipitation of calcite and dolomite along the flow path. The increase of Mg2+ may be explained by the cation exchange. The dissolution ofhalite contributes greatly to the increase of Na+, but cation exchange and potential artificial pollution make the Na+ and Cl - vary with different patterns. The reactions in the groundwater system are very complex.
• Most water samples are acceptable for agricultural use. The suitability of groundwater with regard to agricultural use is controlled by salinity. Groundwater with acceptable quality is mostly distributed in the middle and east, whereas in the west and in local areas of the middle and east, the groundwater is of doubtful quality for irrigation. Necessary management practices are required when doubtful-quality water is used for irrigation.
• Groundwater in most areas is not fit for direct human consumption. The poor drinking water quality is caused by excessive levels of TDS, TH, Cl - and SO42-, which are mainly caused by the dissolution of minerals in the aquifer media. The groundwater pollution along the front zone of Nanshantaizi can also be attributed to the irregular irrigation patterns in this area.
Acknowledgement
The research was supported by the Doctor Postgraduate Technical Project of Chang'an University (2013G5290002 and 2014G5290001), the National Natural Science Foundation of China (41172212), the Special Fund for Ningxia Environmental Protection (2011HB001) and the Technical Program of Environmental Protection of Ningxia Environmental Protection Department (201108011). We thank Wei Yani, Song Baode and Zhang Xuedi for their help with the field investigation and sampling. The editor and anonymous reviewers are also acknowledged for their useful comments on the paper.
References
Bureau of Quality and Technical Supervision of China. (1994). National Standard of the People's Republic of China: Quality Standard for Groundwater, GB/T 14848-93. (in Chinese. [ Links ])
Fipps, G. (2003). Irrigation water quality standards and salinity management strategies. Texas Agricultural Extension Service, Texas A&M University System, College Station, TX (USA). B-1667, 4-03, 1-19. [ Links ]
Guo, H. M., & Wang, Y. X. (2005). Geochemical characteristics of shallow groundwater in Datong basin, northwestern China. Journal of Geochemical Exploration, 87, 109-120. DOI: 10.1016/j.gexplo.2005.08.002. [ Links ]
Hakim, M. A., Juraimi, A. S., Begum, M., Hasanuzzaman, M., Uddin, M. K., & Islam, M. M. (2009). Suitability evaluation of groundwater for irrigation, drinking and industrial purposes. American Journal of Environmental Sciences, 5(3), 413-419. [ Links ]
Kumar, S. K., Rammohan, V., Sahayam, J. D., & Jeevanandam, M. (2009). Assessment of groundwater quality and hydrogeochemistry of Manimuktha River basin, Tamil Nadu, India. Environmental Monitoring Assessment, 159(1-4), 341-351. DOI: 10.1007/s10661-008-0633-7. [ Links ]
Khodapanah, L., Sulaiman, W. N. A., & Khodapanah, N. (2009). Groundwater Quality Assessment for Different Purposes in Eshtehard District, Tehran, Iran. European Journal of Scientific Research, 36(4), 543-553. [ Links ]
Kanduš, T., Mori, N., Kocman, D., Stibilj, V., & Grassa, F. (2012). Hydrogeochemistry of Alpine springs from North Slovenia: Insights from stable isotopes. Chemical Geology, 300-301, 40-54. DOI: 10.1016/j.chemgeo.2012.01.012.
Li, P. Y., Qian, H., Wu, J. H., & Ding J. (2010a). Geochemical modeling of groundwater in southern plain area of Pengyang County, Ningxia, China. Water Science and Engineering, 3(3): 282-291. DOI: 10.3882/j.issn.1674-2370.2010.03.004. [ Links ]
Li, P. Y., Wu, Q., & Wu, J. H. (2010b). Groundwater Suitability for Drinking and Agricultural Usage in Yinchuan Area, China. International Journal of Environmental Sciences, 1(6), 1241-1249. [ Links ]
Li, P. Y., Qian, H., & Wu, J. H. (2011). Hydrochemical Characteristics and Evolution Laws of Drinking Groundwater in Pengyang County, Ningxia, Northwest China. E-Journal of Chemistry, 8(2), 565-575. DOI: 10.1155/2011/472085. [ Links ]
Li, P. Y., Wu, J. H., Qian, H. (2013a) Assessment of groundwater quality for irrigation purposes and identification of hydrogeochemical evolution mechanisms in Pengyang County, China. Environmental Earth Sciences, 69, 2211-2225. DOI:10.1007/s12665-012-2049-5. [ Links ]
Li, P. Y., Qian, H., Wu, J. H., Zhang, Y. Q., & Zhang, H. B. (2013b). Major Ion Chemistry of Shallow Groundwater in the Dongsheng Coalfield, Ordos Basin, China. Mine Water and the Environment, 32, 195-206. DOI: 10.1007/s10230-013-0234-8. [ Links ]
Menció, A., & Mas-Pla, J. (2008). Assessment by multivariate analysis of groundwater-surface water interactions in urbanized Mediterranean streams. Journal of Hydrology, 352, 35-366. DOI:10.1016/j.jhydrol.2008.01.014. [ Links ]
Mitra, B. K., Sasaki, C., Enari, K., Matsuyama, N., & Fujita, M. (2007). Suitability assessment of shallow groundwater for agriculture in sand dune area of northwest Honshu Island Japan. Applied Ecology and Environmental Research, 5(1): 177-188. [ Links ]
Parkhurst, D. L., & Appelo, C. A. J. (1999). User's Guide to PHREEQC (Version 2) - A Computer Program for Speciation, Batch-Reaction, One-Dimensional Transport, and Inverse Geochemical Calculations . Denver: U.S. Geological Survey Earth Science Information Center. [ Links ]
Piper, A. M. (1953). A Graphic Procedure in the Geochemical Interpretation of Water Analysis. Washington D.C.: United States Geological Survey. [ Links ]
Qian, H., Li, M. Y., Ji, Y. D., Yang, B. C. & Zhao, Z. H. (2007). Changes of δ18O and δD along the Dousitu River, Inner Mongolia, China, and their evidence of river water evaporation. Aquatic Geochemistry, 13(2), 127-142. DOI: 10.1007/s10498-007-9011-2.
Qian, H., & Ma, Z. Y. (2005). Hydrogeochemistry, Geologic Publishing House, Beijing, China. (in Chinese). [ Links ]
Reghunath, R., Murthy, T. R. S., & Raghavan, B. R. (2002). The utility of multivariate statistical techniques in hydrogeochemical studies: an example from Karnataka, India. Water Research, 36(10), 2437-2442. DOI: 10.1016/S0043-1354(01)00490-0. [ Links ]
RockWare, Inc. (2004). A User's Guide to RockWare® Aq•QA®, Version 1.1. RockWare, Inc., Golden, Colorado, USA.
Tyagi, S. K., Datta, P. S., & Pruthi, N. K. (2009). Hydrochemical appraisal of groundwater and its suitability in the intensive agricultural area of Muzaffarnagar district, Uttar Pradesh, India. Environ Geol, 56, 901-912. DOI 10.1007/s00254-008-1190-7. [ Links ]
USSL (United States Salinity Laboratory Staff). (1954). Diagnosis and Improvement of Saline and Alkali Soils. US Department of Agriculture (USDA), Agriculture Handbook 60, Washington, 69-81. [ Links ]
Wanda, E., Monjerezi, M., Mwatseteza, J. F., & Kazembe, L. N. (2011). Hydro-geochemical appraisal of groundwater quality from weathered basement aquifers in Northern Malawi. Physics and Chemistry of the Earth, Parts A/B/C, 36(14-15), 1197-1207. DOI: 10.1016/j.pce.2011.07.061. [ Links ]
Wang, J. X., Huang, J. K., Rozelle, S., Huang, Q. Q., & Blanke, A. (2007). Agriculture and groundwater development in northern China: trends, institutional responses, and policy options. Water Policy, 9(Supplement 1), 61-74. DOI: 10.2166/wp.2007.045. [ Links ]
Wilcox, L. V. (1948). The Quality of Water for Irrigation Use. US Department of Agricultural Technical Bulletin 1962, Washington. [ Links ]
Wu, J. H., Li, P. Y., Qian, H., Duan, Z., &. Zhang, X. D. (2013). Using correlation and multivariate statistical analysis to identify hydrogeochemical processes affecting the major ion chemistry of waters: a case study in Laoheba phosphorite mine in Sichuan, China. Arabian Journal of Geosciences, online first. DOI:10.1007/s12517-013-1057-4. [ Links ]
Wu, J. H., Li, P. Y., Qian, H., & Fang, Y. (2014). Assessment of soil salinization based on a low-cost method and its influencing factors in a semi-arid agricultural area, northwest China. Environmental Earth Sciences, 71:3465-3475. DOI:10.1007/s12665-013-2736-x. [ Links ]
Xu, H., Hou, Z. H., An, Z. S., Liu, X. Y., & Dong, J. B. (2010). Major ion chemistry of waters in Lake Qinghai catchments, NE Qinghai-Tibet plateau, China. Quaternary International, 212, 35-43. DOI: 10.1016/j.quaint.2008.11.001. [ Links ]
