


 Inglês (pdf)
 Artigo em XML
 Referências do artigo
 Enviar este artigo por email
 Citado por SciELO
  Citado por Google
  Similares em
SciELO
Similares em
SciELO  Similares em Google
 Permalink
1. Introduction
Turkey has a unique geographic location at the junction between Asia, Europe and Africa. It is located in an active tectonic orogenic belt with young faults and active volcanisms (Keskin et al. 1998; Kaya 2012; Pamuk et al. 2018a, b). The extensive volcanism, hydrothermal activities and presence of more than one-thousand hot springs, some of which have 373 K and greater temperatures prove that Turkey has an important geothermal energy potential; in fact, it is the 7th richest country in terms of known geothermal energy resources around the world (Balat 2006). Turkey is located in the Alpine-Himalaya orogenic belt, and it causes different tectonic zones such as the North Anatolian fault zone (NAFZ), the Eastern Anatolian fault zone (EAFZ), the North East Anatolian fault zone (NEAFZ) and the Aegean graben systems (AGS). These active tectonic units give rise to geothermal energy resources (Haklidir 2015). Previous studies such as Baris et al. (2005), Ozer and Polat (2017a, b), Ozer et al. (2018) indicate that geothermal fluids are born in the crust by thermal conduction, particularly in volcanic and tectonically active areas. Furthermore, Kocyigit and Canoglu (2017) claimed that the Erzurum pull-apart basin is also a geothermal field, but this aspect of the basin has not been studied yet (Fig. 1).
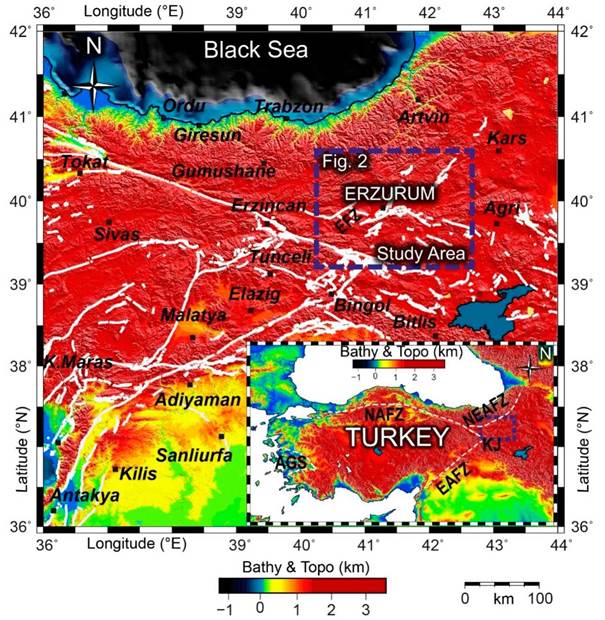
Figure 1 Tectonic settings of Erzurum, Eastern Anatolia. Blue and white dashed lines represent the study area and main fault zones, respectively. AGS: Aegean Graben System, EFZ: Erzurum Fault Zone, EAFZ: East Anatolian Fault Zone, KJ: Karliova Junction, NAFZ: North Anatolian Fault Zone, NEAFZ: North East Anatolian Fault Zone (compiled from Emre et al. 2013 and Emre et al. 2018).
Several studies have been conducted in the study area within the earth sciences. The geological structure and tectonic evolution of Erzurum region and its surroundings have been mainly investigated by Keskin et al. (1998), Yarbasi and Kalkan (2009), Kocyigit and Canoglu (2017). Moreover, there are some attempts associated with geothermal potential (Bektas et al. 2007; Maden et al. 2015; Gulec and Hilton 2016), geochemical (Bayraktutan et al. 1996; Keskin e al. 1998; Italiono et al. 2013; Yuce and Taskiran 2013; Kilic and Inceoz 2015; Gulbay 2015; Kaygusuz et al. 2018) and petroleum (Oruc et al. 2013) features of the area. In recent years, there are several seismological studies for the Eastern part of Turkey such as: Maden and Ozturk (2015), Ozturk (2015; 2017; 2018) and these studies are very important in the evaluation of seismotectonic properties of the Eastern Anatolian region. The most prominent results were produced by the Eastern Turkey Seismic Experiment (ETSE) project in the study area (Sandvol et al. 2003; Zor et al. 2003; Gok et al. 2007; Skolbeltsyn et al. 2014). They suggest that the Eastern Turkey is lifted by hot asthenosphere instead of a thick crust structure. The low velocities point out the disappearance of the lithospheric mantle underneath the plateau and its replacement with asthenospheric units. Nevertheless, none of these studies were the subject of Erzurum and its surroundings at local scale. Furthermore, Salah et al. (2011) declared that high poison ratio areas are obviously distinguishable at most of the layers down to a depth of 40 km, which are consistent with the probability of the presence of partial melt in the lower crust. Gokalp (2012) obtained tomographic sections with high velocities, which were mainly in parallel with the tectonic features existing at shallow depth layers in the area. This should be associated with the existence of magmatic units at shallow depths. Another characteristic is that the low velocity values are commonly dispersed along the three dimensional (3-D) structure beneath the region at deeper crustal depths. This anomaly may be an indicator of the hypothesis that the Anatolian Plateau is underlain by a partially molten uppermost mantle.
The Local Earthquake Tomography (LET) is a powerful method for determining the features of the Earth's interior. The LET is frequently applied to high velocity contrast regions such as geothermal, volcanic areas and subduction zones, and it is also applied to an iterative nonlinear method in which ray paths are traced in updated 3-D seismic velocity structures (Koulakov 2009). The P- and S- wave velocities in the upper crust are usually associated with lithological features, whereas the Vp/Vs ratio is related to petrological variations in the rocks, tectonic units and fluid-rich, high pore pressure regions. The LET is also a convenient tool to understand the local-regional tectonics and seismogenic properties of a region (Kaypak and Gokkaya 2012).
3-D velocity structure ofthe upper crust of Erzurum is not known in detail and this causes significant lack of information in the investigating of geothermal areas especially in the Eastern Turkey, where the potential reservoirs have not been drilled yet. A dense array and high seismicity of the Eastern Turkey gives us a chance to investigate the seismic crustal structure and locations of the events, which in turn can aid to inquire the tectonic deformation, lithological changes, fault zone kinematics and petrological characteristics of the rocks. We determine the 3-D P-wave velocity and Vp/Vs model of the Erzurum basin using the LET technique for the first time. This study also discovers new possible geothermal regions by developing horizontal and vertical tomographic sections using local earthquakes from a dense seismic array.
2. Geology and Tectonics
The Eastern Anatolia is one of the best exposed and most complete transects in the globe, across a volcanic province on a continental collision zone (Keskin et al. 1998). Two different strike-slip fault systems manage the tectonics of the Plateau. These are the NW-SE trending strike-slip faults paralleling the NAFZ and the NE-SW trending strike-slip faults paralleling the EAFZ. Erzurum, the metropolitan city of the Eastern Anatolia of Turkey, is located in the seismically active main segment of the Erzurum Fault Zone (EFZ) in the Northeast Anatolian compressional area. The seismic activity of Erzurum is mostly controlled by Dumlu and Palandoken fault zones, characterized by the NE-SW trending faults on eastern margin, whereas the NE-SW trending reverse faults on the southern margins, associated with neotectonic deformations after Plio-Quaternary (Yarbasi and Kalkan 2009).
Erzurum is located outside and nearly 70 km far from the Karliova Junction (KJ), where the NAFZ and EAFZ converge to each other. The KJ is an area where the Anatolian plateau (east of KJ), the Anatolian block and the Arabian plate intersect (Gok et al. 2007). The Erzurum pull-apart basin is mainly developed by the deformation and subdivision of an E-W-trending paleo-tectonic unit, during the Quaternary strike-slip neotectonic period. It is located in the East Anatolian tectonic block, which has been controlled by a strike-slip neo-tectonic regime since the early Quaternary period (Kocyigit and Canoglu 2017). The Quaternary Erzurum pull-apart basin is an approximately 90 km long, 30 km wide, actively developing strike-slip depression. It is confined by the Erzurum-Dumlu left lateral strike-slip fault zone (EDFZ) in the east-southeast, by the Baskoy-Kandilli reverse fault zone (BKFZ), by the Askale left lateral strike-slip fault zone (AFZ) in the north-northwest and by the N-S-trending Ilica oblique-slip normal fault in the west.
The EDFZ is 20 km wide, 150 km long and extends along the NE-trending zone of active strike-slip faulting. It determines and manages the east-southeastern edge of the Erzurum pull-apart basin. The AFZ is a 6 km wide, 140 km long and extends along the NE-trending sinistral strike-slip fault zone (Kocyigit and Canoglu 2017) (Fig. 2). The Eastern Anatolian region shows complete transects across a volcanic area associated with a continental collision zone. The Erzurum-Kars Plateau is important, because it includes a full record of collision-related volcanism from Miocene to Pliocene within this region (Keskin et al. 1998).
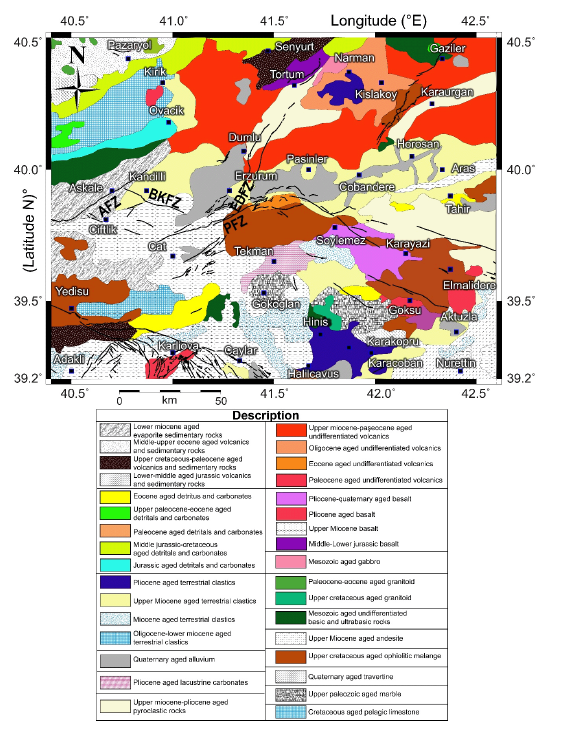
Figure 2 Simplified geological and tectonic map of Erzurum, Eastern Anatolia. Black thin lines and black boxes indicate main fault zones and settlements area, respectively.AFZ: Askale Fault Zone, BKFZ: Baskoy-Kandilli Fault zone, EDFZ: Erzurum-Dumlu Fault Zone, PFZ: Palandoken Fault Zone (Yarbasi and Kalkan 2009; Akbas et al. 2013; Kocyigit and Canoglu 2017).
It is observed in several parts of the Eastern Anatolia that ophiolitic and young volcanic units are common. The paleoseismic data shows that the EFZ is responsible for many Holocene events with horizontal displacements of 1.5 to 3.0 m. From these slip measurements and the size of the fault, the EFZ is thought to trigger devastating earthquakes greater than Mw 7.1 with recurrence intervals of 1000 to 3000 years. It is understood from the early tectonic geomorphology within the EFZ that these fault segments can also be still active. The proximity of the EFZ to the Erzurum province creates an important seismic hazard to the city (Emre et al. 2004; Emre et al. 2018). The study area covers the southern segment of the Karasu intermountain sedimentary basin with a Miocene-Quaternary volcanic basement, andesitic-basaltic lava flows and fissure eruptions of basaltic lava. Two segments of the EFZ, Dumlu (DFZ) and Palandoken (PFZ) fault lines are both active and meet at the southeast side of the basin, very close to the city. The DFZ cuts and deforms Plio-Quaternary basin fill, volcanic rocks of both the NW part of the East Anatolian plateau and the E-SE parts of the east Pontides. It is a sinistral strike-slip fault formed after Late Miocene, or during the Plio-Quaternary neotectonic period (Oruc et al. 2013). The point of convergence is expected to be the most likely epicenter of some future large earthquake (Yarbasi and Kalkan 2009) (Fig. 2).
The Erzurum-Pasinler-Horasan basin, which surrounds Miocene rocks, is oriented in the E-W direction. The Pontides connect to this basin in the north. The sedimentary process in the study area is Eocene to Quaternary. In the period from the Miocene to present, the early sedimentary patches of the studied area have been developed. Within this, patches of sedimentary sequences, to have been collected since the Oligocene epoch, play a significant role as source and covered beds (Maden et al. 2015) (Fig. 2).
3. Data and Methods
The Eastern Anatolia is monitored by the Ataturk University seismic network (ATANET) consisting of sixteen seismometers operated by Ataturk University and fifty-three seismometers (Guralp CMG-3T, CMG-6T, CMG-3ESP, CMG-40T) managed by the Earthquake Department of the Disaster and Emergency Management Authority (AFAD) network in Ankara. All seismometers are broadband with 100 Hz sampling rate. The spatial distribution of the permanent seismological stations that record the earthquakes is presented in Figure 3.
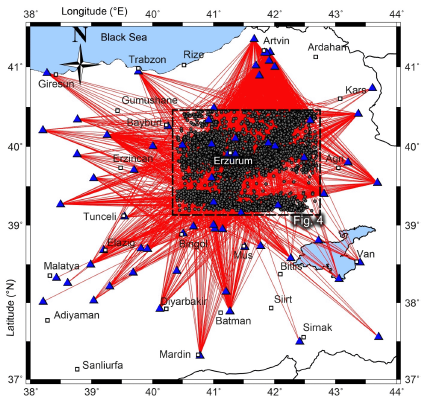
Figure 3 Horizontal ray path coverage of P wave data set in plain perspective. Straight red lines indicate the pathway between events (dark gray circles) and stations (blue triangles).
The distribution of earthquakes concentrates on main tectonic zones such as AFZ, BKFZ, EDFZ and PFZ. There is no earthquake distribution along the latitude of 39.5. This is related to the fact that minor tectonic zones are not active. Furthermore, events mainly locate in the first 30 km depth of the crust as clearly observable from vertical depth (Fig. 4)
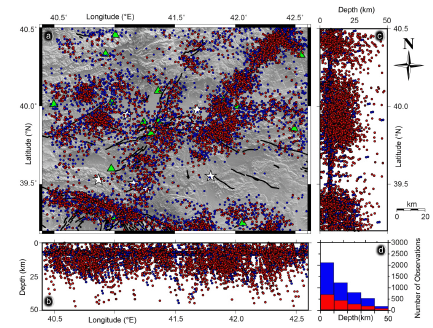
Figure 4 a). Distribution of initial 4801 (blue circles) and selected 1685 (red circles) high quality earthquakes (hand-picked, M>2.0) recorded between 2007 and 2017 in Erzurum and near surroundings. Seismological stations and geothermal areas are represented by filled green triangles and white stars, respectively. Thin black lines show fault traces (Emre, et al. 2013; Emre et al. 2018). b) Depth sections of the earthquake distribution according to longitude variation. c) Depth sections of the earthquake distribution according to latitude variation.
The hand-picked initial earthquake data set comprises P- and S wave arrival times of 4801 local earthquakes well distributed over an area of about 150 x 250 km2 and recorded from 2007 to 2017. We selected the earthquakes recorded at least by nine stations with RMS <0.5 s. ±10%, periodically. In order to understand the impact of noise on the resolution and the optimal values of free parameters, we applied checkerboard tests. These selection parameters were determined using extensive checkerboard tests after several trial attempts. After many experiments, the parameters obtained when the RMS value is lowest and the most suitable model is detected. Therefore, these parameters were determined as a result of many experiments. The initial earthquake locations are determined by the Hypo71 program (U.S. Dept. of the Interior Geological Survey 1975) in SEISAN software suit (Havskov and Ottemoller 1999) as part of routine earthquake location process in Ataturk University. The final event data set used for tomographic calculation consists of 29,894 arrival times from 1685 earthquakes with 17,298 P wave and 12,596 S wave arrivals. The accuracy of the final P- and S travel time residuals are on average equal to 0.18 and 0.26 s, respectively after 5 iterations (Table 1). Initial and final travel time residual values of earthquakes are also presented in Fig.5. The low residuals values after five iterations confirm that the high quality hand-picking phase reading process applied in the travel times of events. This process depend on the observed P- and S-wave travel times to invert simultaneously for a 3-D image of the P- and S wave velocities, hypocentres, and station corrections (Ozer et al. 2018, Ozer et al. 2019).
Table 1 Mean RMS (sec) values of the P- and S-wave residuals after five iterations
| Iteration | Vp RMS (sec) | Vs RMS(sec) |
|---|---|---|
| 1 | 0.325 | 0.489 |
| 2 | 0.207 | 0.307 |
| 3 | 0.192 | 0.284 |
| 4 | 0.187 | 0.272 |
| 5 | 0.179 | 0.259 |
| Number of phases | 17298 | 12596 |
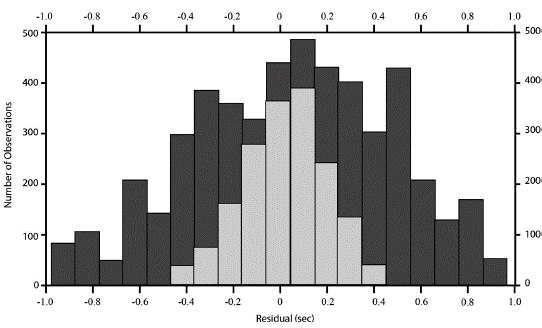
Figure 5 Initial (dark gray column) and final (light gray column) travel time residual values of earthquakes.
The Local Earthquake Tomography Software (LOTOS-12) (Koulakov 2009) is used for tomographic calculations, computation of P and S velocity models and to improve earthquake locations. The initial earthquake locations are determined by the LOTOS one-dimensional (1-D) location algorithm using initial the 1-D velocity structure in the first stage. In order to determine the best 1-D velocity model representing the region, six velocity structures reported in the study area were tested (Teoman et al. 2005, Ozacar et al. 2008, Salah et al. 2011, Gokalp 2012, Maden 2012, Cinar and Alkan 2015). They were compared with the LOTOS 1-D velocity optimization results and the best model converging through these models and the high quality data set was selected. It is obvious that the model produced by Maden (2012) is compatible and converges with the data set (Fig. 6.a). Another velocity model proposed by Teoman et al. (2005) may be an alternative model that can represent the study area (Fig. 6.b). It was determined that the RMS values in 1-D velocity models of Cinar and Alkan (2015), Ozacar et al. (2008), Salah et al. (2011) and Gokalp (2012) were 0.69, 0.50, 0.55 and 0.68 s, respectively (Fig. c-f). As a result of this process, it was determined that the velocity model produced by Maden (2012) was the best model as 1-D velocity model.
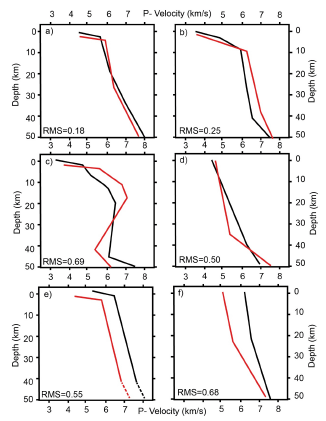
Figure 6 1-D velocity model optimization results produced by using different models. Initial and final models are represented by black and red lines, respectively. The 1-D velocity structures used as input models (black line) in this study are; a) Maden (2012), b) Teoman et al. (2005), c) Cinar and Alkan (2015), d) Ozacar et al. (2008), e) Salah et al. (2011) and f) Gokalp (2012), respectively.
The 1-D velocity model proposed by Maden (2012) for the study area (Table 2) is used as an initial model to start the tomographic calculations.
Table 2 1-D reference model used in the tomographic inversion for P- wave velocity (Maden 2012)
| Depth (km) | Vp Velocity (km/s) |
|---|---|
| -3.0 | 4.1 |
| 0.0 | 4.4 |
| 4.0 | 5.8 |
| 20.0 | 6.2 |
| 35.0 | 7.1 |
| 50.0 | 8.0 |
| 100.0 | 8.7 |
The travel times for overall feasible combinations of earthquake depths and epicentral distances are calculated for an 1-D velocity structure (Nolet 1981). Initial earthquake locations are calculated based on a goal function (GF) method. This earthquake location technique is more stable and does not belong to the initial stage of inversion. A grid search method (GSM) is used to determine origin time and focal parameters. The GF and GSM are described in detailed in Koulakov and Sobolev (2006). Afterwards, locations were recomputed with an algorithm that uses a 3-D velocity model, which makes use of the ray bending technique, the details can be found in Koulakov (2009).
3-D velocity model grid parameterization is based on the ray density approach as described in Koulakov et al. (2006). The 3-D seismic velocity structure is calculated in nodes distributed in the study area. Velocity values among the nodes are linearly interpolated by subdividing the study volume into tetrahedral blocks. In order to avoid dense node concentration in the model with high-ray density, we define the minimum spacing between nodes as 5 km, which is lower than a typical dimension of the anticipated anomalies. The matrix is calculated from ray paths, after 3-D event locations are completed. The tomographic inversion is accomplished simultaneously for P and S velocities, focal parameters and station corrections. The velocities are updated and used in the next iteration. Furthermore, the effect of possible bias in a selected grid configuration on the ultimate velocity model is reduced by repeating the inversion using grids with different orientations (e.g., 0, 22, 45, and 67) and averaging the results (Koulakov et al. 2010a, b). During inversion, the tomographic model is smoothed by controlling a special matrix block that associates neighboring nodes and damps the difference in velocity between all pairs of nodes. The value of damping is decided by synthetic model simulations. The least squares (LSQR) algorithm (Paige and Saunders 1982; van der Sluis and van der Vorst 1987) is used for inversion of the large sparse matrix. To get a convincing convergence, the LSQR iteration number is specified to be 100. By an inversion step, velocities are recomputed in a 3-D grid and used for the next iteration. We applied five iterations of the tomographic cycle. The inversion by the LOTOS algorithm can provide P-velocity and the Vp/Vs ratio (Koulakov et al. 2007; Yakovlev et al. 2007; Koulokov 2009; Koulakov et al. 2009; Dinc et al. 2010; Koulakov et al. 2010a, b; Kuznetsov and Koulakov 2014; Totaro et al. 2014; Khrepy et al. 2015; Ozer and Polat 2017a, b.; Ozer et al. 2018).
4. Checkerboard Test
Synthetic tests are a significant part of the inversion process in evaluating the spatial resolution assured by the available data, station coverage and the algorithm itself. To assess the resolution capacity of our tomographic model in the study area, we performed synthetic reconstructions that simulate the real situation as closely as possible. Moreover, these tests provide information for estimating values of optimal inversion parameters, such as iteration numbers, grid spacing, etc. We tried synthetic and observed data in turn several times to acquire the best-fit parameters in the study area. The smoothness parameters of P- and S- wave were determined as 5 and 10, respectively. The synthetic travel times are calculated for realistic source-receiver pairs that are used for the inversion of the observed data.
After the synthetic travel times were computed, all information regarding focal parameters and velocity model were discarded and the same process was repeated using the updated inversion parameters, including the absolute locations. The travel times were perturbed with noise having average deviations of 0.15 s and 0.3 s for the P- and S phases, respectively. These perturbations provide similar variance reduction as in the real data inversion. The typical horizontal checkerboard test results were presented in Fig. 7. The checkerboard test was performed by changing unlimited negative and positive columns of uniform seismic anomalies of either 30 x 30 km2 or 50 x 50 km2 size with 5 km of empty space between the columns. The size of velocity and Vp/Vs anomalies from 0 to 30 km were set to ±10 % and 1.5 to 2.5, respectively. The results of there building process show acceptable resolution for all depth layers for the Vp and Vp/Vs profiles, as seen from Fig. 7. However, the checkerboard results indicate some smearing, which gets worse for deeper layers (below 30 km). The amplitude of the deeper anomalies after rebuilding is lower than that of the shallower layers. It was observed that the Vp and Vp/Vs models are well converged in shape and amplitude after rebuild, down to 30 km. The resolution is not good at deeper levels due to poor ray coverage. It should be considered that the Model 1 (30 km) and Model 2 (50 km) are robustly rebuilding in most of the study volume. In order to determine the resolution of the vertical Vp and Vp/Vs profiles, a checkerboard test was performed with columns of 20x 20 km2 with a gap of 2.5 km. In Vp and Vp/Vs results, it was observed that the resolution is high up to 30 km depth in all vertical sections (Fig. 8).
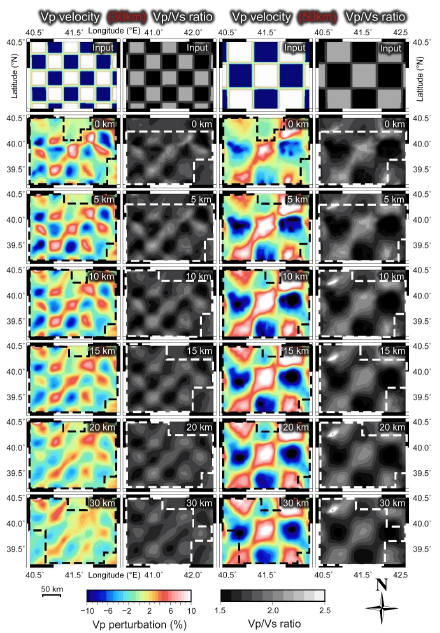
Figure 7 Consecutive negative (blue color)-positive (white color) P wave anomalies (±10%) and low (black)-high (light gray) Vp/Vs ratios (from 1.5 to 2.5) show the reconstructed variation: 30 and 50 km box sizes with 5 km empty space, respectively. Input model is presented at the top of each column. Synthetic (checkerboard) test is calculated to understand the spatial resolution and to predict the optimal values of inversion parameters down to 30 km depth layers. The black (Vp) and white (Vp/Vs) dashed lines represent the well-resolved areas.
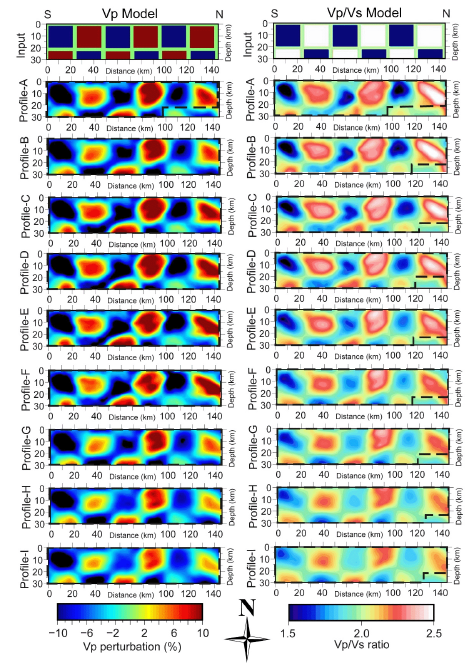
Figure 8 Vertical Vp and Vp/Vs checkerboard test results for nine depth-cross sections. The input depth cross-sections with block size of 20x20 km2 (with 2.5 km empty size) are conducted to evaluate the stability of depth-cross sections. The black dashed lines represent well-resolved areas. Periodic negative and positive perturbation shows the ±10% velocity changes. Vp/Vs ratio changes from 1.5 to 2.0. The traces of profiles are the same as the location of the tomographic results presented in Figures 11 and 12.
A good resolution was obtained beneath Erzurum, where station coverage is denser. When the initial model is compared with the results on the boundaries of the study area, the ray paths are insufficient to provide adequate resolution below 30 km. It is clearly seen that the initial and final anomaly amplitudes and shapes coincide with each other very well.
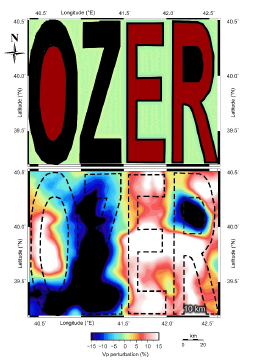
Another type of synthetic test was performed in order to prove how high the resolution in the study area. In this test, letters and six prisms have been used and there is a 15% periodic velocity change between each prism. It seems that they approach the original model but they are not identical in 10 km horizontal tomographic section. However, the result is sufficient to interpret the study area. (Fig. 9).
5. Results
The Vp, Vs velocity perturbations and Vp/Vs model results were shown in three horizontal depth layers from 0 to 10 km (Fig. 10). It should be noted that there exists a high velocity anomaly pattern at shallow depths in the direction of NE-SW, which is in line with the main tectonic zone, i.e. the NEAFZ. This anomaly, however, can also be the result of compact geological units known to exist in the region. The high P-wave velocity areas can be related to the compact and brittle fragments of the main fault zone, which can nucleate moderate earthquakes. The negative S-wave velocity perturbations are seen to lie nearly along the E-W direction near Askale, Dumlu, Hinis, Ilica, Karliova, Narman and Soylemez. The high Vp/Vs ratios (>1.85) are calculated in Askale, Karliova, Ovacik, Soylemez and Tortum regions, while the low Vp/Vs ratios (<1.65) are observed in Cat and Kirik regions (Fig. 10).
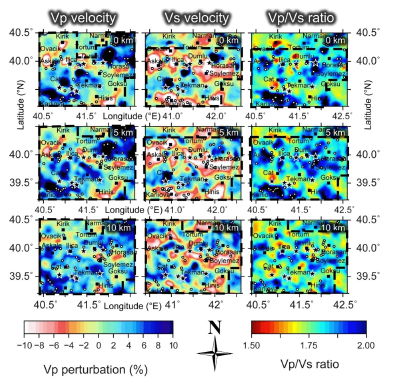
Figure 10 The Vp, Vs perturbation and the Vp/Vs ratio tomographic horizontal section results for Erzurum area and its surroundings. The black dashed lines and black stars represent well-resolved areas and geothermal areas, respectively.
In the surficial layer, there are some negative P-wave velocity anomalies, especially in Kirik, Askale, Ilica, west part of Dumlu, SE part of Hinis; however, strong positive P-wave velocity zones are observed in Horosan, east part of Dumlu, Tekman, Cat and Karliova; from North to South. The 5 km horizontal P-wave velocity characteristics are similar to the surficial layer. The NE-SW direction positive P- wave values indicate predominant traces of the NEAFZ. At 10-km depth, the distribution of negative Vp and Vp/Vs values differ from those found at 0 km and 5 km layers. Vp, Vs and Vp/Vs anomalies are more homogeneous when compared with the shallower depths. Some parts of negative S-wave velocity structure are detectable in Hinis, Horasan, Soylemez regions due to local fault zones. Investigation of horizontal layers is terminated at 10 km's, because this study concerns the exploitable geothermal potential in the region (Fig. 10).
The vertical cross-sections of tomographic images is the first high-resolution 3-D velocity structure down to 30 km for Erzurum region, where complex seismic velocity changes are expected due to the compressional tectonic regime and geology (Fig. 2). Since the lack of deep earthquakes (below 30 km) limit the resolution at depths, the profiles are determined down to 30 km depth. Nine vertical profiles from south to north direction for the Erzurum basin were prepared (Figs. 11 and 12) with approximately 28 km interval. The basin structure can be traced down to 3 km in the vertical profiles of absolute P wave velocity. The Vp velocities vary from 4.0 to 4.5 km/s, while Vp/Vs ratios between 1.5 and 2.0. Dominant low (<1.65) and high (>1.85) Vp/Vs ratio structures are observable down to 5 km. Higher velocities (>6.0 km/s) in this layer are mainly observed in high elevation areas or around compact metamorphic and igneous rock units. The low Vp (<4.5 km/s) and the low Vp/Vs (<1.65) values are detectable in Profile-C and Profile-D around Kirik located in the N part of Ovacik (Figs. 11 and 12). Sections considered among vertical depth cross high Vp/Vs values and low Vp structures were observed in the shallow layers. This type of anomaly can be detected at Yedisu (Profile-A), Kaynarpinar and Askale (Profile-B), Cimenozu, Kaplica and Ovacik (Profile-C), Yigitler (Profile-D), E part of Icmeler (Profile-E), Koprukoy and Uzunahmet (Profile-F), Budakli, Soylemez and Koprukoy (Profile-G), Gunduzu, Karayazi and Icmesu (Profile-H), E part of Horasan and Kaynak regions (Profile I) in the Figs. 11 and 12.
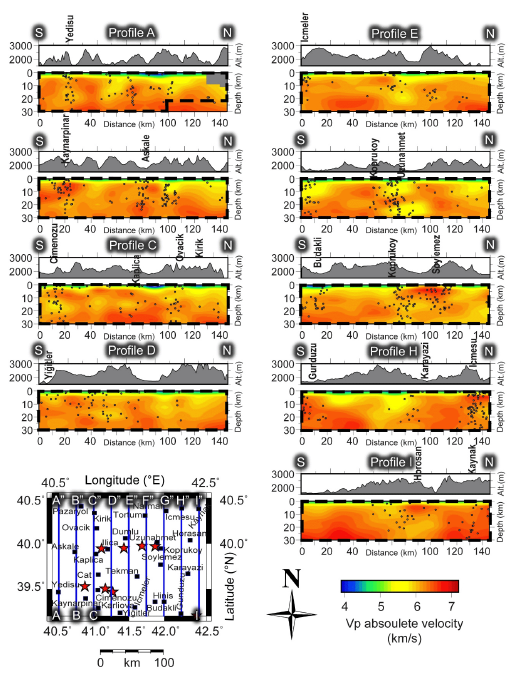
Figure 11 Depth cross-sections of absolute P-wave velocity. The thick blue lines on the map show traces of the cross-sections. The red stars display the location of known geothermal areas. The black dashed lines represent well-resolved areas.
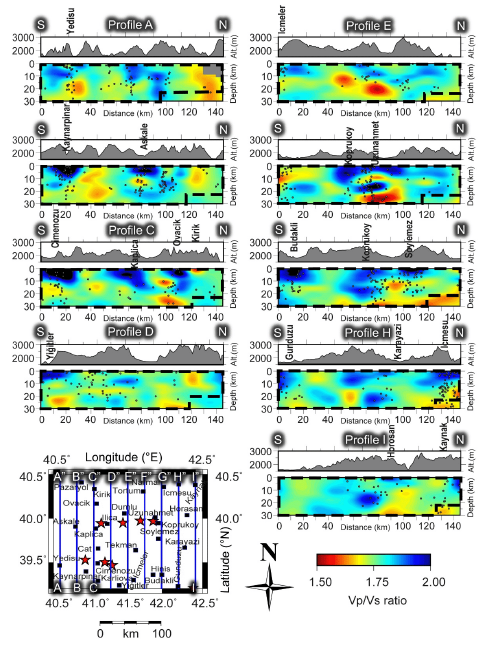
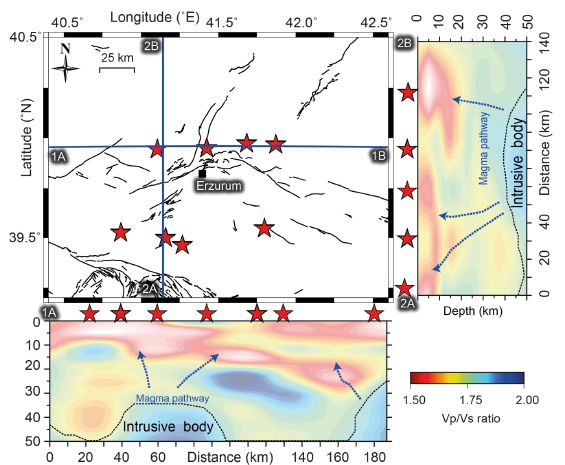
Figure 12 Depth cross-sections of Vp/Vs models with values ranging from <1.65 to >1.85 down to 30 km depth. The thick blue lines show the traces of the cross sections. The red stars display the location of known geothermal areas. The black dashed lines represent well-resolved areas.
The magmatic contact marks in the vertical profiles moving from deep to the surface take attention in the middle crust. Depending on the compression tectonics in the region, the effect of the magmatic materials moving from deep to surface is also seen in the middle crust. P wave velocities in this area range from 5.25 to 6.25. It is considered that the high Vp values observed between 5-15 km in the vertical section are related to the earthquake activity.
The source depths in the available data set do not provide sufficient ray coverage to permit adequate resolution below 30 km for an accurate tomography; therefore, the profiles are truncated at 30 km depth. The computed velocity models indicate that the mid-crustal solidified intrusive materials (higher Vp and Vp/Vs values) are located below the earthquake swarm zone (Khrepy et al. 2015; Mahesh and Gupta 2016).
6. Discussions
We developed the upper crustal velocity model of Erzurum and its surroundings by performing a 3-D local tomographic inversion technique using a set of high quality local events from 2007 to 2017. The tomographic images help us to understand the structure of the hydrothermal field and tectonic structure. Previous studies (e.g., Hauksson 2000; Baris et al. 2005; Ozer and Polat 2017a; b; Ozer et al. 2018) suggest that the changes in the Vp/Vs ratio are extremely dependent on the presence of pores. Particularly, an increase in the Vp/Vs ratio is associated with the existence of liquid materials, lower values point out to the existence of gas, CO2 or a mixture of them (e.g., Hauksson 2000; Kaypak and Gokkaya 2012; Ozer and Polat 2017a; b; Ozer et al. 2018). Some weak geologic units cause reduced velocities, particularly in S-waves (Vs). The high Vp/Vs values may indicate the presence of water saturated rocks or high pore pressure in the shallow layers.
Gokalp (2012) reported that the high velocity values are mainly parallel to the tectonic units in the Eastern Anatolia, especially at shallow depths. Conversely, the low P wave velocity regions are presumably more ductile and weaker which provide evidence for aseismic slip (Zhao et al. 2005).In the study area, compact metamorphic and magmatic units were reported in Dumlu, Horasan and Tekman, while loose sedimentary units were observed in Askale, Cat, Hinis, Kandilli, Karliova, Ilica and Tekman are also surrounded by many active faults (Akbas et al. 2013; Emre et al. 2013; Emre et al. 2018). Moreover, some volcanic (NE) and basalt (SW) materials are placed along the NEAFZ (Kocyigit and Canoglu 2017). Some researchers (Zhao et al. 2005; Gokalp 2012; Mahesh and Gupta 2016) reported that some rigid part of faults exhibit positive P wave velocity compared with the other parts of the study areas. These geological features can explain the positive P-wave velocities computed in the NE-SW direction in the study area (Fig. 10).
Generally, horizontal tomographic sections are homogenized towards deeper parts (Ozer and Polat 2017a, b).It is observed that the crust (< 30 km depth) under Erzurum and near surroundings is a high velocity unit, which can be related to the distribution of igneous, metamorphic and compact bodies as reported in Kocyigit and Canoglu (2017). All computed P-wave velocities lower than 4.5 km/s, in the vicinity of Erzurum, can be considered as low Vp values. Lithologically, the low Vp values particularly in shallow layers down to 3 km are to be related to the sedimentary materials of the Erzurum basin. The P-wave velocity of the bedrocks can be estimated as ~5.5 km/s, therefore by the Vp profile, the basement of Erzurum basin could be traced. Active geothermal regions (Hauksson 2000; Kaypak and Gokkaya 2012) indicate that the gas dominated units lead both Vp and Vp/Vs ratio to reduce (Hauksson and Haase 1997). The gas can consist of steam, CO2 or a mixture of them. In such cases, both Vp and Vp/Vs ratios reduce together. Kaygusuz et al. (2008) reported in the study carried out in and around Erzurum that the volcanic units around the fault zones were formed as a result of moving the metasomatized lithospheric mantle-derived material from deep to the surface layers. In this study, the high Vp/Vs structures are associated with the low S wave velocities and evaluated as highly saturated, fractured and high pore-pressure volumes (Kaypak and Gokkaya 2012).
Khrepy et al. (2015) reported that the highVp values in the middle crust were observed in the field where earthquake clusters were formed due to compression tectonics. High Vp velocities can be observed in the areas where hypocenters form an almost vertical structure, due to the compression caused by the upward movement of the magmatic material along the zones of weakness. The weak lower crust, which probably symbolizes magmatic intrusions, forms a thick viscous structure that separates from the brittle-elastic middle crust. It is thought that the mantle-derived magma chamber intrudes into the lower crustal layers, along the paths to display higher velocity.
6.1. The Origin of Geothermal Fluids
It is emphasized that the geothermal potential of the region in the geochemical studies carried out in Erzurum and its surroundings (Bayraktutan et al. 1996; Yuce and Taskiran 2013; Kilic and Inceoz 2015; Kaygusuz et al. 2018). Bayraktutan et al. (1996) reported signs belonging to the hot spring water in the studies carried out on active faults in Erzurum and its surroundings. Yuce and Taskiran (2013) found that the thermal waters had deep mantle traces and these waters were magmaic based, as a result of the analysis of gas and water samples taken from thermal waters with the temperature of 57 degrees.
Kaygusuz et al. (2018) reported that magmatic materials were transported along active tectonic units in the study carried out by Kandilli and its vicinity. This study brings a new perspective regarding the origin of Vp/Vs anomalies. Their spatial variation can be interpreted as pathways of thermal-fluids from the middle crust to the shallower layers in the Erzurum geothermal area (Hauksson, 2000). We propose that the intrusive body is a part of the fluid pathway from the upper mantle to geothermal areas at the surface. Besides, we estimate that the hot fluid flow can be controlled by a thermal anomaly associated with the solidified intrusion; if the cooling process is not complete. The results suggest that the magma movements continue to occur below the geothermal areas of Erzurum and its surroundings. Even though the crust-mantle boundary cannot be estimated because of poor resolution below 30 km, geothermal heat transport system is presumably related to the partial melting or upwelling of the upper mantle materials (Fig. 13).
7. Conclusion
Vp anomalies from 0 to 5 km point out to the fluid content beneath major geothermal areas. Such possible geothermal reservoirs are determined in, Askale, Cimenozu, Icmesu, Kaplica, Koprukoy, Karayazi, Kaynak, Ovacik, Soylemez and Uzunahmet regions. It is suggested that is necessary to carry out detailed studies on local scale in order to reveal the hot water potential in these areas.
In this study, the LET method has been used for the first time around the city of Erzurum to show a detailed velocity model and Vp/Vs variations, which are usually associated with lithological and petrological features. The principal aim of this study is to determine the 3-D P-wave velocity and Vp/Vs profile of the Erzurum geothermal area down to 30 km depth. Tomographic images computed by a merged data set from the local stations (ATANET) and the national network of Turkey (AFAD) were presented. 1685 well-located earthquakes, recorded in the period 2007-2017, were used for tomographic computations. The computations were benchmarked by strict synthetic vertical and horizontal checkerboard tests that indicate a good resolution down to 30 km depth.
The results of tomographic inversion have shed light on the complex crust under Erzurum. The basin structure is traceable down to 3 km depth in the P-wave velocity models. The high P-wave velocity (>6.0 km/s) zones in the shallower depths are usually associated with the metamorphic and magmatic compact materials. Steam, CO2 and gas or a mixture of them can be concluded in low Vp, and low Vp/Vs structures. Kirik and the N part of Ovacik region are symbolized by low Vp/Vs and low Vp. The high Vp/Vs (>1.85) with low

