


 Inglês (pdf)
 Artigo em XML
 Referências do artigo
 Enviar este artigo por email
 Citado por SciELO
  Citado por Google
  Similares em
SciELO
Similares em
SciELO  Similares em Google
 Permalink
Introduction
Calving ease is one of the most economically significant secondary traits (Dematawewa and Berger, 1997), which measures the presence or absence of dystocia and its intensity. Dystocia, defined as a prolonged or difficult parturition, affects the profitability of herds, animal welfare, and acceptability of the production system by the consumer (Carnier et al., 2000). Not only does calving difficulty increase farm workload, it also has adverse effects on the subsequent survival, health, and performance of mothers and offspring (Dematawewa and Berger, 1997; Lombard et al., 2007; Tenhagen et al., 2007; Barrier and Haskell 2011). Calving difficulty impaired milk production of dairy cows in terms of cow’s milk production and saleable milk yields, highlighting impaired income for dairy producers as well as detrimental effects on the productivity of the cows (Barrier and Haskell, 2011). Dystocia can negatively affect reproductive traits, such as days open (DO) or number of services per pregnancy (Dematawewa and Berger, 1997). Moreover, reproductive performance of the dam in the first lactation worsened following a difficult calving, with increased days to first service (DFS), number of services needed to conceive and a prolonged CI (Eaglen et al., 2011). Calving ease is influenced by both direct and maternal genetic effects. Most studies have shown a negative genetic correlation between direct and maternal effects for dystocia (Lopez de Maturan et al., 2007; Heringstad et al., 2007; Cevvantes et al., 2009; Eaglen and Bijma, 2009; Mujibi and Crews, 2009), while others have reported a positive correlation (Wiggans et al., 2003; Hansen et al., 2004).
Routine genetic evaluation of categorical traits such as fertility and calving traits is mostly based on linear models. The Interbull guidelines (Interbull, 2001) stated that an animal model is better than a sire model and a multiple-trait model is better than a single-trait model. Genetic parameters have been estimated for dystocia (Abdullahpour et al., 2006; Eghbalsaied et al., 2012), productive (Ghavi Hossein-Zadeh, 2011) and reproductive traits (Toghiani-Pozveh, 2009; Ghavi Hossein-Zadeh and Ardalan, 2010; Ghavi Hossein-Zadeh, 2011; Ghiasi et al., 2011) in Iranian Holstein cows. Nevertheless, the estimates of genetic correlations between dystocia and performance traits were scarce in the literature. Therefore, the aim of this study was to estimate direct and maternal genetic parameters for calving ease (CE) and its relationship with productive and reproductive traits in Iranian Holstein cows.
Materials and methods
Data set
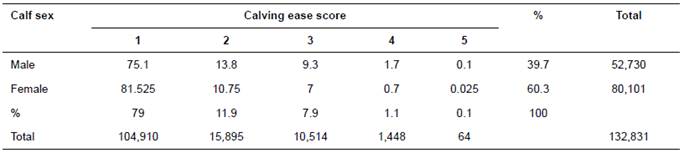
Data consisted of 132,831 first parity calving ease (CE) score, 183,203 records of production including 305-d adjusted milk yield (MY305), 305-d adjusted fat yield (FY305) and 305-d adjusted protein yield (PY305), and 129,199 records of reproductive traits including days to first service (DFS), days open (DO) and calving interval (CI) records from 1,470 herds. Data were collected by the Animal Breeding Center of Iran from 1991 to 2011. The pedigree information used in this study was extracted from the database used for the national genetic evaluation of dairy herds in Iran, which was provided by the Animal Breeding Center of Iran and contained 1,267,754 animals with 10,573 sires. Calving ease was classified into 5 categories depending on parturition situation (1 = normal, no problem; 2 = slight help, minor problem; 3 = needed assistance, major problem; 4 = considerable force, mechanical or laborer’s assistance; 5 = caesarean, very difficult). The distribution of CE scores is summarized in Table 1 separately by sex of calf. Approximately 25% of the male calves were born with different degrees of difficulty (scores 2, 3, 4, and
5) as compared to only 18% for the female calves. However, approximately 79% of calves were born without difficulty (score 1).
For editing CE data, animals without dystocia score were removed from the data. Also, calves with unknown birth weight, sex and type of birth were removed. Finally, calves with birth weight less than 23 or greater than 57 Kg, and dam with gestation length outside of 260-290 days were excluded. For production traits, cows were required to have a minimum of 100 days in milk (DIM) before culling and at least 1,000 Kg of total lactation milk yield to be included in the analysis. For reproductive traits, records outside of the range 30-300 days for DFS, 45-350 days for DO and 300-600 days for CI were excluded. For all data, cows with first calving before 20 months or after 40 months of age were excluded, and at least 5 uncensored records were required per herd-year groups.
Statistical analyses
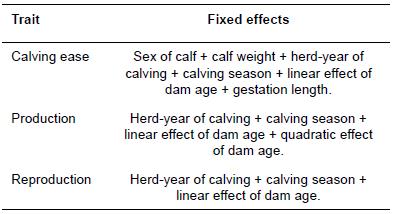
For all models, the GLM procedure of SAS (SAS Institute Inc., Cary, NC, USA; 2002) was used to select fixed factors which had significant effects on the traits under study. Table 2 gives the information of fixed effects fitted in the statistical models of analysis. Two different univariate models were used for the analysis of data which were differed by including direct genetic effect (model 1) and direct + maternal genetic effects (model 2). Linear animal models were used for the analysis of CE (models 1 and 2), productive (model 1) and reproductive (model 1) traits.
Model 1: y = Xb + Z d d + e
Model 2: y = Xb + Z d d + Z m m + e
Where:
y = is the vector of observations for CE score, MY305, FY305, PY305, DFS, DO, or CI.
b = is the vector of fixed effects.
X, Z d and Z m = are incidence matrices linking observations to fixed, direct random and maternal random genetic effects, respectively.
d and m = are vectors of direct and maternal genetic effects, respectively.
e = is the vector of random residual effects.
Bivariate linear animal models were used for the analyses of CE-MY305, CE-FY305, CE-PY305,
CE-DFS, CE-DO, and CE-CI. The bivariate models were as follows:

Where:
y i = is the vector of CE score.
y j = is the vector of observations for MY305, FY305, PY305, DFS, DO, or CI.
X i and X j = are incidence matrices linking observations to fixed effects.
Z di and Z dj = are incidence matrices linking observations to direct random effect.
b i and b j = are vectors of fixed effects for CE score and MY305, FY305, PY305, DFS, DO, or CI, respectively.
Z mi and Z mj = are incidence matrices linking observations to random maternal genetic effect.
d i and d j = are vectors of direct genetic effects.
m i and m j = are vectors of maternal genetic effects.
e i and e j = are vectors of random residual effects.
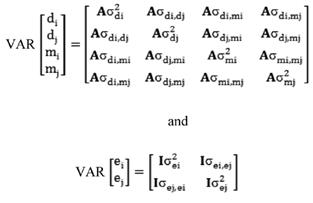
In model 2, the variances were as follows:
Where:
A = is the relationship matrix. I = is the identity matrix.

 and = are direct additive variances for
ith
and
jth
traits, respectively.
and = are direct additive variances for
ith
and
jth
traits, respectively.

 and = are maternal additive variances for
ith
and
jth
traits, respectively.
and = are maternal additive variances for
ith
and
jth
traits, respectively.
 = is covariance between direct effects of
ith
and jth traits.
= is covariance between direct effects of
ith
and jth traits.
 = corresponds to covariance between direct and maternal effects of
ith
trait.
= corresponds to covariance between direct and maternal effects of
ith
trait.
 = corresponds to covariance between direct effect of
ith
trait and maternal effect of jth trait.
= corresponds to covariance between direct effect of
ith
trait and maternal effect of jth trait.
 = corresponds to covariance between direct effect of the
jth
trait and maternal effect of
ith
trait.
= corresponds to covariance between direct effect of the
jth
trait and maternal effect of
ith
trait.
 = corresponds to covariance between direct and maternal effects of
jth
trait.
= corresponds to covariance between direct and maternal effects of
jth
trait.
 = corresponds to covariance between maternal effects of the
ith
and jth traits.
= corresponds to covariance between maternal effects of the
ith
and jth traits.

 and = are random residual variances for
ith
and
jth
traits, respectively.
and = are random residual variances for
ith
and
jth
traits, respectively.
 = corresponds to covariance between random residual effects of
ith
and jth traits.
= corresponds to covariance between random residual effects of
ith
and jth traits.
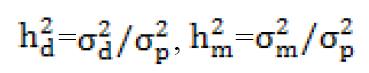
Direct and maternal heritabilities were computed as follows:
and 
 and
and  = are direct and maternal heritabilities, respectively.

 = are direct and maternal additive variances, respectively.
σdm = is covariance between direct and maternal effects.
 = is random residual variance.
 = is phenotypic variance.
Genetic correlations between direct and maternal effects of ith trait were obtained from
 =
=
Genetic correlations between direct effects of the ith and jth traits were obtained from
 =
=
Genetic correlations between direct effects of the ith trait and maternal effects of jth trait were obtained from:
 =
=
(Co)variance components were estimated using AI-REML algorithm of the MATVEC program (Wang et al., 2001).
Results
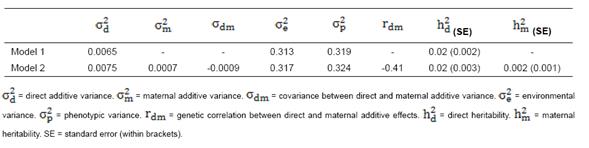
Summary statistics for productive and reproductive traits are shown in Table 3. Also, estimated variance components and heritabilities for CE obtained from univariate analysis are shown in Table 4. Heritability estimates for CE were relatively small as 0.02 in Model 1 and, 0.02 and 0.002 for direct and maternal heritabilities in Model 2, respectively. Estimated variance components and heritabilities with their standard errors for MY305, FY305, PY305, DFS, DO, and CI obtained from univariate analysis are shown in Table 5. The heritability estimates for DO, DFS and CI in Model 1 were 0.04, 0.03 and 0.04, respectively.
Table 3 Summary statistics for 305-d adjusted milk yield (MY305), 305-d adjusted fat yield (FY305), 305-d adjusted protein yield (PY305), days open (DO), days to first service (DFS), and calving interval (CI) in Iranian Holsteins.
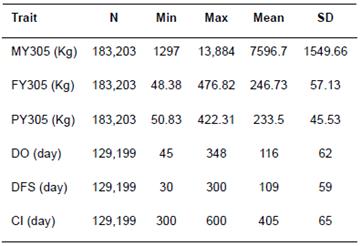
N = number of observations; Min = minimum; Max = maximum; SD = standard deviation.
Table 4 Estimates of variance components, heritabilities (h2) and genetic correlation between direct and maternal effect (r) of calving ease (CE) obtained from univariate analysis.
Heritability estimates for FY305 were 0.18 in Model 1 and 0.19 and 0.01 for direct and maternal genetic effects, respectively, in Model 2. Heritability estimates for PY305 were 0.23 in Model 1 and 0.24 and 0.01 for direct and maternal genetic effects in Model 2, respectively. Heritability estimate for DO in Model 1 was 0.04 and direct and maternal heritabilities were 0.04 and 0.0007 in Model 2, respectively. Heritability estimate for DFS was 0.03 in Model 1, but corresponding analyses for Model 2 did not converge. Heritability estimate for CI was 0.03 in Model 1, but Model 2 did not converge.
Heritability estimates obtained from bivariate analysis for CE, MY305, FY305, PY305, DFS, DO, and CI are presented in Table 6. Estimates of heritabilities for CE in the analyses of CE-FY305 and CE-PY305 were 0.03 in Models 1 and 2 for both analyses. However, estimates of heritabilities for CE in the analysis of CE-MY305 were 0.001 in Model 1 and 0.03 in Model 2. Maternal heritability estimates for CE in analyses of CE-MY305, CE-FY305, and CE-PY305 were very low as 0.001, 0.0004 and 0.0005 in Model 2, respectively.
Estimates of direct heritabilities for CE in the analyses of CE-DO, CE-DFS, and CE-CI were similar (0.02) in Model 1, and 0.03 for direct genetic effect in Model 2 in the analysis of CE-DO. It is noteworthy, analysis of CE-DFS and CE-CI in Model 2 did not converge. Heritability estimates for MY305 was 0.34 in Model 1 and direct and maternal heritabilities of MY305 were 0.25 and 0.008 in Model 2, respectively.
Genetic correlation estimate between direct and maternal effects of CE in model 2 obtained from univariate analysis (Table 4) was -0.41. Tables 7 and 8 show genetic correlation estimates between direct and maternal effects of CE, productive and reproductive traits obtained from bivariate analysis. Estimates of genetic correlations between direct and maternal effects of CE at all analyses in Model 2 including CE-MY305, CE-FY305, CE-PY305, and CE-DO were -0.38, -0.43, -0.45, and -0.36, respectively. Also, genetic correlation estimates between direct and maternal effects of MY305, FY305, PY305, and DO in Model 2 were negative and moderate.
Estimates of genetic correlations between CE and MY305 in this study were favorable and high (-0.99) in Model 1, but low (-0.20) in Model 2 for direct genetic effects. Estimates of genetic correlations between CE and FY305 were 0.02 in Model 1 and -0.02 in Model 2 for direct genetic effects. Genetic correlations between CE and PY305 were favorable and were -0.07 in Model 1 and -0.13 in Model 2 for direct genetic effects. In addition, strong and positive correlations estimated between maternal genetic effect of CE and direct genetic effects of MY305, FY305, and PY305 (0.83, 0.67, and 0.87, respectively). Genetic correlation estimates between CE and reproductive traits were unfavorable, although they were very small in Models 1 and 2 for direct genetic effects. The correlations between CE with DO, DFS and CI were -0.05, -0.002 and -0.06, in Model 1, respectively, and was -0.04 between CE and DO for direct genetic effects in Model 2.
Table 5 Estimates of variance components and direct heritabilities for 305-d adjusted milk yield (MY305), 305-d adjusted fat yield (FY305), 305-d adjusted protein yield (PY305), days open (DO), days to first service (DFS), and calving interval (CI) obtained from univariate animal model in Iranian Holsteins.
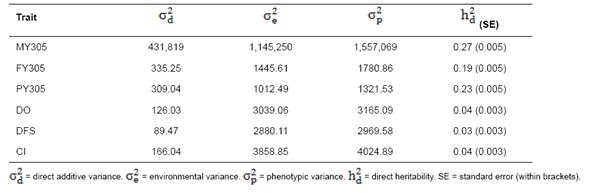
Table 6 Direct () and maternal ( ) heritability estimates for calving ease (CE), 305-d adjusted milk yield (MY305), 305-d adjusted fat yield (FY305), 305-d adjusted protein yield (PY305), days open (DO), days to first service (DFS), and calving interval (CI; standard errors are within brackets) obtained from bivariate analysis in Iranian Holsteins.
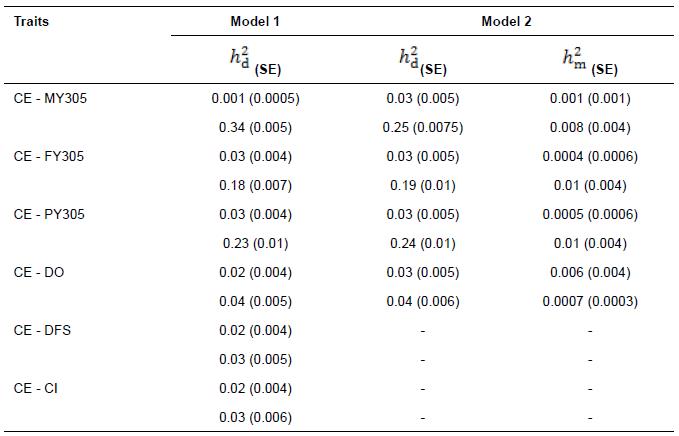
Table 7 Genetic correlation estimates between calving ease (CE) and 305-d adjusted milk yield (MY305), 305-d adjusted fat yield (FY305), 305-d adjusted protein yield (PY305), days open (DO), days to first service (DFS), and calving interval (CI) obtained from bivariate analyses in Iranian Holsteins.
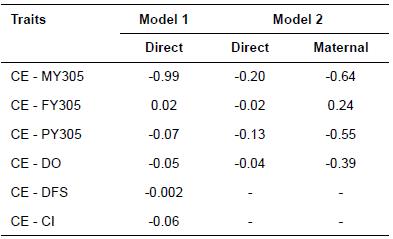
Table 8 Genetic correlation estimates between direct (d) and maternal (m) effects of calving ease (CE) and 305-d adjusted milk yield (MY305), 305-d adjusted fat percent (FY305), 305-d adjusted protein percent (PY305), days open (DO), days to first service (DFS), and calving interval (CI) obtained from bivariate analyses in Iranian Holsteins.
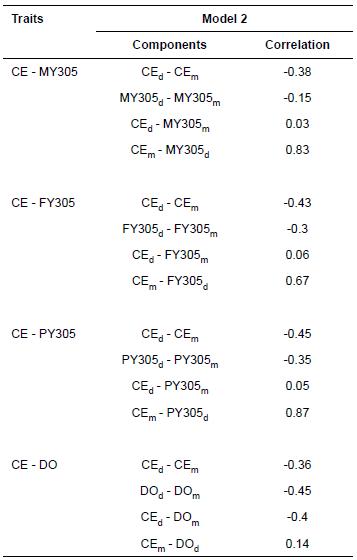
CEd = direct additive genetic effect of calving ease (CE). CEm = maternal additive genetic effect of calving ease (CE). MY305d = direct additive genetic effect of 305-d adjusted milk yield (MY305). MY305m = maternal additive genetic effect of 305-d adjusted milk yield (MY305). FY305d = direct additive genetic effect of 305-d adjusted fat yield (FY305). FY305m = maternal additive genetic effect of 305-d adjusted fat yield (FY305). PY305d = direct additive genetic effect of 305-d adjusted protein yield (PY305). PY305m = maternal additive genetic effect of 305-d adjusted protein yield (PY305). DOd = direct additive genetic effect of days open (DO). DOm = maternal additive genetic effect of days open (DO)
Discussion
In general, the averages of DO and CI were within he range of values reported in some studies (Gonzalez- Recio and Alenda, 2005; Zink et al., 2011), the average of DFS in the current study was greater than corresponding averages reported by other researchers (Andersen-Ranberg et al., 2005; Sun et al., 2010; Ghavi Hossein-Zadeh and Ardalan, 2010; Zink et al., 2011). The univariate estimates of CE heritability were slightly greater than those reported by Alday and Ugarte (1997) and Lee et al. (2003) in Holsteins, and were similar to estimates reported by Niskanen and Juga (2003) in Ayrshire dairy cows for direct heritability, and smaller than those reported by Abdullahpour et al. (2006) and Eghbalsaied et al. (2012) in Holsteins, Carnier et al. (2000) and Albera et al. (2004) in Piemontese, Gutierrez (2006) in Asturiana de los Valles beef cattle, and Mujibi and Crews (2009) in Charolais for direct and maternal heritabilities. Generally, the heritability estimates for MY305, FY305, and PY305 in Model 1 were in agreement with those reported by Ghavi Hossein-Zadeh (2011) in Iranian Holsteins. Estimates of heritabilities for reproductive traits obtained from model 1 were in agreement with those reported by Gonzalez-Recio and Alenda (2005) and Gredler et al. (2007) for DO and CI, and by Koeck et al. (2010) in Austrian Fleckvieh (Simmental) dual-purpose cattle for DFS.
The bivariate estimates of heritabilities for CE were similar to estimates reported by Lee et al. (2003). The heritability estimate obtained in Model 1 was lower than the estimates obtained by other researchers, and was much lower than expected, which can be affected by high levels of milk production data. Estimates of maternal heritability for CE in Model 2 were very lower than other reports. Estimates of direct heritabilities for CE in bivariate analysis with reproductive traits were in agreement with those reported by Niskanen and Juga (2003) in Finnish Ayrshire, Alday and Ugarte (1997) in Spanish Holsteins and Lee et al. (2003) in Holstein cows of Korea. Maternal heritability estimates for CE in the analysis of CE-DO was 0.006 which was again lower than values obtained by other researchers (Alday and Ugarte, 1997; Lee et al., 2003). This difference could be due to differences in the populations under study and the model used. The low estimate of heritability is due to low estimate of genetic variance and large amount of phenotypic variance. One reason could be due to the genetic differences between Iranian Holsteins and other dairy cattle populations in other countries. Another reason was related to the method of recording dystocia score and herd management in Iran which can lead to increasing phenotypic variance. Another cause of low heritability estimated for CE in this study than of other studies, may be related to differences in age of heifers in this study with other studies. It seems that with increasing age of dam, heritability estimate for this trait was reduced because estimates of heritabilities for CE in several studies for later parities were much lower than those in heifers (Luo et al., 2002; Lee, 2002; Albera et al., 2004; Eriksson et al., 2004).
Estimates of heritabilities for MY305 in Model 1 were similar to the estimates reported by Perez-Cabal and Alenda (2003), and in Model 2 by Lee et al. (2003), Gonzalez-Reeio et al. (2006) and Ghavi Hossein- Zadeh (2011). Estimates of heritabilities for FY305 obtained from Models 1 and 2 were slightly lower than those reported by Lee et al. (2003) and Ghorbani et al. (2011) in Iranian Brown Swiss crossbred dairy population, and similar to estimate reported by Ghavi Hossein-Zadeh (2011). Direct heritabilities for PY305 were in agreement with those reported by Ghavi Hossein-Zadeh (2011), and were lower than the estimates reported by Lopez de Maturana et al. (2007). Of course, Lopez de Maturana et al. (2007) obtained estimates using the Bayesian method, which could be a reason for the difference observed. Generally, the differences in parameter estimates could be attributed to various factors such as population history, data size and structure, the model of analysis used, breed and environmental effects (Ilatsia et al., 2007). However, maternal additive genetic effects of production traits have been ignored for genetic evaluation in several countries because of little contribution of their effects. Otherwise, in the current study, maternal genetic effects could contribute 3.1, 5, and 4 percentages of total heritabilities for MY305, FY305, and PY305, respectively. This result should indicate that additive maternal genetic effects were also important for genetic evaluation of production traits.
Direct heritability estimates for DO were in agreement with those reported by numerous studies (Dematawewa and Berger, 1998; Gonzalez-Recio and Alenda, 2005; Gredler et al., 2007; Zink et al., 2011). Maternal heritability estimates for reproductive traits are scarce in the literature. However, according to the estimates obtained in this study, it appears that a very small portion of the total heritability for reproductive traits was due to maternal effects. Estimate of Model 1 for DFS was slightly lower than those reported by Gonzalez-Recio and Alenda (2005), Liu et al. (2008) and Gredler et al. (2007), and was similar to those reported by Neuenschwander et al. (2005) and Andersen-Ranberg et al. (2005). However, estimate of heritability for CI was consistent with estimate reported by Gredler et al. (2007), and was near to the
0.04 obtained by González-Recio and Alenda (2005). All heritability estimates for reproductive traits were near to the estimated ones obtained in univariate analyses (Tables 5 and 6), and were lower than those reported by Toghiani Pozveh et al. (2009), Ghiasi et al. (2011) in different parities of Iranian Holsteins, and Sun et al. (2010) in the first lactation of Holstein cows in Denmark. However, estimates of heritabilities for reproductive traits were generally lower than 0.1 (Kadarmideen et al. 2003). These results are in agreement with previous studies. The low heritability estimates for reproductive traits in this study shows that these traits are to a large extent influenced by environmental and other herd management policies.
Genetic correlation estimate between direct and maternal genetic effects of CE obtained from univariate analysis was within the range reported in other studies (Carnier et al., 2000; Albera et al., 2004). Bivariate estimates of genetic correlation between direct and maternal genetic effects for CE were lower than the estimate reported by Lee et al. (2003), who reported a value equal to -0.63 between direct and maternal effects of CE using multiple trait analysis of CE, MY305, FY305, and DO; however, in most studies, this correlation was negative. For CE, corresponding estimates indicated that antagonistic relationships exist between calving ease as a trait of calf and as a trait of the dam and that, from a genetic point of view, female calves born more easily are expected to exhibit greater difficulties when giving birth as dams (Lee et al., 2003). This negative correlation would reduce progress from selecting for reduced dystocia if only direct effects were considered (Thompson et al., 1981).
Lee et al. (2003) and Lopez de Maturana et al. (2007; with other models) found a negative estimate for genetic correlation between CE and MY305. This result indicated that CE would influence low milk production at first parity. Although, estimates of genetic correlations between CE and FY305 were near to zero in this study; however, our results are in agreement with the results reported by Lee et al. (2003). Genetic correlations between CE and PY305 were reported positive and close to zero in the study of Lopez de Maturana et al. (2007). It is necessary to point out that the application of other methodologies and models in those studies might have affected the results. Negative genetic correlations between direct effects of CE with MY305 and PY305 represent a reduction in animal production performance after the incidence of dystocia. Lee et al. (2003) reported positive correlations between the maternal effect of CE and direct effects of MY305, and CE and FY305.
Given the negative correlation between direct effects of CE and production traits, these results confirm the negative correlation between direct and maternal effects of dystocia; although poor positive correlation between direct genetic effect of CE and maternal genetic effects of other traits was observed. Lee et al. (2003) reported that correlation between direct genetic effects of CE and DO in the absence of maternal effects was negative, but in the presence of maternal effects was positive. Negative correlation between direct effects of CE and reproductive traits, and positive correlation between maternal effect of CE and direct effect of DO, indicating the importance of maternal effects of dystocia in order to obtain reproductive progress, at least for DO.
The heritabilities of CE and reproductive traits were low, suggesting low efficiency of genetic improvement by direct selection, and that these traits are mainly influenced by management practices and other environmental factors. Genetic correlation estimates between direct and maternal effects of CE in all models were negative and relatively high, indicating that a selection index that includes both direct and maternal effects, might be the most efficient approach to increase CE. Genetic correlations between direct effects of CE with FY305 and fertility traits were close to zero, while this correlation was negative between CE and MY305. According to the current results, it is concluded that an improvement in CE can be obtained when selection is focused on MY305 only.

