


 English (pdf)
 Article in xml format
 Article references
 Send this article by e-mail
 Cited by SciELO
  Cited by Google
  Similars in
SciELO
Similars in
SciELO  Similars in Google
 Permalink
INTRODUCTION
An accurate diagnosis is essential to achieving higher nitrogen efficiency in crops, which considers the content in plants, the crop requirement and the spatial and temporal variability that occurs within fields to define the suitable e quantity and precise timing of applications. In Colombia, crop fertilization is done, in many cases, without technical criteria; sometimes soil chemical analysis is used, and, in only a few cases, plant tissue analysis is carried out for nutritional diagnosis. In the case of traditional laboratory analyses, the time between taking samples and delivering the results to farmers is long and affects the reliability of the diagnosis; on the other hand, the number of samples required to estimate the spatial and temporary variability in crops is large and increases costs significantly.
Nitrogen is one of the most important nutrients in agriculture because of the role it plays in growth and crop production and the amount that plants require. Nitrogen, as a component of chlorophyll, is essential for photosynthesis. It is also the basic element of plant and animal proteins, including the genetic material DNA and RNA, and is important in periods of rapid plant growth. In agriculture, nitrogen applications represent a significant percentage of production costs; therefore, decisions on application rate, timing and source are key to agricultural competitiveness and sustainability.
Estimating N contents in plants is fundamental for diagnoses that seek to improve the efficiency of fertilizer and diminish costs and environmental problems that result from excessive or widespread applications (Thompson et al., 2017). The use of sensors in agriculture represents significant progress, providing reliable and quick information on the condition of crops for use in timely input applications with appropriate amounts based on the pattern of variability in crops (Li et al., 2014; Martínez, 2017). Measurements of spectral responses are an important alternative for identifying plant nutritional status and aiding decisions on input applications and crop monitoring. Chlorophyll is a pigment that has a clear impact on the spectral responses of plants, mainly in the visible spectrum portion. N is a key element in chlorophyll, with a high correlation (Schlemmer et al., 2005). Knowledge on the relationship between spectral reflectance and chlorophyll content is an important alternative for making decisions on nitrogen supplies for crops.
Remote and proximal sensors are used in non-destructive techniques to provide data such as type of crop, chlorophyll content, nutritional and sanitary state, and water stress, among others. Spectral indices are used to detect changes in the physical or chemical properties of objects based on their reflected radiation (Wan et al., 2021). For nitrogen and chlorophyll content indicators, one of the more common indices is the Normalized Difference Vegetation Index (NDVI), which correlates with the amount of biomass, chlorophyll content and nitrogen content (Ranjan and Parida, 2020). There are other indexes for monitoring the nutritional status of crops, such as the Optimized Soil-adjusted Vegetation Index (OSAVI) and the Near-infrared/red Ratio (NIR/red), which minimize the effect of soil reflectance on vegetation responses, as compared to NDVI, the Modified Chlorophyll Absorption Ratio (MCARI) and the Near-Infrared/green Ratio (NIR/green), which are more responsive to the leaf chlorophyll content (Daughtry et al., 2000; Giraldo-Betancourt et al., 2020).
Another parameter used to estimate nitrogen and chlorophyll contents is red edge position (REP), which corresponds to the inflection point between 680 and 780 nm (Cho and Skidmore, 2006) or 680 and 750 nm in the spectral reflectance (Palka et al., 2021). There are several methods for calculating REP; one, based on linear interpolation (REP-L), has been used to estimate leaf chlorophyll and nitrogen contents in leaves (Guyot and Baret, 1988) because it is affected by the biochemical and biophysical characteristics of plants.
The chlorophyll and nitrogen contents in leaves have also been estimated using the green and red-edge chlorophyll indices, which are calculated with near infrared bands from 780 to 800 nm, green bands between 540 and 560 nm and the red-edge between 730 and 750 nm, with good coefficients of determination in canopy measurements (Schlemmer et al., 2013). Li et al. (2014) found that red edge-based indices presented coefficients of determination higher than NDVI when used to determine nitrogen concentrations and uptakes in maize plants in the V6 and V7 and V10-V12 stages. On the other hand, Yu et al. (2014) reported that the Ratio of Reflectance Difference Index (RRDI) was the best for estimating the concentration of chlorophyll with canopy measurements in a barley crop, explaining 76% of the variation in this content. The Transformed Chlorophyll Absorption Ratio Index divided by the Optimized Soil-Adjusted Vegetation Index (TCARI/OSAVI) was proposed by Wu et al. (2008) for avoiding the soil effect. Significant correlations have been reported for canopy reflectance in corn with N, protein content and yield (Wen et al., 2019; Elmetwalli and Tyler, 2020; Wang et al., 2021).
In several studies, indexes based on the spectral response of plants have been proposed for determining the nutritional status of plants (Martínez, 2017); however, according to Sims and Gamon (2002), in most cases, these indices have been tested for only few species. On the other hand, there is great variation in the results, depending on factors such as species, leaf type, measurements in leaves or canopies (Croft et al., 2014), phenological state, soil background effect, canopy structure and multiple scattering (Yu et al., 2014), so more research is needed to understand specific responses in particular cases.
In Colombia, studies have been carried out to identify crops using satellite imagery, but further research should be conducted to generate new data on each crop, such as the nutritional status, health status, and spatial and temporal variation within each crop field. This is important because modern agriculture requires the development of accurate and reliable crop monitoring techniques that provide data for making management decisions within crops, such as site-specific or precision agriculture. Therefore, the objective of this research was to establish the relationship between the spectral response of maize (Zea mays L.) and nitrogen and chlorophyll contents in leaves to identify vegetation indexes suitable for establishing the nitrogen status in maize crops.
MATERIALS AND METHODS
Study area
This research was carried out at the Taluma Experimental Station of AGROSAVIA, located in the municipality of Puerto Lopez (Meta, Colombia), with coordinates 4º22'38,50'' N and 72º13'24,53'' W, and an altitude of 156 m a.s.l. The soil is an acid, Loamy Fine Typic Haplustox, with <5% slope and low fertility (Colombia IGAC, 2004). The precipitation has a monomodal distribution with an annual average of 2,375 mm and a rainy season between April and November; the average temperature was 27ºC, and the relative humidity was 75%.
Data collection
An experiment with maize hybrid H-105 (Campuzano et al., 2014) was established in blocks with five nitrogen doses (0, 50, 100, 150 and 200 kg ha-1) and four replications. The spectral response was evaluated with a FieldSpec 4 (ASD, Malvern Panalytical, Boulder, CO, USA) spectroradiometer three times: at 36 (V8), 56 (R1) and 108 (MF) days after planting (dap), taking 2 plants per replicate and, within each plant, 3 leaves: one from the visible ligule, one above and one below. The spectral reflectance of the canopy was evaluated at 56 dap (R1 stage). The FieldSpec 4 provided data, taken at 1.4 nm intervals from 350 to 1,050 nm and at 2 nm from 1,000 to 2,500 nm, and was calibrated with a spectralon (Tab. 1).
Table 1. Times and variables evaluated.
| Maize phenological state | Measured variables | Number of data | Nitrogen dose (kg ha-¹) |
|---|---|---|---|
| V8, 36 days after planting | Nitrogen content (%), chlorophyll a, b and total content (mg L-1), spectral reflectance in leaves | 36 | 0, 200 |
| R1, 56 days after planting | Nitrogen content (%), chlorophyll a, b and total content (mg L-1), spectral reflectance in leaves and in canopy | 120 | 0, 50, 100, 150, 200 |
| MF, 108 days after planting | Spectral reflectance in leaves | 120 | 0, 50, 100, 150, 200 |
The foliar contents of chlorophyll a and b were determined in the laboratory using extraction with N, N-Dimethylformamide (DMF) and a subsequent reading with a spectrophotometer according to the method developed by Inskeep and Bloom (1985). The nitrogen content in the leaves was obtained with an elemental analyzer (Thermo Scientific Flash Smart Elemental Analyzer, Thermo Fisher Scientific, Waltham, MA, USA) with the direct combustion method proposed by Dumas in the Laboratorio de Suelos y Tejidos Vegetales of AGROSAVIA, Tibaitata Research Center (Mosquera, Colombia).
Data analysis
Table 2 shows the hyperspectral indices and calculations of the REP, which were used to estimate the contents of nitrogen and chlorophyll in the leaves. A box-plot analysis was carried out to identify outliers. When the number of data was less than 50, normality tests were used on the data with the Shapiro Wilk test. In all other cases, the Kolmogorov-Smirnov test was applied. Analysis of variance (ANOVA) was used for the variables that had normal distribution; for the others, a Chi square test was carried out to determine whether there were differences between the treatments. The reflectance data were smoothed using the Savitzky-Golay filter (Savitzky and Golay, 1964) with a second-order polynomial and a seven-band window. First and second derivatives were calculated. Other reflectance transformation data were tested, such as the Standard Normal Variate (SNV), to remove scatter effects, multi-collinearity (Barnes et al., 1993), and area normalization, which normalizes a spectrum Xi by calculating the area under the curve for the spectrum. The collinearity analysis was applied to reduce redundant data (Kleinbaum et al., 2014), Pearson linear correlation co/efficients were calculated, and regression analyses were carried out.
Table 2. Hyperspectral indexes and REP studied.
| Index, REP | Formula | Reference |
|---|---|---|
| Red edge chlorophyll index (CI red edge) |
|
Gitelson et al. (1996) |
| Normalised Difference Vegetation Index) (NDVI) |
|
Peñuelas et al. (1995) |
| Normalised Difference Vegetation Index (NDVI1) | Field measurement with GreenSeeker (Trimble) | Del Corso et al. (2013) |
| Photochemical reflectance index (PRI) |
|
Peñuelas et al. (1995) |
| Normalised Difference Nitrogen Index (NDNI) |
|
Serrano et al. (2002) |
| Transformed Chlorophyll Absorption Ratio Index/Optimised Soil-Adjusted Vegetation Index (TCARI/OSAVI) |
|
Wu et al. (2008) |
| Red edge inflection point. (Rre) |
|
Guyot and Baret, (1988) |
| Red-edge position linear interpolation (REP-L) |
|
Guyot and Baret, (1988) |
| Red-edge position linear extrapolation (REP-LE) |
|
Cho and Skidmore, (2006) |
| REP-Inverted Gaussian fitting technique (REP-IG) |
|
Miller et al. (1990) |
| REP-Polynomial fitting technique (REP-P |
|
Pu et al. (2003) |
RESULTS AND DISCUSSION
Spectral reflectance of maize leaves in three phenological stages
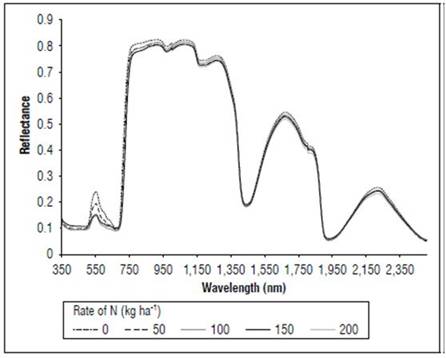
There were differences in the reflectance for all wavelengths between the phenological stages (Fig. 1). The highest reflectance values in the plants without N applications were found in the MF, which is a state near senescence. There was less reflectance in states V8 and R1. When comparing the reflectance in the three phenological states, the biggest difference was found between MF and the other two states. The largest difference occurred between 500 and 630 nm, corresponding to the visible spectrum (Fig. 2), and in the range of 740 to 1290 nm, which is part of the NIR (Fig. 1). In both cases, the plants in the MF state had higher reflectance, while the plants in V8 presented the lowest reflectance, and stage R1 presented intermediate values. A peak of high reflectance was found at 556 nm with values of 0.27 for the MF state, 0.21 for the V8 state and 0.24 for the R1 state. In the range of 680-780 nm (Fig. 3), differences in reflectance were more noticeable between 710 and 780 nm.
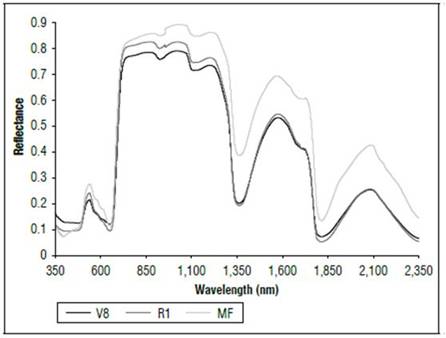
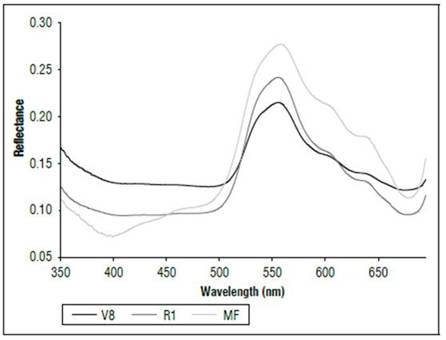
Figure 2. Reflectance (350 to 680 nm) of maize leaves without N applications in three phenological stages.
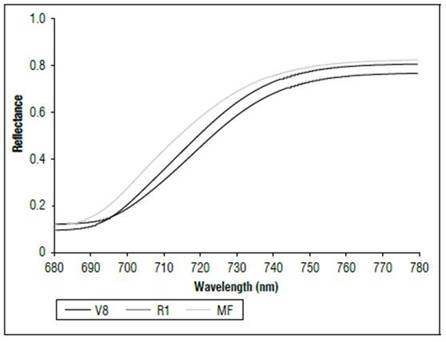
Figure 3. Reflectance (680 to 780 nm) of maize leaves without N applications in three phenological stages.
These results were probably related to the concentration of chlorophyll and the water content in the leaves. As the age of the crop increased, the reflectance increased, an effect possibly associated with a decrease in chlorophyll concentration and water content. Barker and Pilbeam (2015) reported a decrease in N concentrations in corn as the crop grew to maturity. Liang (2004) stated that the reflectance in the visible part of the spectrum is due to the type of pigments and their contents, mainly chlorophyll. Between 800 and 1,300 nm, the main effect is due to the structure of the cells, and, from 1,300 nm and higher, there are significant changes resulting from the water content in the plants. Feng et al. (2008) found that chlorophyll concentrations in wheat decreased and degraded rapidly as time increased, and lutein became a major component of the pigment that affected the absorption and reflection of radiation of plants.
Effect of N dose on chlorophyll and N concentrations and on leaf reflectance
Table 3 shows the effect of the N dose of 200 kg ha-¹ on the N and chlorophyll contents and on the spectral indices in stage V8. The average content of N, chlorophyll total, a and b, spectral indices, with the exception of TCARI/OSAVI, and REP values were lower in the control than in the treatments with N applications. The CI-red-edge, TCARI/OSAVI and PRI showed coefficients of variation greater than 40%; the other variables had low variation within the data set.
Table 3. Basic statistics of variables for stage V8 (n=36).
| Variable | Treatment | Mean | Median | Variance | Standard deviation | Min. | Max. | CV(%) |
|---|---|---|---|---|---|---|---|---|
| (kg ha-¹) | ||||||||
| N (%) | 0 | 1.43 | 1.43 | 0.02 | 0.14 | 1.13 | 1.63 | 9.80 |
| 200 | 2.48 | 2.27 | 0.55 | 0.74 | 1.33 | 3.52 | 29.70 | |
| Chl-b (mg L1) | 0 | 15.40 | 15.16 | 7.42 | 2.72 | 9.69 | 19.28 | 17.60 |
| 200 | 20.83 | 21.05 | 1.42 | 1.19 | 18.40 | 22.31 | 5.70 | |
| Chl-a (mg L1) | 0 | 9.48 | 9.33 | 2.81 | 1.68 | 5.96 | 11.87 | 17.60 |
| 200 | 12.82 | 12.96 | 0.54 | 0.73 | 11.33 | 13.73 | 5.70 | |
| Total-chl (mg L1) | 0 | 21.61 | 21.30 | 15.60 | 3.95 | 13.90 | 29.60 | 18.20 |
| 200 | 29.82 | 29.40 | 3.02 | 1.73 | 26.10 | 31.50 | 5.80 | |
| NDVI | 0 | 0.51 | 0.49 | 0.01 | 0.07 | 0.43 | 0.65 | 14.50 |
| 200 | 0.71 | 0.71 | 0.00 | 0.02 | 0.66 | 0.72 | 3.50 | |
| NDVI1 | 0 | 0.72 | 0.72 | 0.02 | 0.12 | 0.48 | 0.88 | 17.20 |
| 200 | 0.75 | 0.74 | 0.01 | 0.10 | 0.59 | 0.90 | 13.70 | |
| CI-red-edge | 0 | 3.30 | 3.12 | 2.39 | 1.55 | 1.14 | 6.39 | 46.80 |
| 200 | 4.65 | 3.80 | 4.79 | 2.19 | 2.15 | 8.68 | 47.00 | |
| TCARI/OSAVI | 0 | 0.15 | 0.17 | 0.00 | 0.06 | -0.04 | 0.19 | 44.00 |
| 200 | 0.03 | 0.13 | 0.04 | 0.19 | -0.35 | 0.19 | 58.10 | |
| REP-L | 0 | 720.60 | 720.38 | 3.30 | 1.82 | 716.70 | 722.90 | 0.25 |
| 200 | 724.10 | 724.33 | 0.51 | 0.71 | 723.10 | 725.30 | 0.10 | |
| REP-P | 0 | 693.20 | 692.93 | 40.99 | 6.40 | 682.60 | 702.40 | 0.92 |
| 200 | 704.30 | 703.87 | 39.98 | 6.32 | 693.30 | 715.60 | 0.90 | |
| REP-LE | 0 | 694.8 | 694.7 | 0.32 | 0.57 | 694.1 | 696.0 | 0.08 |
| 200 | 695.0 | 694.9 | 0.09 | 0.29 | 694.5 | 695.5 | 0.04 | |
| PRI | 0 | 0.02 | 0.02 | 0.00 | 0.01 | 0.00 | 0.04 | 74.00 |
| 200 | 0.03 | 0.03 | 0.00 | 0.02 | 0.00 | 0.06 | 55.10 |
For stages V8 and R1, the results of the Chi square test for the variables that were not normally distributed indicated that the NDVI had statistically significant differences between the treatments (P<0.05) but, for the TCARI/OSAVI, the differences were not significant. The ANOVA for the variables with normal distribution in V8 indicated that the REP-L, CI red-edge, chlorophyll a and b contents and nitrogen content showed significant differences between the treatments, while, for the REP-LE and NDVI1, no significant differences were found. For the R1 stage, there were significant differences between the treatments for the CI-red-edge, PRI, REP-L, REP-LE, REP-P, nitrogen, chlorophyll a, chlorophyll b, total chlorophyll, and N contents. The TCARI/OSAVI decreased as the N dose increased although no significance was found.
Table 4 shows the results of the Duncan's multiple range test for the R1 stage. Although the contents of leaf N, chlorophylls and REP values were higher as the N dose increased, not all of them showed significant differences between the treatments. The nitrogen content was significantly different in all treatments. Chlorophyll a had differences between four treatments. Chlorophyll b, total chlorophyll. REP-L, REP-P and REP-LE showed differences between the treatments with 0, 50 and 100 kg ha-¹ but not between the 100, 150 and 200 treatments.
Table 4. Duncan's multiple range test for stage R1 (n=120).
| Variable | 0 | 50 | 100 | 150 | 200 |
|---|---|---|---|---|---|
| N (%) | 1.41 a | 1.79 b | 2.37 c | 2.88 d | 3.13 e |
| Chl-A (mg L-1) | 4.64 a | 5.49 b | 7.29 c | 7.74 cd | 8.28 d |
| Chl-B (mg L-1) | 13.98 a | 15.7 a | 20.28 b | 20.86 b | 21.1 b |
| Total-chl (mg L-1) | 18.7 a | 21.0 b | 27.6 c | 28.5 c | 29.1 c |
| CI-red-edge | 3.42 a | 4.00 a | 5.54 b | 5.58 b | 5.63 b |
| PRI | 0.03 a | 0.03 a | 0.04 a | 0.04 a | 0.04 a |
| REP-L | 718.1 a | 720.8 b | 723.8 c | 724.5 c | 724.5 c |
| REP-LE | 715.6 a | 727.4 b | 743.8 c | 746.2 c | 747.1 c |
| REP-P | 714.9 a | 728.0 b | 746.0 c | 748.6 c | 749.6 c |
Row averages followed by the same letter for each analyzed characteristic did not differ at a level of 5% of probability using the Duncan's multiple range test.
Figure 4 shows the effect of the application of nitrogen on the reflectance of the leaves in the V8 state. The plants that received N 200 kg ha-1 had lower values of reflectance throughout the range of the measured spectrum. In the visible part of the spectrum, the maximum reflectance values were in the control with 0.20, as compared to 0.15 in the treatment with N 200 kg ha-1. In the red and near-infrared range, the principal differences were found between 700 and 760 nm.
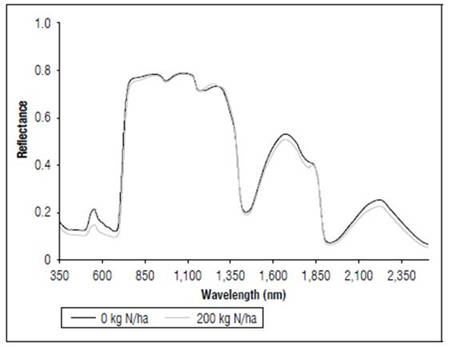
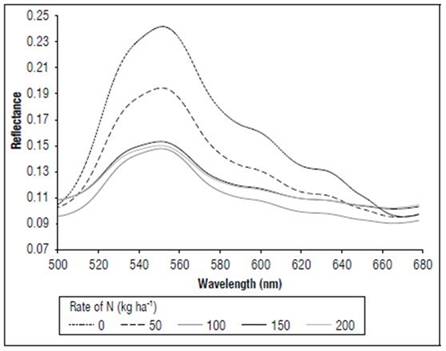
Figure 5 shows the effect of the N dose on the reflectance of the maize leaves in stage R1. The reflectance values were higher for N 0 kg ha-1 for the considered wavelengths, followed by the treatment with N 50 kg ha-1, and subsequently the other treatments with lower values. The main differences between the treatments (Fig. 6) occurred in the visible spectrum at wavelengths close to 550 nm, where a peak of maximum reflectance was observed with values of 0.24 for the control, 0.19 for the treatment with N 50 kg ha-¹ and 0.14 for the other doses.
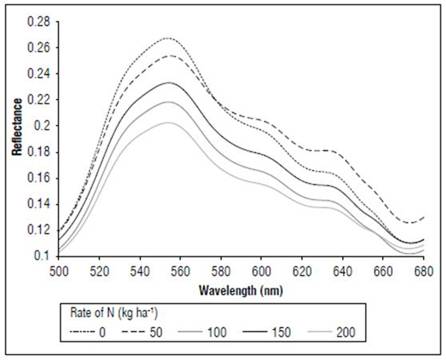
In the MF stage (Fig. 7), as in V8 and R1, more noticeable differences in the reflectance were found in the portion between 540 and 560 nm, with the control presenting higher values, with an average of 0.27, and the N 200 kg ha-1 treatment had lower reflectance, with an average of 0.20. All treatments showed higher reflectance values in the V8 stage than in R1.
Between 670 and 780 nm, differences in reflectance for the N treatments also occurred; higher values were found for 0, followed by 50, 100 and, finally, 150 and 200 kg ha-1. The first derivative of the reflectance between 670 and 780 nm showed the differences in the spectral responses, with greater clarity because of the effect of nitrogen fertilization. In the V8 stage (Fig. 8), treatments without N presented the maximum value of the first derivative, towards 715 nm. In R1 (Fig. 9), it was near 710 nm and, for MF, it was 701 nm (Fig. 10). For the treatment with N 200 kg ha-1, the maximum value of the first derivative was found at longer wavelengths, such as725 for V8, 728 nm for R1 and 720 nm for the MF stage. However, between the N treatments with 100 and 150 kg ha-1, the differences were minimal, indicating that, although the N dose increased, the response in this part of the spectrum changed very little. The points of the maximum value of the first derivative coincided with the wavelengths where the second derivative was equal to zero and corresponded to the inflection points.
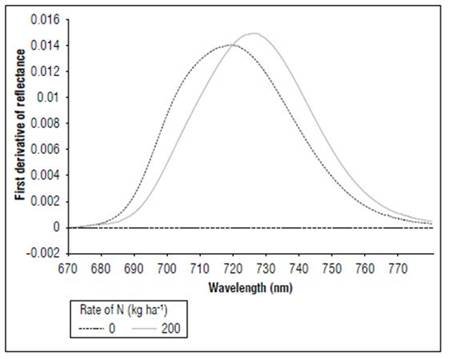
Figure 8. Effect of N dose in the first derivative of reflectance of maize between 670 and 780 nm for stage V8 (n=36).
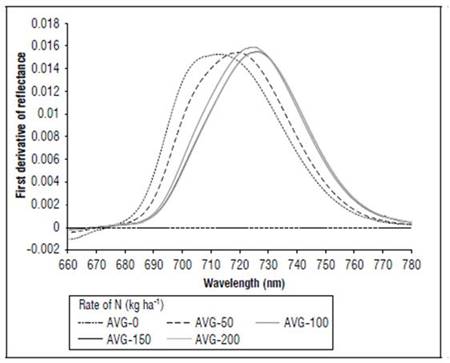
Figure 9. Effect of N dose in the first derivative of reflectance of maize between 670 and 780 nm for stage R1 (n=120).
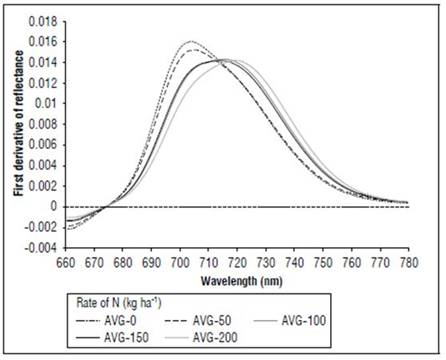
Figure 10. Effect of N dose in the first derivative of reflectance of maize between 670 and 780 nm for stage MF (n=120).
According to Dwyer et al. (1995), 50-70% of total maize leaf N is associated with chloroplast, and more N can increase leaf chlorophyll concentration, which absorbs more light and decreases the reflectance of visible wavebands. However, these authors stated that the relationship between chlorophyll and nitrogen content is not linear, which makes some indices better for estimating N content and others for chlorophyll. On the other hand, this study found that, although the N content increased with the applied fertilizer dose, chlorophyll b, which represented about 73% of the total chlorophyll, had a significant increase, up to N 100 kg ha-1, and was not significant afterwards.
Tables 5 and 6 present the Pearson correlation coefficients between the variables, which showed significance for stages V8 and R1. For V8 (Tab. 5) and R1 (Tab. 6), the chlorophyll content showed a highly significant correlation with the N content although, in the R1 stage, the coefficients were higher. For V8, these variables also had positive correlations with the REP-L, REP-P, NDVI, and CI-red-edge and negative correlations with the TCARI/OSAVI. For stage R1, the highest correlation coefficients (Tab. 6) were between the chlorophyll a, chlorophyll b, and total chlorophyll and the REP-LE, REP-L, and REP-P. The N content also presented highly significant correlations with these variables although with lower coefficients. The NDVI presented statistically significant coefficients although with lower values. When the analysis of the Pearson correlation was done with the spectral responses of the maize crop canopy (Tab. 7), the REP-L, REP-LE, NDVI and cl-red-edge presented higher significant correlations with N and chlorophyll contents.
Table 5. Correlation coefficients for some variables stage V8 (n=36).
| NDVI | NDVI1 | CI-red-edge | PRI | NDNI | TCARI/OSAVI | REP-L | REP-LE | REP-P | N (%) | |
|---|---|---|---|---|---|---|---|---|---|---|
| N | 0.63** | 0.42* | 0.57** | 0.58** | -0.14 | -0.55** | 0.63** | 0.16 | 0.67** | |
| Chl-a | 0.72** | 0.38* | 0.56** | 0.49** | -0.06 | -0.48** | 0.98** | 0.55** | 0.86** | 0.61** |
| Chl-b | 0.72** | 0.38* | 0.56** | 0.49** | -0.06 | -0.48** | 0.98** | 0.55** | 0.86** | 0.61** |
| Chl b+a | 0.72** | 0.45* | 0.60** | 0.52** | -0.06 | -0.49** | 0.98** | 0.55** | 0.87** | 0.63** |
* and ** correlation is significant at the 0.05 and 0.01 levels, respectively.
Table 6. Correlation coefficients for some variables stage R1 (n=120).
| N(%) | NDVI | REP-IG | CIred-edge | PRI | TCARI/ | REP-L | REP-LE | REP-P | |
|---|---|---|---|---|---|---|---|---|---|
| N | 0.75** | 0.73** | 0.35** | 0.21 | -0.41** | 0.74** | 0.77** | 0.77** | |
| Chl-a | 0.91** | 0.68** | 0.913** | 0.45** | 0.32** | -0.45** | 0.92** | 0.93** | 0.93** |
| Chl-b | 0.79** | 0.59** | 0.86** | 0.56** | 0.47** | -0.53** | 0.83** | 0.85** | 0.85** |
| Chl a+b | 0.84** | 0.63** | 0.90** | 0.55** | 0.45** | -0.53** | 0.87** | 0.90** | 0.90** |
* and ** correlation is significant at the 0.05 and 0.01 levels, respectively.
Table 7. Correlation coefficients for canopy reflectance stage R1 (n=20).
| REP-LE | PRI | CI-red-edge | NDVI | REP-L | |
|---|---|---|---|---|---|
| N | 0.673** | 0 | 0.572** | 0.789** | 0.730** |
| Chl-a | 0.805** | 0.478* | 0.704** | 0.812** | 0.857** |
| Chl-b | 0.747** | 0 | 0.570** | 0.719** | 0.766** |
* and ** correlation is significant at the 0.05 and 0.01 levels, respectively.
Figure 11 shows the results of the regression analysis for the indices that had higher R² values for the V8 and R1 stages. In stage V8 (Fig. 11 A, B, C, D), the REP-L had the best performance with an R² of 0.95 for the chlorophyll a and b contents and an R² of 0.46 for the nitrogen content. In the R1 stage, REP-LE (Fig. 11 E, F, G, H) had better coefficients of determination, with an R² of 0.86 for chlorophyll a, 0.73 for chlorophyll b, 0.80 for total chlorophyll and 0.64 for the nitrogen content. In this stage, REP-L (Fig. 11 I, J, K, L) had R² values close to those of REP-LE. REP-P and NDVI exhibited a R² higher than 0.5 for the N content (Fig. 11 M, N).
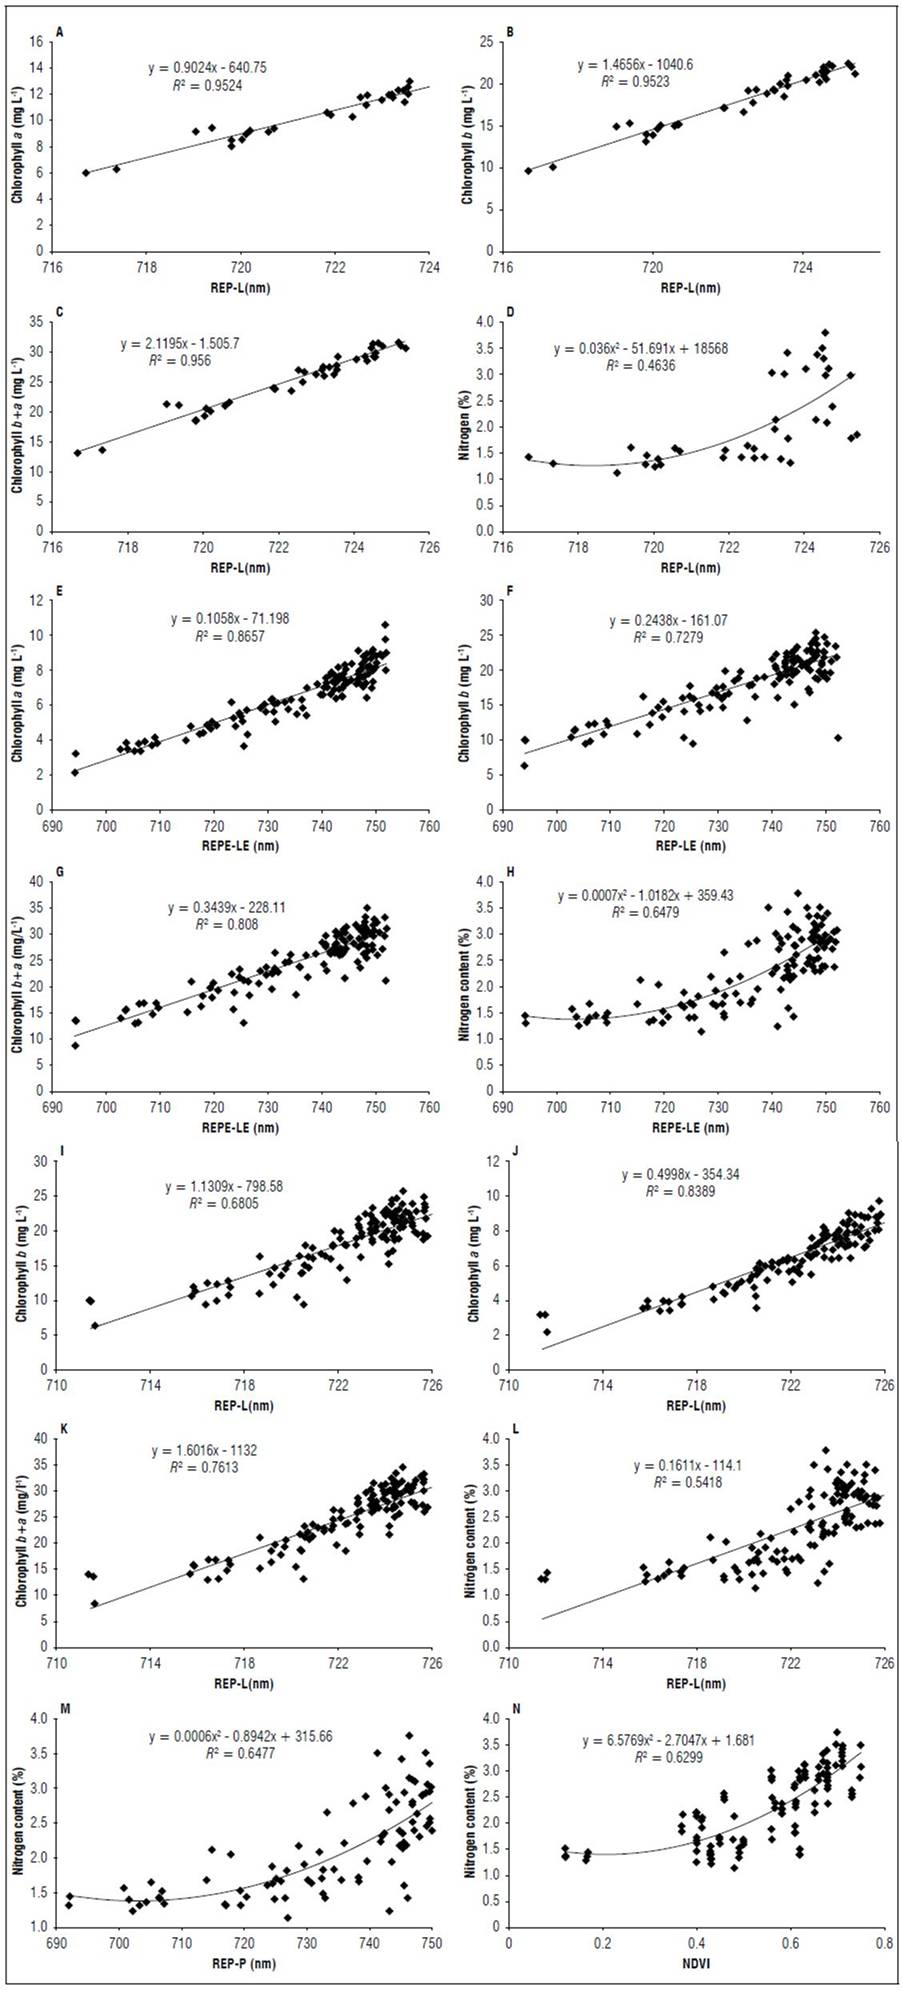
Figure 11. Relationship chlorophyll and nitrogen content with REP-L in stage V8 (A, B, C, D) and in stage R1 for REP-LE (E, F, G, H) REP-L (I, J, K, L); REP-P (M), NDVI (N).
The linear extrapolation method (REP-LE) correlates with foliar nitrogen concentrations in maize and grasses, comparable with results obtained with traditional linear interpolation and polynomial and inverted Gaussian-fitting techniques (Cho and Skidmore, 2006). The REP and Red Edge Chlorophyll Index have a high correlation with chlorophyll contents in maize leaves and can be used to estimate leaf nitrogen contents (Martinez and Ramos, 2015). Gitelson et al. (2005) found that the Chlorophyll Index (CIgreen) was more sensitive to total canopy chlorophyll content under moderate-to-high crop biomass conditions than GNDVI. The Photochemical Reflectance Index (PRI) obtained by Peñuelas et al. (1995) has been reported as having a general relationship with the carotenoid/chlorophyll ratio (Sims and Gamon, 2002).
Several researchers have demonstrated the relationship between leaf nitrogen status and leaf chlorophyll content. Lee et al. (2011) found that N contents increase the chlorophyll content but also produce thicker, flatter and more turgid leaves, which enhance visible light absorption while stimulating near-infrared reflection. Schlemmer et al. (2013) found the lowest coefficients of determination between N and Chl at the beginning of the growing season. In addition, some indices may have saturation at high N contents (Chen et al., 2010). At a higher biomass, especially in plants with a planophile leaf structure, the sensitivity of the normalized difference vegetation index (NDVI) and other indices saturates as the canopy closes, and additional increases in biomass do not result in increased reflectance (Myneni and Williams, 1994). As shown by Cho and Skidmore (2006), reflectance in the red-edge spectrum is important in relationships with biochemical or biophysical parameters and has been used to estimate foliar chlorophyll or nitrogen contents.
Figure 12 shows the correlation coefficients between the crop yield, N content and chlorophyll content, with the first derivative of the reflectance transformed by the SNV. Relatively high correlation coefficients were found between 560 and 780 nm, with negative values between 670 and 720 nm. Chlorophyll a showed the highest coefficients, followed by total chlorophyll, then crop yield and chlorophyll b. The lowest values were for N. N presented the highest correlations at 560 and 770 nm. The crop yield showed the highest correlation coefficient with SNV between 701 and 710 nm, with r varying from 0.82 to 0.83, and between 561 and 568 nm, with r varying from 0.81 to 0.82.
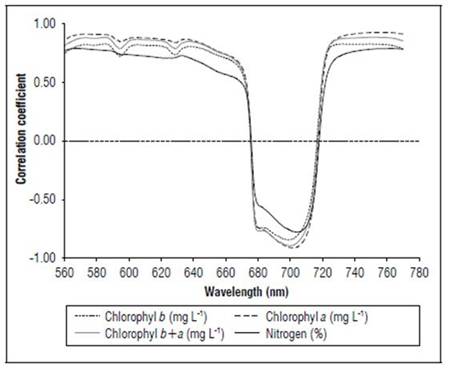
Figure 12. Linear correlation coefficients between SNV and chlorophyll and N contents for R1 state (n=120).
The ANOVA showed significant differences in the crop yield between the treatments (0.05), and Duncan's multiple range test indicated significant differences between three groups for the N treatments (kg ha-1): 0, 50, 100, 200 and 150. The yield showed highly significant correlations (Tab. 7) with the chlorophyll a, chlorophyll b, total chlorophyll, N, REP-P, NDVI, REP-LI, REP-IG, and REP-L, corresponding to stage R1.
CONCLUSION
This study indicated that the phenological state of the corn and the N dose influenced the chlorophyll and nitrogen contents and the spectral responses of the leaves. The correlation and regression analysis showed that the indices based on the calculation of the red-edge position, such as REP-LE, REP-L, REP-P, REP-IG had the best relationship with the Chlorophyll and N content. The SNV also had highly significant correlation coefficients with the N, Chl and yield between 560 and 760 nm. Additionally, the corn yield showed highly significant correlations with the contents of N and Chl. From the point of view of maize nutritional status diagnosis, REP calculations in phenological stages V8 and R1 are suitable indicators for N.

