


 English (pdf)
 Article in xml format
 Article references
 Send this article by e-mail
 Cited by SciELO
  Cited by Google
  Similars in
SciELO
Similars in
SciELO  Similars in Google
 Permalink
1. Introduction
A new theoretical method to obtain the frequency response from the online transient signals measurement (with the transformer in service) was presented in a previous paper [1-6].
This new method is based on the continuous wavelet transform (CWT), which enables improved performance compared to the traditional Fourier transform. The transient signals presented as examples in that paper came from simulations within the Alternative Transients Program (ATP). In recent years, there has been a growing interest in frequency-response analysis (FRA) with the transformer in service, since no transformer disconnection is required to conduct the test.
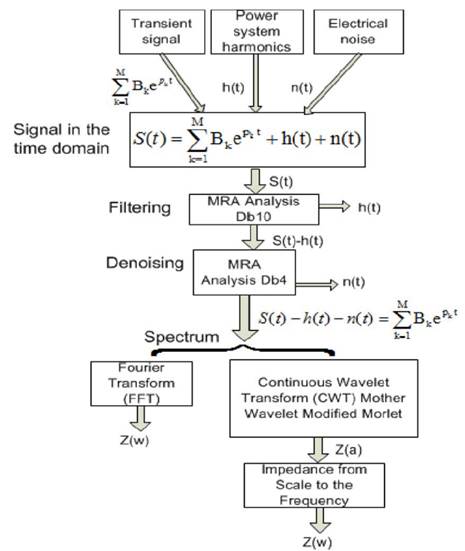
Source: [5].
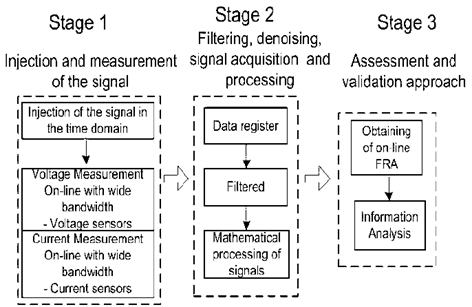
Figure 1 Schema of the proposed method for the measurement of the online FRA in transformers.
Testing under these conditions allows for the monitoring of the transformer and the detection of any abnormalities before they cause catastrophic failures in power grids [2,3]. Although there have been efforts and contributions to carry out the frequency response test with the transformer in service, state of the art is not mature and there is still much research to be done [4].
This paper presents the assessment and validation of the proposed method in real transformers, using the continuous wavelet transform (CWT) [1] as a powerful tool for the filtering, denoising, and processing of transient signals. As will be shown, improvement is achieved when using this new method, including non-repeatability effects and noise content in the measurements, as well as in non-periodical waveforms processing constraints.
2. Experimental set in the pilot transformer
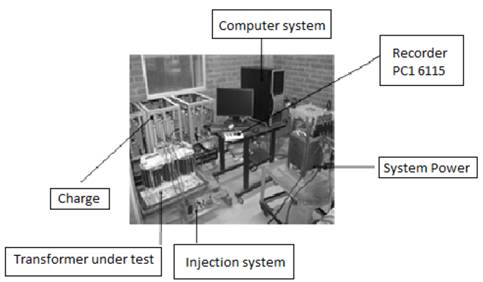
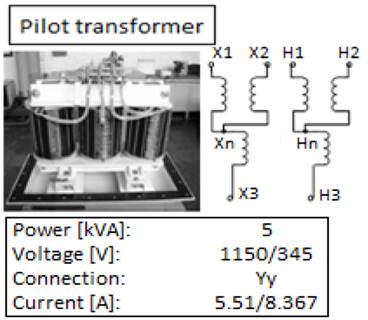
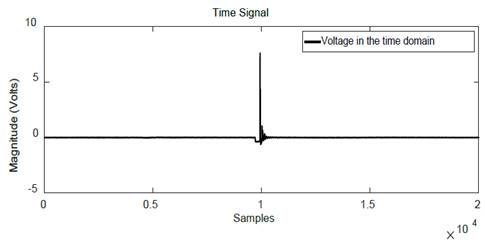
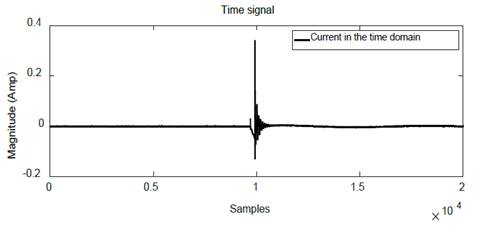
Fig. 2 shows the experimental set in the pilot transformer carried out in the high-voltage laboratory of the Universidad del Valle [6] and Fig. 3 shows the pilot transformer. An OFF- LINE test was performed in a transformer, with high voltage winding short circuited and low winding open to obtain the transient signals. Results of voltage and current signal measurements are shown in Fig. 4 and Fig. 5, respectively.
Source: The authors.
Figure 4 Time domain voltage signal, with a 2ms window of 20.000 samples at 10M samples/s.
3. Practical proposed method for carrying out the online FRA test
The proposed method to obtain the frequency response with the transformer in service (online) involves the three stages presented in the block diagram shown in Fig. 1.
3.1. Stage 1. Injection and signal measurements
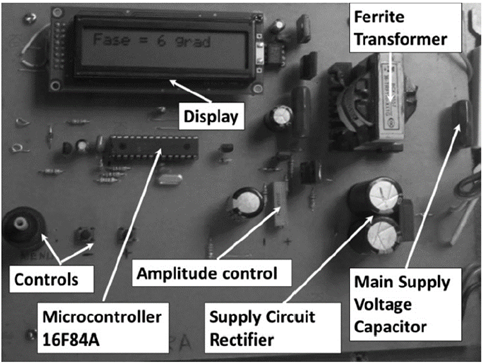
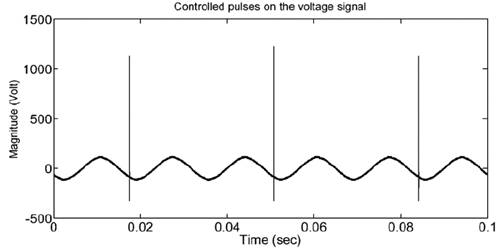
An electronic circuit was designed and implemented for the injection system to inject microsecond-width controlled voltage pulses on the power wave of 60 Hz [4]. The injection system enables setting the amplitude, width, and phase of the generated pulses, by means of the circuit shown in Fig. 6, with Fig. 7 showing an example of controlled pulses on the (60 Hz) voltage signal.
Source: The authors.
Figure 7 Controlled pulses on the (60 Hz) voltage signal used for the online IFRA method.
3.2. Stage 2. Filtering, denoising, signal acquisition, and processing
The voltage and current signals were modeled according to S(t) presented in Eq. (1), which is composed of three terms. The first one represents the nature of the transformer’s condition itself and constitutes the main information we want to extract from the measurement. It is mathematically defined as a summation of N terms, where Bk are the residues and Pk the modes or poles determining the shape of the transient signal. This main information is contaminated by the background noise n(t), and the harmonic distortion h(t) coming from the fundamental power 50/60-Hz frequency component.

Once made filtering applies the CWT, it is defined as Eq. (2) [5].

Where the asterisk represents the conjugate of the complex function, f t is the transient signal itself, 𝜓(t) is the wavelet function which defines the mother wavelet in use, in which “𝜏” conducts the translation and factor, and “𝑎” provides the dilation (or scaling) factor.
In part 1, it was demonstrated that using the mother wavelet Complex Morlet yields excellent results [1]. The complex Morlet wavelet transform is defined in Eq. (3) [5-16].

Applying the wavelet transform to the transient signals of both current and voltage [10-15] in its discrete form. Eq. (4) and Eq. (5), since a measured transient is not a continuous function but a matrix of points [16-20].


With the information of the data we can get the ratio between the coefficients 𝐶 𝑉 y 𝐶 𝐼 as shown in Eq. (6) obtaining the coefficients 𝐶 𝑍 .

The impedance phase at the scale defined by “𝑎” can be obtained from the integration of Eq. (6) along the whole window time of the transient. Due to its complex nature, the integration is performed under a vector approach. The phase can be obtained by means of Eq. (7).

Where the operators “𝑅𝑒” and “𝐼𝑚” are the real part and imaginary part of the complex coefficients, respectively.
3.2. Stage 3. Assessment and validation approach
The transformer impedance, computed from online time-domain records was measured while the transformer was energized and compared with the corresponding sweep frequency- response analysis (SFRA) offline response, obtained by using frequency-response analysis equipment.
4. Experimental results
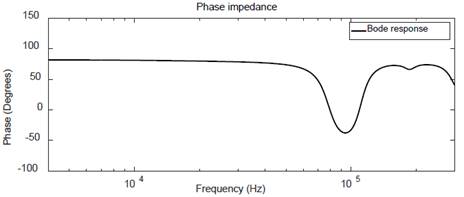
With a commercial instrument (MEGGER FRAX-101), the transformer SFRA was obtained and taken as reference, as shown in Fig. 9.
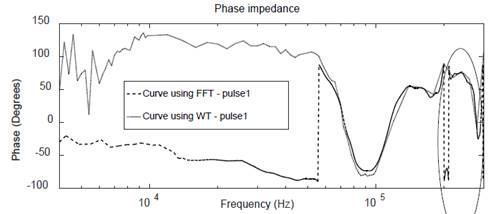
The result with Fourier transform was obtained as shown in Fig. 10 and with Wavelet transform as shown in Fig. 11.
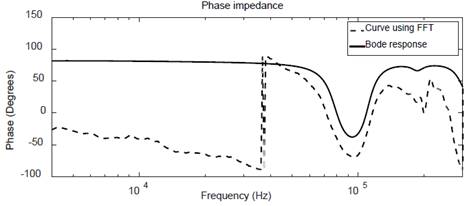
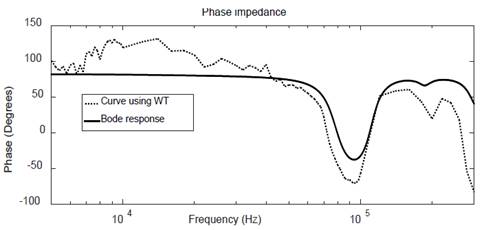
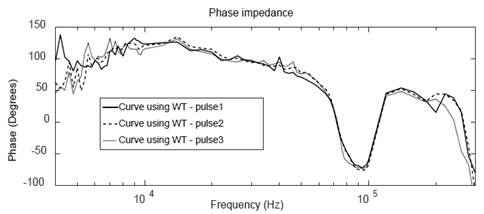
As observed in Fig. 11, WT offers a better approximation to reference, in a frequency range 4kHz to 40kHz, compared to FFT; After this, a repeatability analysis was performed, obtaining the response for the first three pulses of the time signal for WT and FFT methods, as shown in Fig. 13 and Fig. 14, respectively.
Source: The authors.
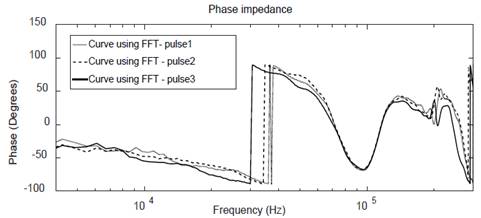
Figure 12 WT assessments using a 2ms time window: phase frequency response for three pulses.
Source: The authors.
Figure 13 FFT assessments using a 2ms time window: phase frequency response for three pulses.
Source: The authors.
Figure 14 FT and WT assessments using a 1,5ms window of 15.000 samples at 2.5 M samples/s.: phase frequency response.
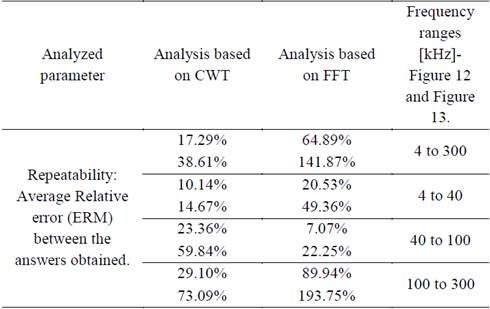
Table 1 shows the quantitative analysis, of the results obtained when using both methods.
A qualitative analysis, using the average Relative error (TERM), was made to compare the two methods, in which best results were obtained for the CWT method [19-22].
To confirm the advantage in using WT, the same experimental example was used with a time window of 1,5ms and 15.000 samples, but with a sampling frequency of 2,5M samples / s.
Unlike the FFT, the WT is not altered by the changes generated shown in the part enclosed in Fig. 14, which demonstrates that the proposed method is a suitable one.
5. Conclusions
This article proposes an improved method for processing signals from time to frequency for the impedance phase. It allows overcoming the traditional Fourier Transform performance, since no periodical signals are required at all. This feature can be much more useful for engineering design and analysis because it allows working with non-periodical transient responses.
A simple example showed that, when the measurement conditions are tightened, the proposed WT based procedure performs better than the FT.
The key points in the procedure are a suitable election of the mother wavelet (Complex Morlet, in this case) and of the proposed frequency response values calculation (frequency domain) from the wavelets coefficients (time-scale domain). Thus, a correct analysis of the phase of the impedance, leads to better results for the wavelet transform, in comparison with those of the Fourier transform under both simulated and experimental conditions, which adds to the potential of WT as a suitable for the processing of transient signals.

