


 English (pdf)
 Article in xml format
 Article references
 Send this article by e-mail
 Cited by SciELO
  Cited by Google
  Similars in
SciELO
Similars in
SciELO  Similars in Google
 Permalink
1. Introduction
Jams are a traditional way to preserve and consume fruits and vegetables. In fact, there is a variety of preparations with different names regulated by the relevant laws and regulations including jam, jelly, compote, etc. However, all of them are made of a gelled mixture of sugar and fruit pulp with the appropriate consistency. These products come in different presentations (whole, chopped or crushed fruits) with different amounts of added sugar and ingredients [1].
Fruit jam is a product of a paste-like or gelatinous consistency that has been produced by the cooking and concentration of healthy fruits combined with water and sugar. The most salient characteristics of the jam is its bright and attractive color, and it should look gelled without much rigidity. The elaboration of jams is a way of preserving fruit pulps by the action of sugars and high levels of acidity [2].
In the Sanitary Food Regulation, it is considered as "Jam", they are the products obtained by cooking fruit, vegetables or tubers (whole or fractionated), their juices and/or pulps, with sugars (sugar, dextrose, invert sugar, glucose syrup or its mixtures) with or without the addition of other sweeteners, additives or ingredients. They include jams, sweets, jellies, candied, glazed, crystallized or frosted fruits, drained and syruped [2].
Jams are also an alternative for fruit preservation, especially highly perishable fruit species. The preparation of this product is based on the conservation of a concentrated substrate with a minimum 65% of soluble solids and acid pH. The product is stored at room temperature for several months previous to mild thermal treatment, as long as it is protected from air by using hermetic seals [3].
Jams are made in both home and industrial scale since time immemorial. Making jams is quite simple and consists of prolonged cooking along with a significant amount of sugar. About 65-100 percent of raw materials, usually fresh fruits, must be at optimum ripeness point as well as crushed and sieved, however, the details of the preparation process depend on the recipe and the fruits used.
Jam production has made great progress at the technical level and research continues to be done in order to make improvements on the end product, especially in terms of organoleptic properties and sanitary conditions, as well as improved preparation techniques for better performance.
Undoubtedly, today's consumer demand for new and improved food products, together with the ever-increasing changes in tastes and preferences increasingly forces markets to innovate in terms of product development. The need for innovation not only encompasses food safety but also sensory quality. Therefore, the food industry must meet consumer demands by improving the sensory quality of food products, which eventually will result in an increase in the level of the acceptability of foods made of specific ingredients, without significantly increasing production costs [5].
Food processing requires analyzing the influence of a number of variables. The formulation of products enriched with pectin from cacao requires a multivariable approach, therefore, the use of response-surface methodology (RSM) provides a valuable tool to streamline variables such as pectin concentration and citric acid concentration [6-8].
On the other hand, in the exploitation of cocoa only the seed is used economically, which represents approximately 10% of the weight of the fresh fruit, which suggests that the remaining 90% is the husk that is not being harvested. This circumstance has resulted in serious environmental problems such as the appearance of foul odors and the deterioration of the landscape, as well as disposal problems. The waste generated consists mostly of the husk, which is also considered a focus for the propagation of Phytophora spp, the main cause of economic losses of cocoa activity [9].
This has motivated the development of studies at the field level in order to increase the commercial value and diversify the use of cocoa shells, whose traditional use is as an input for animal feed and soil recovery. Cocoa shells have been proposed as a commercial source of pectins, due to their relative low cost [9].
The purpose of this study was to improve the level of acceptability of mango jam enriched with pectin cacao husk (Theobroma Cacao L.) by using response surface methodology.
2. Materials and methods
2.1. Description of pectin from cacao husk
Pectin used in this experiment was obtained from husks of cacao grown in the locality of Colosó, Colombia. The samples were prepared according to the method used by Srirangarajan and Shrikhande [10] with slight modifications being made, together with a modified McCready's method [11] where extraction is made at acidic pH of 4 and a temperature of 90 °C. Pectin used has free acidity 0.558 meq free carboxyls/g pectin, equivalent weight 1800.05 mg pectin/meq NaOH, methoxyl content 6.81%, esterification degree 79.94% EST, D-Galacturonic acid content 48.51% AG.
2.2. Preparation of mango jam
Mango jam was prepared according to the method described by D.K. Tressler [12] by replacing water with mango pulp and using different concentrations of pectin and citric acid (0.2%, 0.4%, 0.6% y 0.1%, 0.3%, 0.5%, respectively). The variables for fresh fruit (65,5%) and sugar (34,0%) remained fixed. The procedure was as follows: the pulp was heated with constant stirring until reaching a temperature ranging from 71 °C to 82 °C. A mixture of pectin and sugar (5-8 times the weight of pectin) was slowly added to the preparation. Then the mixture was heated until it reached the boiling point and the remaining sugar was added. Once sugar was dissolved, the mixture was heated until it reached a temperature of 106 ° C. Next, citric acid was added while heating the mixture for 5 minutes. Then the mixture was hot-filled in plastic containers and covered.
2.3. Sensory evaluation
After 24 hours, a test for measuring product acceptability was conducted among 60 people using a 7-point hedonic scale, were 1 stands for "I dislike very much" and 7 stands for "I like very much". The methodology recommended by Costell and Duran [13], described below, was used:
2.3.1. Approach
The objective in applying the sensory test was to determine acceptability through the degree of satisfaction. The amount of sample evaluated per treatment by the panelists was 10 g. The presentation was in transparent, disposable plastic plates, coded with three-digit numbers, plus a glass of still table water as a mouth-cleaning vehicle. The evaluation temperature was that of the environment (20-24°C) [14].
2.3.2. Planning
The degree of satisfaction test [9] was used to evaluate the optimal treatment with greater acceptability using a 7-level hedonic scale (1: I dislike it very much and 7: I like it very much). The affective test employed did not require trained panelists, the selection of panelists was required to be consumers of the type of product. In addition, a pre-selection survey was used [14-16] from which a group of 60 consumers of both sexes aged between 18 and 30 years belonging to the Caribbean University Corporation-CECAR was formed.
2.3.3. Implementation
The environmental, informative and practical aspects were in the evaluation conditions as close as possible to those surrounding the consumer's target group of the research for preference or acceptance studies [13,14].
2.4. Data processing and statistical analysis
The experiment was conducted using a two-factor, completely randomized design: pectin concentrations (0.2%, 0.4%, 0.6%) and citric acid concentrations (0.2%, 0.4%, 0.6%). All experiments were conducted in triplicate for each treatment, for a total of 27 experimental units. The level of acceptability of the product is measured by the response variable.
Data analysis was done using a two-way analysis of variance in order to compare the concentrations of pectin and citric acid and determine if interaction occurs between them. The comparison of means test was performed by the Tukey's range test with significance level of 5%, together with model assumption tests (normality, independence and homogeneity of variance). Response surface methodology (RSM) and a α=0.05 significance level were used to optimize product acceptability. The analysis was carried out using R Studio 1.0.44 software.
3. Results and discussion
Sixty people were selected in order to evaluate 27 samples prepared according to the proposed treatments. Table 1 shows the results of the acceptability test for mango jam enriched with pectin from husks of cacao. The results show that the treatment with lower acceptability (3.67 average) was that with 0.6% pectin and 0.5% citric acid (I dislike slightly), while the treatment with the highest acceptability (6.75 average) was that with 0.2% pectin and 0.3% citric acid concentrations (I like very much).
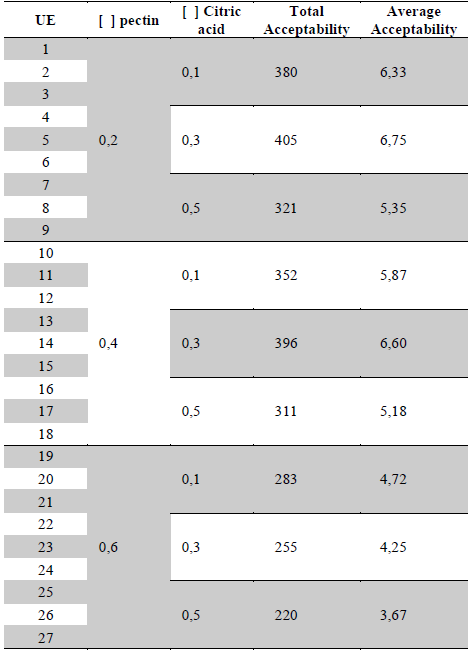
The results obtained reveal that the treatment using pectin and citric acid concentrations of 0.2% and 0.3% respectively, had the highest acceptability level, which agrees with those reported for low-calorie mango jam [17], and for light peach jam [18]. In the same way, it agrees with that reported in the measurement of the acceptability of a strawberry jam added with pectin from cocoa peel that had a value of 6.27 [9]. The amount of citric acid that should be added to a jam will depend on the acidic pH values of the fruit used [19]. In this case, mango has pH values ranging between 3.5-4.1 [20] therefore the amount of citric acid to be added ranges from 0.2% to 0.4%. According to *ICONTEC's standard NTC 572 [21], the amount of pectin to be added to jams will depend on Good Manufacturing Practices (GMP) as well as the pectin levels present in the fruit used. In the case of mango jams, a maximum 0.5% pectin level is recommended [19].
R Studio 1.0.44 software was used to measure the results of the analysis of variance (ANOVA) for product optimization by surface-response, as shown in the Table 2.
Table 2 Analysis of variance (ANOVA) for product optimization by surface-response
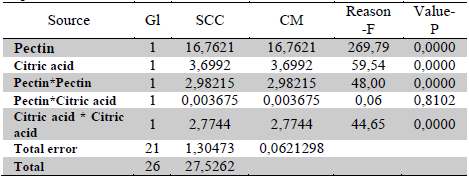
Source: The authors
ANOVA for optimization of sensory acceptability suggests that pectin and citric acid concentrations as well as some interactions play an important role in maximizing sensory acceptability, since p-values are less than 0.05 with a level of significance of 5% [22]. The analysis of variance also allowed to obtain a model that accounts for 95.26% of the variability in acceptability levels [14] states that the closer R2 is to 100% the more the model adjusts to experimental data.
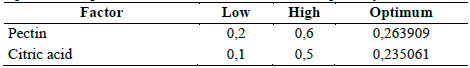
Statistical data analysis resulted in the following model. Table 3 shows the optimal formulation to optimize sensory acceptability.
Acceptability = 4,54417 + 9,40625P + 8,10833AC - 17,625P2 - 0,4375PAC - 17,0AC2
P = pectin concentration (%), and AC = citric acid concentration (%).
The values of the formulation to optimize sensory acceptability by response surface methodology up to a 6.73852 value tend to resemble the results obtained from the sensory test. Fig. 1 shows response-surface with a slight local variation as stated by Loo [14]. The results also suggest that as the concentrations of pectin and citric acid approach the optimum values of 0.263 and 0.235%, respectively, the greater the increase in acceptability values.
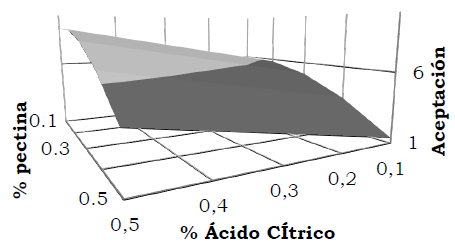
The response surface and level curves shown in Fig. 1 suggest that as the percentage of pectin approaches the optimum value (0.25% - 0.3%), with a citric acid concentration close to 0.25%, the greater the increase in acceptability values. The optimum acceptability value was set at 6.73852.


