




 English (pdf)
 Article in xml format
 Article references

 Automatic translation
 Send this article by e-mail
 Cited by SciELO
 Cited by Google
 Similars in
SciELO
 Similars in Google

 Permalink

1. Introduction
Venezuela has the largest proven oil reserves in the world and ranks seventh in proven natural gas reserves, according to British Petroleum (BP) [1], therefore it is convenient to have knowledge of the demand, supply, and transformation of these energy sources, as well as their alternatives, to ensure the supply of Venezuela’s domestic demand, as indicated by the Latin American Energy Organization (OLADE) [2].
Even though Venezuela occupies one of the first places on proved oil and natural gas reserves in the world, the impact on the environment of the exploitation of these reserves has not been studied in depth, especially on the GHG emissions. In addition, most of the current information related to the demand and transformation of energy in the country is unavailable, which leaves a window of opportunity to the present study. This data collection is of global interest and allows to study the GHG emissions from an energy balance point of view.
According to the Organization of Petroleum Exporting Countries (OPEC), in 2019 Venezuelan production was 1.81 EJ, equivalent to 796 thousand barrels per day (mb/d) [3]. Of those, 0.31 EJ (135 mb/d) were headed to national refineries for processing [1], and the remaining for export. The International Energy Agency (IEA) exposed that the processed crude oil domestic consumption for the same year included categories such as electricity generation (0.05 EJ), transport (0.43 EJ), industry (0.04 EJ), among others [4,5]. Additionally, oil production in 2021 was 1.26 EJ (556 mb/d) and 1.55 EJ (684 mb/d) in 2022 [6].
Regarding natural gas, 2.07 EJ were produced by 2019, equivalent to 59,657 million cubic meters (Mm3). From those, 3.70% were used in power plants, 0.92% as domestic consumption, 6.07% in industry and 0.03% in transport [4,7]. The remainder was injected, flared and vented [8].
Electricity in Venezuela is generated primarily from hydraulic energy, representing 81.70% of the national electricity generation matrix in 2020, followed up by fossil sources (oil and natural gas) with 18.30% [9].
Fossil energy sources are important not only for the industrial and transportation sectors in Venezuela, but also for the electricity and domestic markets. Nevertheless, fossil resources implicate the emission of a significant amount of carbon dioxide (CO2) into the atmosphere. CO2 is one of the GHG and contributes to climate change [10]. Gases such as carbon monoxide (CO), methane (CH4) and hydrocarbons are also produced from the combustion of fossil fuels, and eventually they oxidize and turn into CO2 [11]. To express the emissions of these gases in a way that they can be compared with CO2 emissions, the unit of carbon dioxide equivalent (CO2e) is used [12]. In the case of Venezuela, a breakdown of the GHG emissions produced by energy consumption and transformation has not been previously studied, which results of interest for this work.
The impact caused by the emissions of GHG has been a worldwide problematic, and several measures have been applied to reduce them. The Paris Agreement (2016) was held at COP21 with the objective to prevent the rise of global temperature above 2°C and documents entitled Nationally Determined Contributions (NDC) are delivered by each Party of the United Nations (UN) to the Secretary of the Convention, manifesting measures aimed at complying the Paris Agreement [13]. In this sense, Venezuela ratified its commitment to the 20% reduction of GHG emissions by 2030 in 2018.
The scope of this work is to determine Venezuela’s energy balance until 2050 according to oil and natural gas production, and analyse its impact on GHG emissions, considering the country’s context and the necessary mitigation measures. In this sense, the LEAP program [14] was used, and energy scenarios were established, determining the main variables that affect the scenarios by 2030 and 2050.
1.1 Background
1.1.1. Energy scenarios in a global context - IEA
In a global context, different scenarios for the coming years regarding the energy sector are projected.
One of the scenarios proposed by the IEA is the “Stated Policies Scenario” (STEPS), which considers that the energy circumstances will continue to develop in the same way as in previous years, without significant changes in government policies. This scenario, commonly known “Business As Usual” (BAU), projects an oil demand of 104,000 mb/d for the mid-2030s, declining slightly by 2050 [15]. IEA also presented a scenario totally focused on the compliance of NDC objectives, called “Net Zero Emissions” (NZE). In this case, the emissions produced by anthropogenic activities are counteracted with its removal or reduction, projecting an oil demand of 74,000 mb/d by 2030 and 24,000 mb/d by 2050 [15,16].
1.1.2. Historical oil production in Venezuela
In the last decade, Venezuela has presented a relevant decrease in its oil production. Fig. 1 shows the decrease in oil production from 5.26 EJ (2,318 mb/d) for 2015 to 1.13 EJ (498 mb/d) in 2020, increasing slightly to 1.26 EJ (556 mb/d) for 2021 and 1.55 EJ (684 mb/d) in 2022 [3,6,17-23].
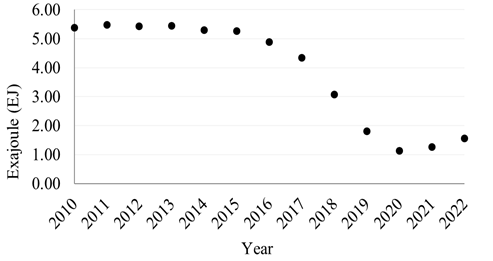
OPEC and Ministry of Petroleum (MPPP) with the Oil and Other Statistical Data (PODE) 2014 values of oil production were compared, resulting in an average of 21.23% for the 2011-2014 period [3,17-24]. Official data from Venezuelan Government has not been released since this last reference. However, OPEC’s primary sources will be represented in this article as the official Venezuelan data.
1.1.3. Historical natural gas production in Venezuela
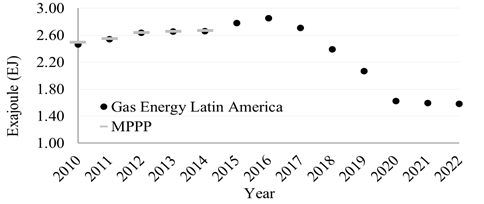
Fig. 2 shows Venezuelan natural gas production from 2010 to 2022. PODE 2014 reported data from 2010 to 2014, while Gas Energy Latin America included production until 2022, concurring both references in the 2010-2014 period. The year 2016 presented a peak of 2.85 EJ (82,117 Mm3), descending then to 1.58 EJ (45,529 Mm3) in 2022 [8,24,25].
1.1.4. Historical GHG emissions in Venezuela
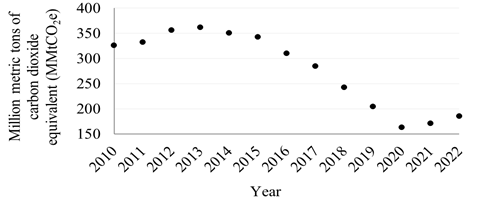
The GHG emission values were consulted from the Statistical Review of World Energy, which until the year 2021 was reported by BP and currently is published by the Energy Institute. Fig. 3 presents the data from 2010 to 2022, values that considered energy uses, process emissions, methane and flaring of natural gas [1,26].
1.1.5. Venezuelan Government commitments regarding GHG emissions
In the last decade, the intention to increase the use of renewable alternatives over fossil fuels has risen, with the purpose of contributing to the NDC commitments.
Venezuela formalized its NDC in February 2018, ratifying the commitment to the reduction of GHG emissions [27]. Thereby, it proposed the 20% reduction of GHG emissions by 2030 in comparison to the inertial scenario, which considered the reported emissions until 2011 [28].
Based on the historical data from 1990 to 2011 [1] an adjustment for GHG emissions was done to obtain the inertial scenario and Venezuela’s objective for 2030, resulting in 369.60 MMtCO2e and 295.68 MMtCO2e, respectively. Also, for 2035 and 2050 the NDC objective aim to 300.99 and 314.37 MMtCO2e in total emissions.
1.1.6. LEAP program (Low Emissions Analysis Platform)
LEAP, acronym for Low Emissions Analysis Platform, is a simulation program developed by the Stockholm Environment Institute (SEI) that offers the possibility to analyze energy scenarios, considering aspects, such as the consumption, production, mitigation measures, and its evaluation. LEAP has been used by countries as part of its NDCs, as well as institutes and, researchers, specially studying the impact on the environment of diverse scenarios with their respective energy requirements, analyzing GHG emissions. These scenarios can be evaluated in an unlimited years horizon. Nevertheless, most of the research carried out considers a study period of 20 to 50 years [29].
LEAP hierarchically organizes the information in a “tree” structured into branches [14]:
Key Assumptions: Includes independent variables that can be used in other branches.
Demand: Includes final energy consumption by each technology, referring to electricity, natural gas, gasoline, diesel, among others.
Transformation: Simulates the conversion, transmission, and distribution of energy from the extract point of the resource to where it is consumed.
Resources: Disaggregates primary and secondary sources, considers consumed and produced fuels.
1.1.7. LEAP in the analysis of energy scenarios
Serrano and Méndez modeled in 2020 three sustainable energy planning scenarios. First, BAU, maintaining energy use rates with no modifications. Secondly, “Uso Eficiente de Energía”, with changes in the energy use indicators for the residential and commercial sector, and replacement of GLP for natural gas, considering the increase in the activities of the BAU scenario. Finally, in “Ciudad Compacta y Movilidad” transport consumption was reduced, and electric public transport was incorporated [10].
On the other hand, in 2021 Hernández and Fajardo used LEAP to estimate a projection of Bogota’s emissions, Colombia, evaluating three scenarios: BAU; “Reducción de carbono”, implementing new environmental policies that will limit carbon use in energy production and, lastly, “Mitigación”, which removed all fossil fuels except natural gas and electricity generation from renewable sources [30].
In this sense, several studies have considered alternative energy planning scenarios using LEAP program as a tool to estimate the energy demand and GHG emissions, demonstrating its versatility through a wide range of possibilities.
2. Methodology
LEAP version 2020.1.0.76 under the “Student Research” license from SEI was used, and 2011 was chosen as base year. The year 2012 was the first year of the scenario and 2050 the last. Data and estimations from period 2012-2022 were used as the basis for demand and transformation projections. The following data from national and international entities were collected:
Key Assumptions: Population and Gross Domestic Product (GDP) data [31-34] were included.
Demand: Households, industry, transport, and commercial and public services sectors were established [5,7,24,31,35-40].
Transformation: Transmission and distribution, electricity generation, oil production, crude oil refining, and production, injection, flaring and venting of natural gas data were considered [1,4,8,39,40,41-54].
Resources: Bituminous coal, hydro, solar, wind, crude oil, natural gas, and firewood, were considered as primary sources, while the secondary sources diesel, residual fuel oil, naphtha, bitumen, lubricants, petroleum coke, gasoline, electricity, kerosene, jet kerosene, and LPG [54-56].
Natural gas flaring and venting were computed as the difference among natural gas total production and its use for electricity generation, domestic market, and injection.
2.1. Variables
Variables considered and its impact are listed in Table 1.
Table 1 Main variables in scenarios
| Variable | Impact |
|---|---|
| Population | Household consumption |
| GDP | Industry, transport, and commercial and public services consumption |
| World’s oil demand projection in the international market and Venezuela’s fraction on world demand | Venezuelan oil production |
| Oil production | Gas Oil Ratio (GOR) and natural gas production |
| Venezuela’s objective according to NDC | Reduction of GHG emissions by 20% for 2030 and mitigation scenarios |
| Solar and wind energy potential | Change in electricity generation matrix as mitigation measure |
Source: Own elaboration
2.2 GHC emissions calculation
The consumed energy was computed as the product of the total activity and the energy intensity (eq. 1), while GHG emissions as the product of GHG environmental load factor and the energy consumed, as seen in eq. (2) [14]. The GHG considered for the determination of the emissions were CO2, CH4 and N2O. According to LEAP those are the main GHG.


Eq. (1) refers to each technology, scenario, and year.
By default, LEAP includes the Global Warming Potential (GWP) for the calculation of the CO2e emissions, as stated by the IPCC’s Fifth Assessment Report (AR5). These GWP, expressed in tons of CO2e per ton of pollutant, allowed to express all GHG emissions in terms of tons of CO2e [14].
2.3 Scenarios
As previously mentioned, six energy scenarios for the 2023-2050 period were established. The scenario names were arbitrarily designated by the authors. The two main considerations were the grade of economic opening in Venezuela and the level of adoption of climate change mitigation measures in the world. The proposed scenarios are presented in Table 2.
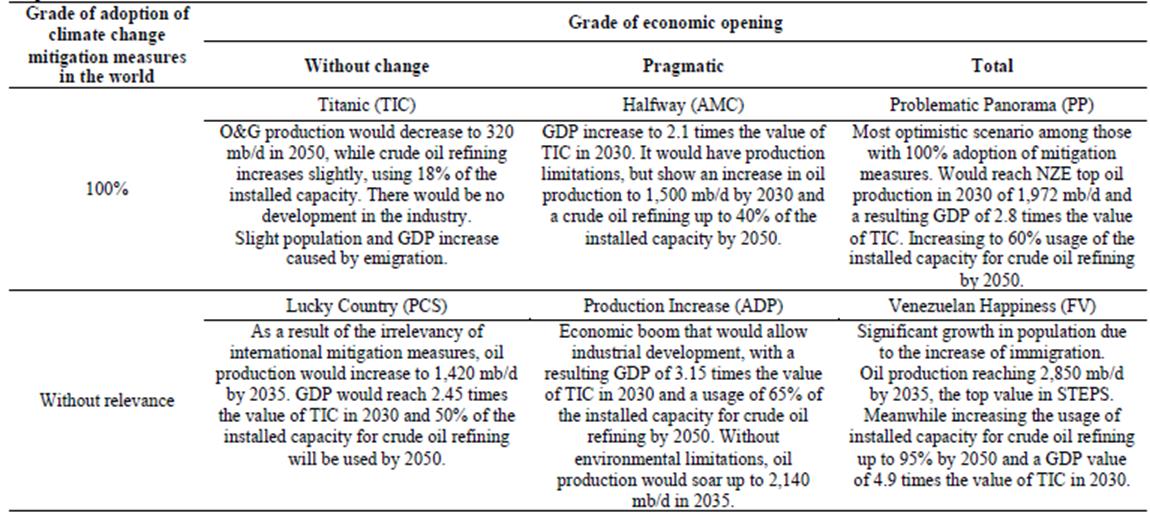
The oil production premises presented in scenarios were based on data from international organizations, such as the energy planification scenarios STEPS and NZE from IEA. Oil refining estimations were based on the use of the installed capacity (219.52 mb/d) for 2023 and the development in the industry, representing a different percentage of that capacity for each one of the six scenarios. Additionally, natural gas production was estimated according to the GOR historical values and oil production, while natural gas injection on its historic reported values. Population growth was determined on the values reported by the Latin American and Caribbean Demographic Centre and the UN [32], and accordingly to the develop of the economy varied from 40 to 180% of the estimated value. On the other hand, GDP values depended on population growth and the economic change.
3. Results and Discussion
3.1 Historical period 2011-2022
Based on the information collected from national and international entities, the demand historical behavior, the electricity generation, oil production and refining, natural gas production, injection, flaring and venting, and exports and imports for the period 2011-2022 were assumed. As a result of this compilation, GHG emissions for the period were determined, as shown in Fig. 4.
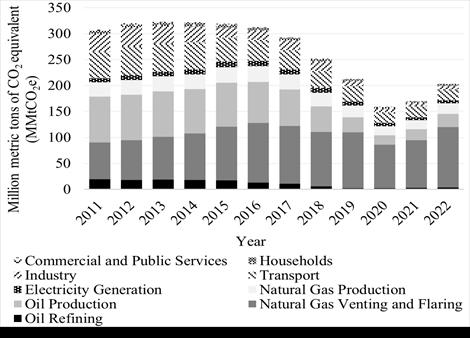
A minimum of 159.15 MMtCO2e in 2020 was observed, which increased to 203.05 MMtCO2e in 2022. This behavior is consistent due to the interruption of the national electricity service in 2019 and the COVID-19 pandemic in 2020. Next to this period, the reactivation of the activities and operations was expected, as well as the growth in the emissions exhibited in 2020, as shown in 2021 and 2022.
The data reported by BP and Energy Institute was considered for the GHG emissions and its historical validation [1, 26]. In the period 2011-2022, historical data and LEAP results showed an average difference of 5.65%, which is considered in an acceptable range.
It is relevant to mention that at the time this simulation was carried out, the data of natural gas production was unknown, and it was calculated based on oil production and the reported GHG emissions. The authors estimated a higher natural gas production in 2022 than the one reported recently by Gas Energy Latin America, which explains why the value of total emissions presented for that year in Fig. 4 is higher than the one reported from the Energy Institute. The difference in emissions is specifically related to natural gas production, flaring and venting.
3.2. Scenarios 2023-2050
The Demand branch depends directly on population and GDP, as established in the premises of the scenarios, which explains Fig. 5. TIC would present the lowest demand by 2050, 0.89 EJ, and FV the highest, with 2.48 EJ. As the demand of energy increases, the electricity demand is higher, as well as the electricity generation.
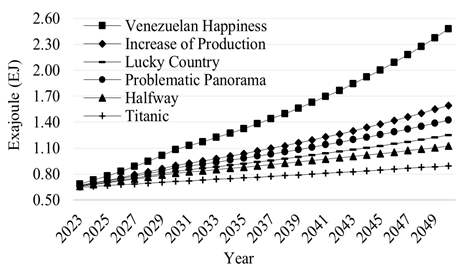
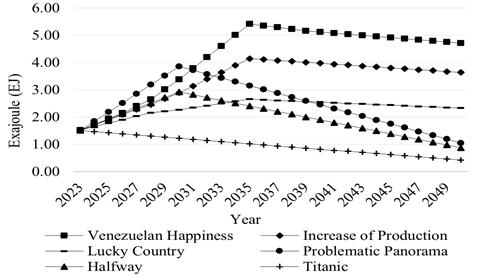
Fig. 6 shows oil production of each scenario, starting from the estimated value of 800 mb/d in 2023. TIC would not have any improvement in the oil industry, which explains the drastic decline of production through the years, lacking a peak after 2023, ending 2023-2050 with 657 mb/d. Nevertheless, all the other scenarios considered a top oil production between 2030 and 2035, according to the expectations of the IEA in the NZE and STEPS scenarios, estimating for the latter a global oil demand of 98,000 mb/d by 2050 and a 2.74% for Venezuela’s fraction on global oil demand [17]. AMC and PP would present a top oil production in 2030 and a significant decrease by 2050, according to the 100% adoption of mitigation measures in the world, which translates into a considerable reduction of fossil fuels use, reaching 861 and 1,340 mb/d, AMC, and PP, respectively. However, in the scenarios where the mitigation measures are irrelevant, oil production would increase notably until 2035, and then decrease slightly up to 2050. In this case, FV would present the higher production, due to the total economic change, reaching a peak of 2,850 mb/d, in contrast to ADP with 2,140 mb/d and PCS with 1,420 mb/d.
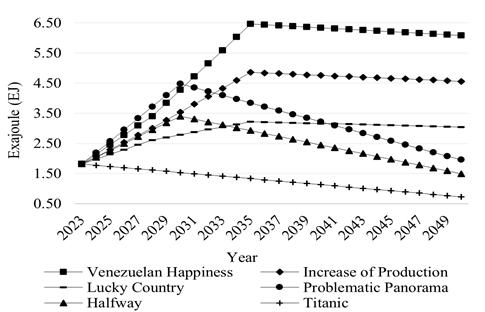
Fig. 7 shows that natural gas production would have the same behavior, starting 2023 with 59,942 Mm3. Due to the lack of official data, GOR values from 2011-2022 period were used, as well as the oil production estimates, which made it possible to project the production, starting off the premise that most Venezuelan natural gas is associated to oil.
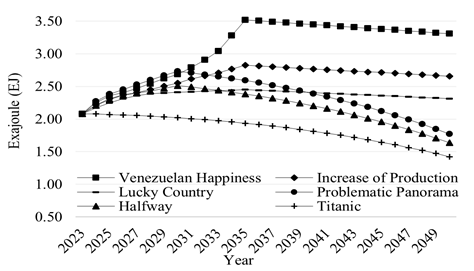
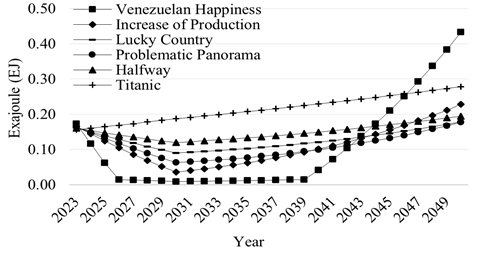
Even though FV would present the lowest total imports for 2023-2050, the scenario would have a noticeably increase in 2039 due to the rise of oil refined products demand, as a consequence of the drastic population growth. The imports would include mainly gasoline and LPG, followed up by kerosene. Total imports of each scenario are shown in Fig. 8.
The exports (see Fig. 9) would have an opposite behavior, with the most optimistic scenario (FV) as the one with highest exports (116.86 EJ) and the most pessimistic (TIC) with the lowest (26.91 EJ). This would be the result of oil production, being crude oil the main fuel to export, representing between 64.89 and 73.80 % of total exports.
Once all the categories were known, it was possible to determine the GHG emissions for the 2023-2050 period (see Fig. 10). It can be concluded that an increase in population and an economic change, pragmatic or total, will lead to a growth in GHG emissions. TIC would show the least emissions due to poor oil and natural gas production. On the contrary, FV economic change would allow to a greater investment in process improvement and equipment maintenance, developing the industry and producing higher GHG emissions. Even though TIC would flare and vent more produced natural gas compared to FV, the latter would present greater volumes of natural gas flared and vented (see Table 3).
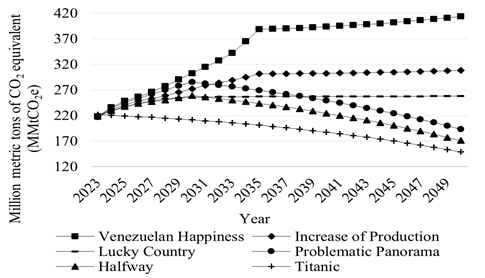
Table 3 Emissions and percentage that flaring and venting represent on natural gas production in 2050
| Scenario | GHG emissions (MmtCO2e) | Flaring and venting in 2050 (%) | ||
|---|---|---|---|---|
| 2030 | 2035 | 2050 | ||
| TIC | 211.50 | 200.93 | 148.54 | 66.14 |
| AMC | 258.56 | 243.54 | 170.67 | 47.09 |
| PP | 285.25 | 269.25 | 193.32 | 35.68 |
| PCS | 255.41 | 257.41 | 258.10 | 61.21 |
| ADP | 272.20 | 301.55 | 307.99 | 51.74 |
| FV | 302.35 | 388.35 | 413.50 | 47.06 |
Source: Own elaboration
If TIC, AMC, and PP are grouped, as well as PCS, ADP and FV, a tendency to decrease or increase the GHG emissions can be observed, as the economic situation emerges and as the oil and natural gas production develops, according to the international context.
The two main GHG would be CO2 and CH4, followed up by NO2. For all scenarios, the average proportion of CO2 in the interested years, 2030, 2035 and 2050, would be 64.07% and 35.77% for CH4. NO2 would cover the rest, 0.16%.
Fig. 11 shows GHG emitted in 2030, 2035 and 2050 by category. Natural gas flaring and venting and the transport sector would be the categories that would emit more GHG by 2050 in the scenarios with 100% adoption of mitigation measures in the world. On the other hand, PCS, ADP and FV would have natural gas flaring and venting and oil production.
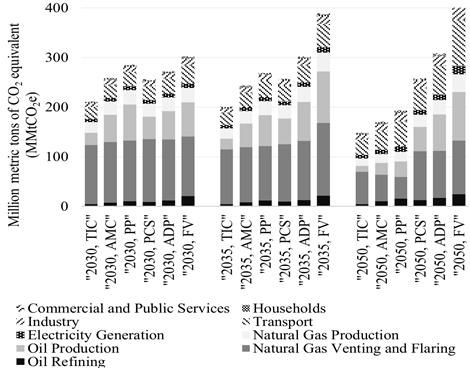
Table 4 shows the energy balance in 2050 for the studied scenarios. Among the scenarios with 100% adoption of mitigation measures in the world an increase in natural gas total demand is evident, with 0.16, 0.20 and 0.25 EJ in TIC, AMC and PP, respectively, as a result of the population growth. PCS, ADP and FV maintained the same behavior, but with 0.22, 0.28 and 0.44 EJ, respectively.
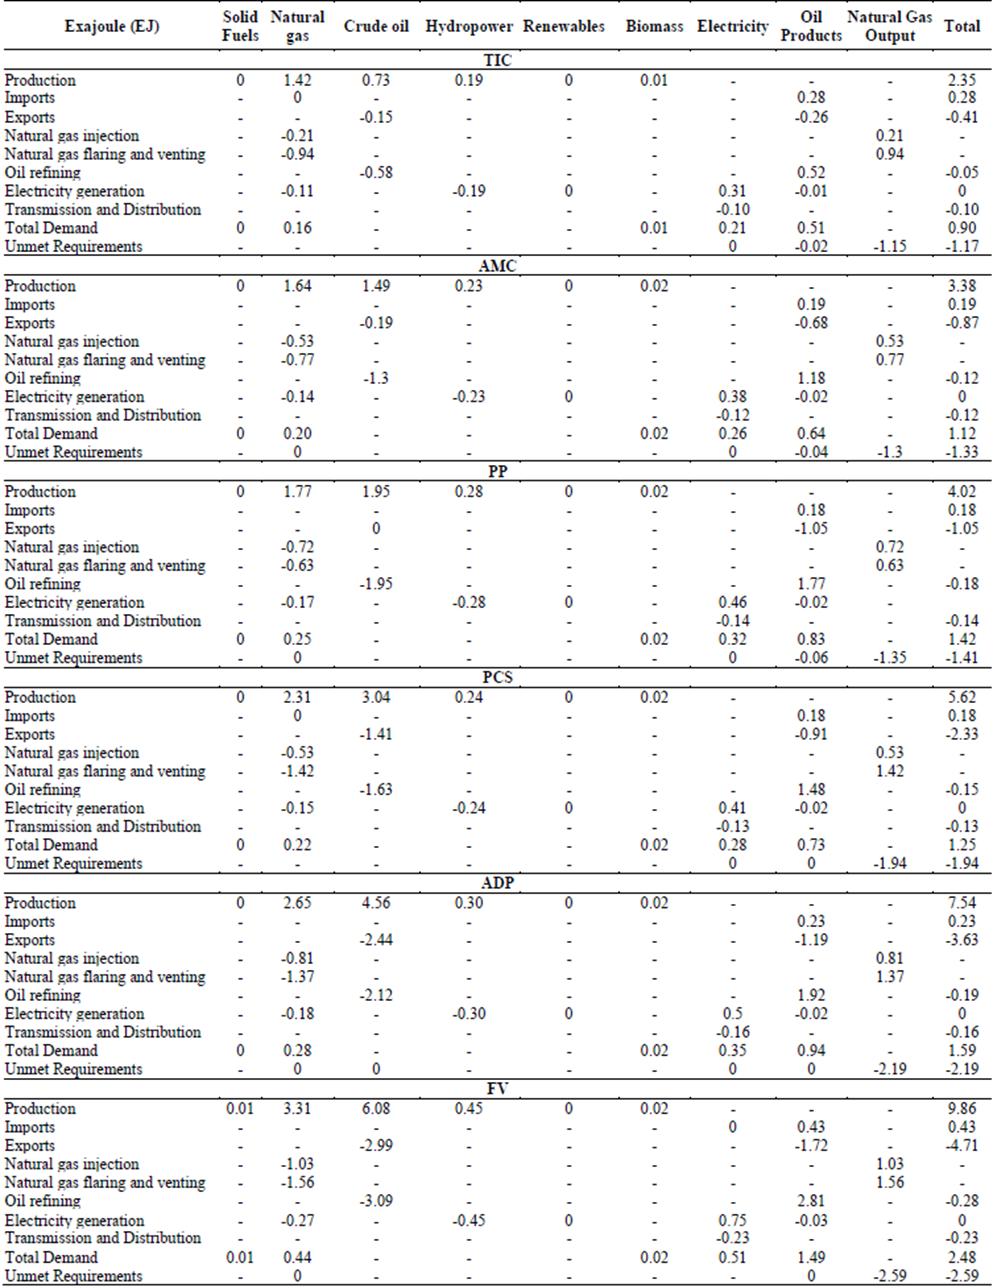
Additionally, the rise in population would lead to an increment of natural gas total transformation, which contemplates the categories of natural gas injection, flaring and venting, and electricity generation, resultant in 1.26, 1.44 and 1.52 EJ for TIC, AMC, and PP scenarios, respectively. This behavior is a consequence of the electricity generation increase from natural gas (0.11 EJ in TIC, 0.14 EJ in AMC, and 0.17 EJ in PP), along with the injection increment to benefit the production (0.21 EJ in TIC, 0.53 EJ in AMC, and 0.72 EJ in PP), leading to a lower amount of natural gas flared and vented (0.94 EJ in TIC, 0.77 EJ in AMC, and 0.63 EJ in PP).
The rise of natural gas production, as well as total transformation, electricity generation and injection would remain in the scenarios PCS, ADP, and FV. Although flaring and venting decreases from PCS to ADP, it would increase in FV. Unlike the other two scenarios without relevance in the adoption of mitigation measures, the peak of flaring and venting in FV would be obtained in 2035, with 2.11 EJ (60,807 Mm3), because in the same year the maximum natural gas production would be reached, and due to its magnitude, it would exceed the increase in injection, natural gas demand and consumption for electricity generation.
In the TIC, AMC and PP scenarios, the rise of crude oil production would not be high enough to maintain the growth in the oil exports, supplying the national demand. Thus, crude oil exports in TIC would be 0.15 EJ, which would increase to 0.19 EJ in AMC and, finally would be approximately zero in PP, with all national production destined to refining.
The opposite would happen to the other three scenarios, where a significant augmentation in oil production would maintain the augmentation in crude oil exports, with 1.41 EJ in PCS, 2.44 EJ in ADP, and 2.99 EJ in FV by 2050.
3.3. Required mitigation measures
Among the studied scenarios, FV is the only one that would exceed the 20% reduction of the GHG emissions established by Venezuela’s NDC. This scenario would require mitigation measures applied to transport, sector demand, electricity generation, and natural gas flaring and venting, which led to a new scenario called FV2. In FV, the transport sector represented 22.20% of total emissions by 2050, with 91.81 MMtCO2e. STEPS scenario indicates that the European Union will promote the use of electrical vehicles, countries such as South Korea and Japan will provide subsidies for the purchase of these vehicles and Canada presented the inclusion of mass public transport buses [15]. For Venezuela, the NDC proposed the guarantee of the public transport service with the “Sistema Trolebús” units with dual motor, preferring the electrical ones [27]. It is observed how different countries seek to implement measures that allows to modify the fuel matrix of the transport sector, migrating to the use of electric vehicles, promoting the use of public transport, reducing the use of gasoline and diesel vehicles, and improving vehicle energy efficiency. As a result, it allows to reduce emissions.
The first mitigation measure considered a change in the transport matrix starting 2026, reaching electric transport 28% of the matrix by 2050. Additionally, gasoline and diesel fuels would represent 65 and 2% of the fuel consumption matrix for this sector by 2050, reducing by 29.94 and 70.64%, respectively. Finally, natural gas would cover the remaining, representing 5% by 2050.
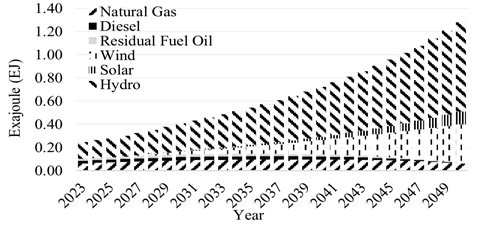
The second measure would consider the introduction of electricity generation with non-conventional renewable sources. Fig. 12 shows the change in the electricity generation matrix starting 2026, until achieving 60% in hydroelectric, 5% in natural gas and 35% in non-conventional renewables, which contemplated 75% of wind and 25% of solar energy by 2050. Although the objective is to reduce GHG emissions, first was necessary to guarantee energy security, maintaining the diversification of the generation matrix, which explains why natural gas was not completely removed.
Finally, the third measure would focus on exporting a fraction of the produced natural gas, reducing consequently natural gas flaring and venting. This mitigation measure was included at Venezuela’s NDC, which proposed the increase of compression, treatment, and distribution capacities for natural gas internal consumption [27].
As the international context considers a market for fossil fuels, the export of natural gas can take an important role for Venezuela. Therefore, the GHG emissions from the flaring and venting category could be reduced by more than 50% by 2050, reaching 0.68 EJ (19,597 Mm3).
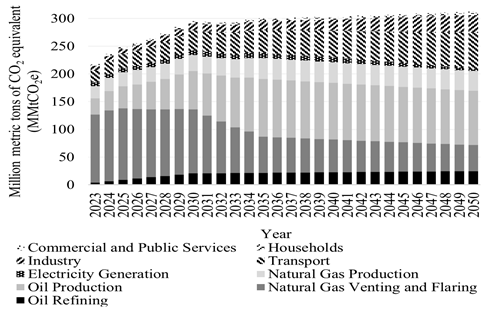
These measures combined would reduce 17.06% of GHG emissions, reaching 295.37, 300.01 and 312.61 MMtCO2e by 2030, 2035 and 2050, respectively, as seen in Fig. 13. However, this would require an additional capacity of 14,500 megawatts (MW) of non-conventional renewables by 2048 and 25,000 MW of hydroelectric capacity by 2040.
4. Conclusions
An energy balance based on the production of oil and natural gas in Venezuela during the period 2023-2050 and the associated GHG emissions was carried out. Six energy scenarios were established considering two main variables: the grade of economic opening in Venezuela and the grade of adoption of mitigation measures in the world, besides demographic and macroeconomic parameters, oil productions adjusted to global energy demand scenarios, as well as compliance with the reduction of GHG emissions established in Venezuela’s NDC.
The scenario with the highest imports in the 2023-2050 period would be TIC, with 6.02 EJ, while the lowest would be FV with 2.95 EJ, being gasoline and LPG the main imported fuels. The scenario with the highest exports would be FV, reaching 116.86 EJ, and TIC the lowest, with 26.91 EJ. Crude oil would be the main exported fuel, representing between 64.89 to 73.80% of total exports.
Potential emissions were determined for scenarios between 211.50 and 302.35 MMtCO2e by 2030 and 200.93 and 388.35 MMtCO2e by 2035, reaching 148.54 and 413.50 MMtCO2e in 2050. Natural gas flaring and venting would be the category that would generate the highest potential GHG emissions by 2050 in all the scenarios, followed up by the transport sector in the scenarios with 100% adoption of mitigation measures in the world, and oil production for those in without a relevance. CO2 and CH4 would be the main GHG emitted, with proportions of 64.07 and 35.77%, respectively, with N2O remaining.
FV would be the only scenario that would exceed the 20% reduction of GHG emissions from the inertial scenario. Mitigation measures in a scenario FV2 were applied in the transport sector, electricity generation and natural gas flaring and venting, without modifying oil and natural gas production, reducing emissions by 17.06%. This scenario would require an additional capacity, needing 25,000 MW of hydroelectric capacity by 2040 and 14,500 MW of non-conventional renewables by 2048.

