




 English (pdf)
 Article in xml format
 Article references

 Automatic translation
 Send this article by e-mail
 Cited by SciELO
 Cited by Google
 Similars in
SciELO
 Similars in Google

 Permalink

1. Introduction
Incorporating sustainability into project management is crucial for enhancing the sustainability performance of projects and making sustainability the foremost concern pertaining to the performance of any project-based organization. Organizations must address the mitigation of biotic and abiotic resource impacts during the execution and initiation of their projects. [1]. The preservation of economic, social, and ecological sustainability is among the most significant challenges faced by our society. [2] Enterprises have come to understand that committing to sustainability, with its various wide-ranging effects, can lead to the achievement of business goals in the planning of projects. [3], It is imperative to align project management (PM) with innovation and sustainability to address evolving social demands. The growing complexity and unpredictability within the PM field have led to advancements in both theoretical and practical aspects. This evolution demonstrates a shift towards a more comprehensive and interdisciplinary approach in project management. To effectively navigate this complexity and uncertainty, it is essential to integrate innovation and sustainability into the discipline of project management [4].
Effectively managing the threat of natural disasters and other significant risks is essential for the survival, durability, and adaptability of organizations of various scales and types. It is a critical component of showcasing their dedication and responsibility to society and the broader environment, integrating efforts to address the impact of climate change. [5]. The contradiction between economic development and environmental protection is becoming more serious, and an innovative ecological compensation policy is a key measure to solve this problem [6].
Nevertheless, strategies aimed at promoting sustainability may not necessarily align with those geared toward project implementation. This discrepancy is largely due to the significant gap that exists between the implementation of projects and their subsequent sustainability outcomes. [7] Despite several studies addressing the relationship between sustainable project management and success, this relationship is still not adequately addressed [8] as well as traditional view of judging projects based on time, budget and quality/scope it is extremely relevant to discuss the social value and contribution to achieving the UN Sustainable Development Goals (SDGs) because these metrics continue to change, even after the project is completed. [9]
Activities vary from project to project and various levels of complexity are involved, so a comprehensive methodology for measuring sustainability at the level of project activities has been largely absent in the literature [10]. Ecological restoration is the most promising way to combat ecological degradation and improve ecological stability. However, it is still unclear at what scale ecological restoration is needed for the region of ecological degradation related to ecosystem services under current and future climate change [11]. The achievement of carbon neutrality by individual organizations would be unattainable without having a negative impact on their economic interests [12].
The extractive industries, which are recognized for their notable local influence, have failed to sufficiently respond to increasing stakeholders’ expectations for contributing to sustainable development. [13] A case that can illustrate such a statement is offshore oil extraction which is a challenging task with multiple dangers, since oil spills, both from daily operations and accidents on the high seas, endanger the marine ecosystem of nearby waters. Unlike traditional damages (i.e. personal injuries and property damage) through the environment, non-contractual liabilities resulting from marine ecological damage require a separate regime where the relevant rules are dispersed in different legal instruments. Some unique characteristics embedded in the Chinese offshore oil industry fundamentally shape the distribution of responsibilities and approaches to ecological remediation. The Bohai Bay oil spill in 2011 showed that China urgently needed to address this issue in practice. [14]
2. Literature review
2.1. Ecological footprint and its ecosystem effects
When studying the relationship between oil consumption and economic growth in terms of carbon emissions and ecological footprint [16], an adverse effect was evident for renewable energies, showing a mitigating impact on both carbon emissions and the ecological footprint. . Furthermore, the study reveals a positive correlation between institutional quality and carbon emissions, with a contrasting negative effect of institutional quality on ecological footprint at lower quantiles. A positive correlation is found between institutional quality and the ecological footprint in the upper quantiles. This study advocates an integrated resource policy that strategically incorporates renewable energy to mitigate carbon emissions and ecological footprint. [17] showed that both natural resource rents and industrial changes considerably influence the ecological footprint. Unlike previous non-spatial studies, this research fuses spatial panel data analysis, emphasizing the regulatory role of juxtaposing natural resource rents with the adjustment of the industrial structure, potentially reducing the impact of economic growth on the ecological footprint.
The energy indicators of African countries [18] the findings indicated that the revenue generated from fossil fuel resources and their usage are substantial contributors to environmental degradation, leading to a notable increase in the ecological footprint among nations. Additionally, the escalation of economic growth and globalization further exacerbates the strain placed on the environment. The detrimental environmental effects of rapid urbanization across countries were also observed. Furthermore, it was determined that the environmental Kuznets curve (EKC) hypothesis, which suggests an inverted U-shaped relationship between ecological footprint and income, was refuted for the overall panel of nations due to their disparities.
2.2. Ecological compensation
The concept of ecological compensation has gained widespread acceptance globally as a result of the imbalances stemming from the rapid advancement of modern society, economy, and the environment, leading to heightened strain on ecosystem carrying capacities. Nevertheless, there exist notable discrepancies in the quantification of ecological compensation standards. Thus, it is imperative to comprehend the procedure behind establishing a rational ecological compensation threshold. [19]
Monetary compensation is, of course, a vital legal remedy to comply with ecological remediation. the legal regulations applicable in China regarding offshore drilling based on a legal and economic approach. This methodology not only addresses the adequacy of compensation, but also whether the applicable rules provide adequate incentives for prevention. In this way, in this type of study the meaning of compensation is limited to an issue of economic compensation and not the recognition of an ecological liability that can be considered.
For several years, Nigeria has been dedicated to the business of oil exploration, prospecting, and marketing, serving as a benchmark in this field. Unfortunately, this has led to the loss of biodiversity and the alteration of the ecosystem. Despite the existence of laws in Nigeria aimed at protecting the environment, there is a lack of comprehensive legislation addressing the issue of compensation and responsibility for those affected by environmental damage. As a result, the compensation received by local people is often unpaid, inadequate, delayed, or contentious, leading to increased poverty. It is important to note that no amount of money can fully restore oil pollution, as a damaged ecosystem cannot be easily repaired. [20]. No matter how much money is paid as compensation in the meantime, the fact is that there is no such thing as restoring oil pollution, because a broken ecosystem cannot be repaired the way a broken bone can [21].
2.3. Regulatory component versus the perception of ecological compensation
To understand the dynamics between consumption and environmental factors [22] Two different models were employed in this investigation. The first model took into consideration carbon emissions, while the second model assessed ecological footprint factors. The study's results demonstrate a direct correlation between oil consumption and economic growth in terms of both carbon emissions and ecological footprint. In contrast, renewable energies were found to have a beneficial impact by reducing both carbon emissions and ecological footprint. Furthermore, the research revealed a positive relationship between institutional quality and carbon emissions, with a contrasting negative effect on ecological footprints at lower levels. However, a positive correlation was observed between institutional quality and ecological footprint at higher levels. The study also examined biodiversity compensation policies, their development, and implementation. [23] depends on the quality of specialized ecological data and requires anticipation, planning, monitoring and control.
The comparison of France and Colombia revealed that the geographical, ecological, and legal factors, including a country's geographic features and legal framework, play a significant role in the effectiveness of compensations. High compensation rates may rely on the allowance of preservation measures, in addition to restoration, as well as the limited availability of space. It is important to find a balance between the legal certainty offered by predetermined ratios and the policies' effectiveness in preventing a net loss of biodiversity.
Efforts to combat climate change [24] Many are still unsure about how economies will attain emissions reductions by 2050. This involves increasing awareness about risks and strategies, enhancing corporate responsibility, staying informed about policy changes and regulations, promoting fair energy transitions, energy democracy, divestments, alternative market solutions, and postponing or cancelling specific hydrocarbon activities. While institutional methods are commonly used to support policy change and regulation, they do not generally contribute to raising awareness or delaying outcomes.
2.4. Standards used in sustainability project management
Projects are essential for achieving more environmentally-friendly business practices. A growing area of interest in project management research is the connection between projects and sustainability. [25] A novel, unique, and evolving ideology in project management has emerged. The key elements of this sustainability-focused approach include viewing projects through a social lens, implementing a stakeholder management strategy, utilizing Triple Bottom Line criteria, and embracing a Values-based approach to projects and project management. Recognizing the pivotal role of projects in enabling these shifts, [26] the concept of sustainability must be integrated into the way projects are selected, prioritized, executed, managed, governed and evaluated. This requires the integration of sustainability into organizational strategy, project portfolio management and project management. However, studies on sustainability in business describe the application of sustainability concepts mainly at the level mentioned above in isolation, with little or no attention to the links between the strategy, portfolio and project levels. [27]
Despite the substantial rise in academic publications on the intersection of sustainability and project management, a notable disparity exists between the theoretical models, tools, and frameworks outlined in scholarly works and the practical application found in project management guidelines. Sustainability aspects remain a key area in need of alignment. [27] are external to the base project, but may need to be included, as the success of the project will be evaluated according to the organization's policies. PRINCE, the PMbok Guide and the International Competence Baseline on stakeholder issues and sustainability conclude that none of the three explicitly consider sustainability issues.
The International Organization for Standardization (ISO) is working on a new set of standards for sustainability and resilience, starting with ISO 371001. However, it does not directly address project management, although the focus on management systems could also apply to the projects. ISO26000 Social Responsibility is developed for all types of organizations and is not limited to corporations and businesses. The seven key principles presented as roots of social responsibility align with the core of sustainability thinking. These are accountability, transparency, ethical behavior, respect for the interests of stakeholders, respect for the rule of law, respect for international standards of behavior, respect for human rights. Other disclosure-oriented sustainability models suggest that [28] the relationship between managers' incentives to disclose management earnings forecasts (MEF) and Global Reporting Initiative (GRI) sustainability reports; Two types of voluntary disclosures that are produced by managers to provide financial and/or non-financial information to interested parties.
As the antecedent determinants of these two disclosures overlap, but the related risks and strategic approaches differ, managers' decisions to disclose MEF and GRI sustainability reports could be independent, cooperative, competitive, or even conflicting. While stakeholders want more high-quality information, managers compromise on the level of disclosure in practice. It is concluded that the recent trend of appeals by regulators, professionals and academics to improve standards in quantity and quality of voluntary disclosures for information users is growing.
3. Methodology
Considering the information collected from the sustainability reports of companies belonging to the hydrocarbon sector, two groups of variables were classified: one that corresponds to the measurement of the resources impacted by this sector in the environmental dimension and another economic variable that measures the performance and financial situation as evidenced in Fig. 1. The first thing that was analyzed was the possibility of a relationship between these two variables in the sense that the economic variables have effects on the environmental ones or the environmental ones on the economic ones.
After cleaning the database, it was decided to work with the years as if they were categories. Next, a principal components analysis was run with the purpose of selecting one or two factors that collect information from all these variables, to replicate the same with other variables and then cross them to determine if they are related. From this observation, their correlation was determined to proceed with the generation of an analysis model.
4. Results
When reviewing the first group of variables to determine their behavior over the last three years as shown in Fig. 1.
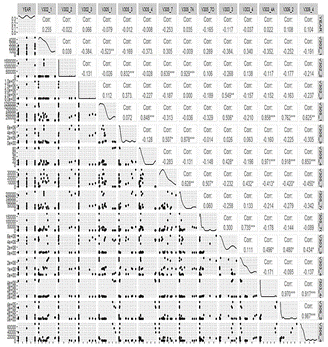
As can be seen, Table 1 reflects that there is a marked correlation between the emission of greenhouse gases and the consumption of non-renewable energy, that is, to the extent that non-renewable resources are used, the impact at the GHG level is greater; Water consumption and extraction are correlated with energy intensity and the method of waste disposal and water landfills are correlated with significant GHG emissions, that is, to the extent that the hydrocarbon sector uses non-renewable resources in its productive process, an effect is generated in the increase of GHG.
Table 1 Correlation of variables in Figure 2
| Variable | Correlation | Variable |
|---|---|---|
| 305_7 Nitrogen Oxide | 0.639 | 302_2 non-renewable consumption |
| 305-7_A Sulfur Oxide | 0.929 | 302_2 non-renewable consumption |
| 305_7_A Sulfur Oxide | 0.878 | 305_3 Other indirect emissions |
| 305-7_A Sulfur Oxide | 0.628 | 305_7 Nitrogen oxide |
| 305_4 GHG emissions intensity | 0.848 | 305_1 direct GHG emissions |
| 305_4 GHG emissions intensity | 0.850 | 303_4 Water spills |
| 305_7_O Other significant GHG emissions | 0.628 | 305_7 Nitrogen oxide |
| 305_3. Other indirect GHG emissions | 0.832 | 302_2 non-renewable consumption |
| 303_4 A water consumption | 0.971 | 306_2 waste disposal method |
| 303_3 water extraction | 0.549 | 302_3 energy intensity |
| 306_2 waste disposal method | 0.625 | 305_1 direct GHG emissions |
| 306_2 waste disposal method | 0.625 | 305_1 direct GHG emissions |
| 306_2 waste disposal method | 0.918 | 305_4 GHG emissions intensity |
| 306_2 waste disposal method | 0.970 | 303_4 A water consumption |
| 306_2 waste disposal method | 0.96 | 306_4 transportation of hazardous waste |
| 303_4 Water spills | 0.735 | 305_7_O Other significant GHG emissions |
Source: self-made
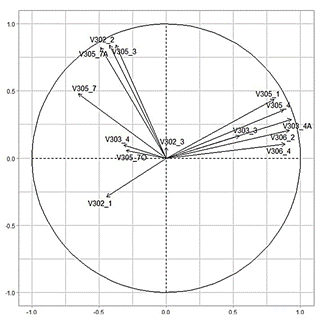
Different groups of variables can be observed, in the upper right quadrant of the circle is the first group of variables made up of 305_1 Direct GHG emissions, 305_4 GHG emissions intensity, 303_4 A Water consumption, 303_3 Water extraction, 306_2 Waste method disposal and 306_4 transportation of hazardous waste.
The upper left quadrant marks a second group made up of the variables 302_2 Non-renewable consumption, 305_3 other direct emissions, 305_7A other sulfur emissions, 305_7 nitrogen oxide and the lower left quadrant of the circle, includes the variables of 302_1 renewable consumption, 305_7O Other significant GHG emissions, 302_3 energy intensity AND 303_4 water landfills.
The group made up of the variables in the upper right quadrant and the group in the lower left quadrant are inverse or their behavior is inverse. This can be explained from the correlation between variables described in Table 1 and that are grouped in the first group. of variables, their relationship is explained because in the production process of hydrocarbon extraction the use of non-renewable resources has an impact on the generation of GHG. This situation explains why this first group of variables is inverse to the third group that contains the renewable consumption variable. It could then be said that they are inverse or negative because the use of renewable resources would reduce the impact of GHGs, without eliminating them, consequently. It could then be other significant GHG emissions, in addition to the impact on energy intensity and the information related to water landfills as a disposal method reveals the limit of the organization at the management level between forms of disposal and inequitable environmental impacts. with environmental impacts and residual effects. In other words, the grouping of the variables of group 1 and three are inverse or could be said to have opposite behavior at the level of the impacts produced on the ecosystems.
The variables located in the upper left quadrant, or the second grouping of variables, are independent in relation to the other groups. This group includes 302_2 non-renewable consumption, 305_3 other indirect emissions, 305_7 sulfur oxide, and 305_7 nitrogen oxide. The correlation of these variables suggests that nitrogen oxide and sulfur are linked to the consumption of non-renewable resources, which in turn affects other indirect emissions of greenhouse gases. Therefore, the behavior of these variables operates independently from the others.
As can be seen in Fig. 3 when the entities are graphed, within the analysis, the behavior of the company GEOPARK and ECOPETROL are the metrics that provide the most information exposed in their integrated information reports. Although Ecopetrol's financial structure is much more robust than GEOPRK's, its impact on the environment in the production process is greater than that of the other entities in most of the metrics analyzed. This allows them to be easily identified in Fig. 3.
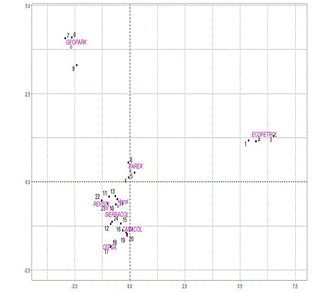
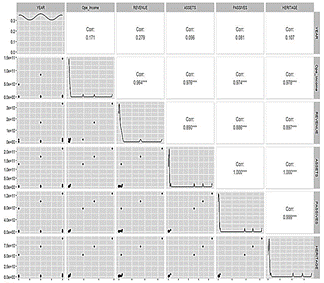
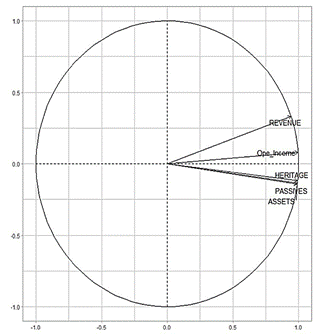
Fig. 4. shows how the operating profit is related to the other accounts of assets, liabilities and equity, this is explained by the fact that to the extent that the profit in the income statement increases, which depends on income, there is an increase in the net worth of the entity and the net worth at its disposal. This result is clear evidence of financial correlation between results and net worth, which allows us to observe permanent financial health in these companies in the hydrocarbons sector.
Source: Own elaboration based on the R program
Figure 4 Analysis of economic variables based on reported financial information
This explains their high relationship as evidenced in the following graph in Fig. 5:
Source: Own elaboration based on the R program
Figure 5 Relationship between the economic variables analyzed.
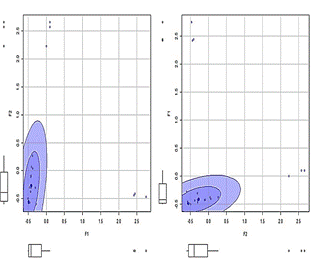
The objective of the observation of the economic variables is the construction of a second factor called base two, which will be crossed with the base one variable, which was obtained from the analysis of the variables of the environmental dimension, previously referenced to identify if there is any degree of correlation between them. Fig. 6 shows that when crossing these variables, no correlation is observed between them.
Source: Own elaboration based on the R program
Figure 6 Graph of the factors obtained from the grouping of the variables.
Data: F1 and F2t = -0.013432, df = 22, p-value = 0.9894; alternative hypothesis: true correlation is not equal to 0; 95 percent confidence interval: -0.4057916, 0.4009963; sample estimates Cor - 0.002863672.
The results presented in Fig. 6 show that there is no correlation between economic and environmental variables. Proof of this is that the correlation index or Pearson's R is very close to zero 0.002863672 and this is demonstrated with the value of P which is equal to 0.9894. The null hypothesis posits that the correlation is zero, but in this case, the correlation differs from zero. In addition, the P value is below 0.05, the predetermined level of significance, indicating the rejection of the null hypothesis. Consequently, it was feasible to reject the claim that the correlation is zero.
Upon examination of the data without Ecopetrol, the absence of any discernible pattern or correlation remains evident.
5. Conclusions
After analyzing the behavior patterns of the variables, it is concluded that there is no pattern or correlation between the economic and environmental variables measured by each of the entities and revealed in the integrated information reports.
When studying the variables, it is found that the use of non-renewable resources and energy is related to the generation of greenhouse gases, the opposite situation when comparing group three of the variables that were inverse to group one of variables basically due to the weight of the variable renewable resources.
This situation could indicate that the mitigation of the impact on the environment produced by the exploitation of hydrocarbons could be mitigated if the use of renewable resources and energies is chosen.
For future work, it would be useful to work with the first group of variables that show correlation or relationships between them.

