SciELO - Scientific Electronic Library Online

 
vol.92 special issue 236Influence of soft skills, and employee productivity, on organizational performance, a developing field: current state and relationshipThe ambidextrous scorecard: a strategic tool for balancing exploitation and exploration in the hospitality sector author indexsubject indexarticles search
Home Pagealphabetic serial listing  

Services on Demand

Journal

Article

Indicators

Related links

  • On index processCited by Google
  • Have no similar articlesSimilars in SciELO
  • On index processSimilars in Google

Share


DYNA

Print version ISSN 0012-7353On-line version ISSN 2346-2183

Dyna rev.fac.nac.minas vol.92 no.spe236 Medellín Feb. 2025  Epub Feb 04, 2026

https://doi.org/10.15446/dyna.v92n236.117292 

Articles

Financial Performance Index (FPIMS): a proposal to measure the performance and project execution capacity in manufacturing companies in Santander (COL)

Índice de desempeño financiero (FPIMS): una propuesta para medir el desempeño y la capacidad de ejecución de proyectos en empresas manufactureras en Santander (COL)

Alfredo Enrique Sanabria-Ospino a  
http://orcid.org/0000-0001-8250-0647

Sandra Marcela Delgado-Ortiz b  
http://orcid.org/0000-0003-2879-3439

Nelson Antonio Moreno-Monsalve b  
http://orcid.org/0000-0002-6372-0430

William Stive Fajardo-Moreno b  
http://orcid.org/0000-0003-1819-1629

a Facultad de Negocios Internacionales, Universidad de Santo Tomas, seccional Bucaramanga, Colombia. alfredoenrique.sanabria@ustabuca.edu.co

b Facultad de Ingeniería, Universidad EAN, Bogotá, Colombia. smdelgado@universidadean.edu.co, nmoreno@universidadean.edu.co, Wfajard74913@universidadean.edu.co


Abstract

The manufacturing sector can be considered the main driver of economic growth in countries, as demonstrated by the macroeconomic variable GDP. However, during the pandemic, the historical rise in exchange rates and the increase in inflation and interest rates resulted in countries’ negative performance. Currently, Colombia ranks last in the world in terms of productivity among OECD member countries. This problem is reflected in the Santander region, where production and sales variables have experienced negative changes, in addition to a stagnation in employment in the manufacturing sector. The objective of this work is to design a financial composite index to measure competitiveness, in addition to analyzing its implications for measuring performance and the capacity to execute projects in manufacturing companies. For the development of the research, an index called FPIMS was estimated for 2392 companies. Correlational analysis was then carried out and the companies were categorized. Finally, machine learning models were used to predict the FPIMS value. The results show that the proposed index can be a useful tool to determine project execution capacity in manufacturing companies in Santander.

Keywords: manufacturing sector; financial performance; competitiveness; project management

Resumen

El sector manufacturero puede considerarse el principal motor del crecimiento económico de los países, como demuestra la variable macroeconómica. Sin embargo, en la época de la pandemia, el alza histórica de las tasas de cambio, el aumento de la inflación y de las tasas de interés se tradujeron en un desempeño negativo de los países. Actualmente, Colombia ocupa el último lugar mundial en productividad en relación con los países miembros de la OCDE. Esta problemática se ve reflejada en la región de Santander donde las variables de producción y ventas tuvieron cambios negativos, además de un estancamiento en el empleo del sector manufacturero. El objetivo de este trabajo es diseñar un índice compuesto financiero para medir la competitividad, además analizar sus implicaciones de para para medir el desempeño y la capacidad de ejecución de proyectos en empresas manufactureras. Para el desarrollo de la investigación se estimó el índice denominado FPIMS para 2.392 compañías, posteriormente realizó un análisis correlacional y se categorizaron las empresas, finalmente se emplearon modelos de aprendizaje automático para predecir el valor del FPIMS. Los resultados mostraron que el índice propuesto puede ser una herramienta útil para determinar la capacidad de ejecución de proyectos en las empresas del sector manufacturero en Santander.

Palabras clave: sector manufacturero; resultados financieros; competitividad; gerencia de proyectos

1. Introduction

The industrial sector is the main engine of economic growth in countries around the world, driving the development of key macroeconomic variables such as gross domestic product (GDP), employment, poverty reduction, increased competitiveness, and productivity in emerging countries[1-4] , there is a relationship between economic indicators and financial performance [5].

Corporate financial performance can be defined as the overall corporate valuation of the main financial statements, balance sheet, the cash flow and the income [6]. In addition, capital structure influences a company's financial performance and results [7] is a key indicator, such as return on investment (ROI), sales growth, and earnings per share (EPS) [8].

Measuring company performance is of vital importance for companies; those that perform well are more likely to improve their long-term development, positively contributing to macroeconomic variables and society [9].

However, currently, in the scientific literature, there is ambiguity in financial performance and business crisis metrics, making it impossible to classify companies as “good “or “bad” [10].

The importance of the quality of financial information has an impact on the efficiency of the economic benefits of companies in the industrial sector, allowing the accurate evaluation of financial performance for decision making [11].

During the COVID-19 pandemic, financial and operating performance in industrial sector companies was affected. [12-14], due to stagnant production, restrictions, border closures, global conflicts, and uncertainty in the manufacturing sector, in addition to rising interest rates, inflation, and political uncertainty [15], profitability is the most affected sector due to the pandemic [16], generating distrust in the industrial sector [17].

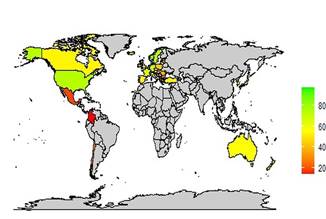
On the other hand, in the global context of OCDE member countries analyzing labor productivity according to GDP per hour worked, the color scale shows green as the highest production per hour and red as the lowest, with the Nordic countries as the most productive, including Ireland with a value of 132 dollars per hour. However, Colombia ranked last in this category at 14.3 USD/Hour (Fig. 1).

Source: National Competitiveness Report [18]

Figure 1 OECD’s world productivity per hour worked 

At a regional level, according to the monthly manufacturing survey with a territorial approach conducted by DANE, the following are the most relevant data for the region [19], taking as cut-off June 2023-2024, analyzing the fundamental variables of the manufacturing sector such as production, sales, and employment in Fig. 2, it can be seen how only 4 departments represented in the green bar of the 15 studied achieved positive variations in real production, analyzing the department of Santander recorded a negative 6.9% in this variable.
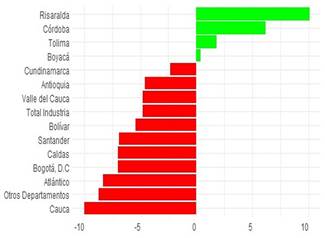
Source: DANE [19]

Figure 2 Variation in Real Production in the manufacturing sector Colombia June2023; Jun. 

The same behavior was seen in the variation of real revenues; only 26% of the total number of departments managed to increase their revenues; revenues the sector in the Santander department decreased by 8.3% (Fig. 3).
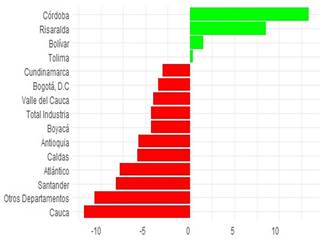
Source: DANE [19]

Figure 3 Variation in Real Revenues in the manufacturing sector Colombia June2023; Jun. 

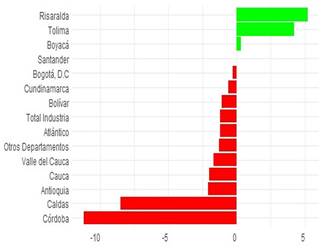
Finally, in the employment variable, only three departments managed to increase this indicator; in the case of Santander, there was stagnation in the generation of new employment, with no positive or negative changes (Fig. 4).

Source: DANE [19]

Figure 4 Changes in manufacturing employment 

In light of the above, the following research question is posed.

How can Santander’s manufacturing sector design a financial performance index to measure performance and project execution capacity?

Considering the previous context, for Shumpeter, in the concept of economic development, entrepreneurs play a relevant role in countries’ financial growth by including innovations and originality in products, markets, and methods, and the economy advances [20], [21]. Ansoff and E. J. McDonnell [22] stated that as a corporate strategy, business planning and the way it evaluates present and future corporate performance through the design of budgets is fundamental, where performance increases when planning is directed toward flexible and innovative environments [23]. On the other hand, competitiveness has been a fundamental factor of research since 1970 in different dimensions, nations, regions, sectors, companies and products. [24]. Porter’s five forces model is an important reference in strategic management, where the integration of the model influences the profitability of the industry [25]. Resource-based theory studies how the company's multiple tangible or intangible resource bundles affect corporate performance, developing strengths or capabilities that allow a differentiating approach with the competition, optimizing resources, achieving superior performance and reaching sustainable competitive advantages [26]. It is important to incorporate corporate governance for the efficient management of resources to be competitive in the long term [27,28]. Competitive advantage is achieved through the resources of the companies or through cooperation between them [29].

2. Methodology

2.1. Data description

To perform the analysis of this research, information from the Compite360 platform, which offers information on the business dynamics of the Santander department in Colombia. This information contained 2392 records of companies in the manufacturing sector that presented information on their financial statements as of December 31, 2023. The variables involved in the analysis were the values reported for assets, liabilities, equity, sales, net profit, debt level, return on equity, return on assets, net margin, and debt-equity ratio. From the variables, the composite indicator called FPIMS was calculated as a financial measure that accounts for the performance and capacity to execute projects in manufacturing companies in the Santander department in Colombia. Correlations between the results obtained from the FPIMS and the origin variables were estimated. Subsequently, the manufacturing companies were classified according to their high, medium, and low performance according to the values recorded by their FPIMS.

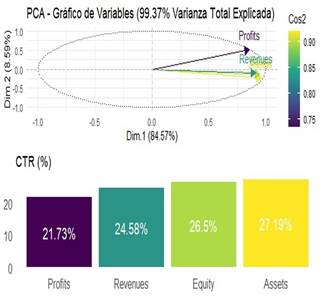
The methodological approach adopted in this study for the design of the FPIMS is the multivariate statistical technique of principal component analysis (PCA), for data processing we used the r Studio programming language with the R commander extension and the factor miner plugins.

The suitability of the sample for the application of the PCA technique is based on the Kaiser-Meyer-Olkin (KMO) and Bartlett tests, where values greater than 0.50 are acceptable for KMO and for Bartlett with a p-value of less than 0.001 [30,31], in addition, for the grouping of the variables, the total variance explained must be greater than 60% [32]. The rationale of this procedure is to allow recombining the base variables into a new group of several combined variables that are unrelated to each other, thus classifying different evaluation indicators and synthesizing the correlation between different parameters, achieving the location and interpretation of relevant data hidden in large data structures [33,34]. Finally, four machine learning models were used to estimate the value of the FPIMS. The models used were linear regression, decision tree, random forest, and gradient boosting.

3. Results

The applied KMO and Bartlett tests showed results of 0.72 and 0.000, being convenient the application of the PCA, the above is in accordance with Çelik & Sürücü. (2024); Dotters-Katz et al. (2024) [35,36]. According to Fig. 5, the total variance explained in dimension 1 by the four variables is 84.57%, which is in accordance with previous studies of Cui et al. (2021) [37]. The same figure also presents the cosine of the variables and the weighting according to the PCA statistical method.

Source: Authors’ elaboration

Figure 5 Analysis of dimensions and weighting of variables 

In the first instance, the composite index was calculated from the variables that make up the dataset and was called FPIMS, for which the following equation was used:

A descriptive analysis of the FPIMS values is presented in Table 1.

Table 1 FPIMS descriptive analysis 

Category FPIMS
Mean 10.095.455.047.224.000
Standard Dev. 4.554.506.791.535.490
Min 540.0
25% 5940792.0
50% 54000000.0
75% 328221607.5
Max 67763276930.0

Source: Authors’ elaboration.

Subsequently, a correlation analysis of the variables that make up the data set with the FPIMS was performed, which allowed us to establish that there is a high correlation between the variables Assets, Liabilities, Equity, Sales, and Net income with FPIMS, which suggests that the composite indicator tends to be higher in companies with a larger financial size, which can be considered as a scale of the company size. Likewise, the relationship between FPIMS and Net income reveals that companies with higher profitability have a higher value for the composite indicator (See Fig. 6).

Source: Authors’ elaboration.

Figure 6 Correlation matrix of financial variables 

The distribution of companies according to their FPIMS levels was then carried out; however, the high dispersion of the data makes the graph difficult to interpret (See Fig. 7). Considering the above, the data were analyzed without considering outliers. In Fig. 8, a higher concentration of companies is observed at a high level; here, a high dispersion is also observed although the outliers are removed.

Source: Authors’ elaboration.

Figure 7 Boxplot of FPIMS by the category 

Source: Authors’ elaboration

Figure 8 Boxplot of FPIMS by category without outliers 

To continue the analysis, four machine learning models were used to predict the FPIMS value: linear regression, decision tree, random forest, and gradient boosting. For each model, the current values were compared with the values that the prediction delivered. The results are presented below.

Based on the results of the machine learning model, we can infer that, for the linear regression model, the R2 performance measure presents a value very close to 1, which indicates an almost perfect fit to the data. Despite this, the prediction may be influenced by the FPIMS estimation methodology, which is based on a linear equation.

Considering the linearity of the model, it could be over-adjusted, so it is not advisable to consider this option when making the prediction (See Fig. 9). The results obtained using the decision tree model were R2 = 0.957, which suggests a good fit. However, the RMSE result, another performance measure determined for the models, indicates a significant number of errors in its predictions compared with the other models performed (See Fig. 10).

Source: Authors’ elaboration.

Figure 9 FPIMS Predicted by Linear Regression 

Source: Authors’ elaboration.

Figure 10. FPIMS Predicted with Decision Tree Model 

Considering the performance results of the random forest model (see Fig. 11), it can be observed that it has better measures than the decision tree, with an R2 of 0.976, and that, when considering the average of multiple decision trees compared to the previously mentioned model, it has a lower propensity to overfitting. Finally, the results of the gradient boosting model, presented in Fig. 12, show outstanding performance compared to the others, with an R2 of 0.989 and the lowest RMSE of all, which suggests that it is the most accurate model to estimate FPIMS among the tested models. The R2 and RMSE values of all models are presented in Table 2.

Source: Authors’ elaboration.

Figure 11 FPIMS Predicted with Random Forest Data 

Source: Authors’ elaboration

Figure 12 FPIMS Predicted with GradientBoosting. 

Table 2 Model’s fit measures. 

Model R2 RMSE
Linear Regression 7.251.443.036.590.290 0.99999
Decision Tree 1.190.025.549.022.340 0.95729
Random Forest 8.959.624.213.932.260 0.97579
Gradient Boosting 5.957.273.702.727.070 0.98929

Source: Authors’ elaboration.

Considering the results obtained, the FPIMS, in terms of estimated values, performance levels in companies in the department of Santander, its correlation with financial variables, and the possibility of being predicted using machine learning, this index can be the basis for determining the performance and capacity to execute projects in manufacturing companies in the department of Santander from five perspectives. The first factor is related to companies’ financial capacity to develop projects, considering that higher FPIMS may be related to greater liquidity and solvency. The second perspective considers the level of risk in developing projects, taking into account that a low FPIMS may suggest a higher risk if these companies attempt to carry out ambitious projects without the financial capacity to support them. Regarding the third perspective, the FPIMS can support the process of allocating resources to projects, if companies with a high FPIMS can take on larger projects, whereas those with a low FPIMS can focus on projects with less resource demand. The fourth perspective considers FPIMS as a tool that supports companies in building and optimizing project portfolios because it allows for the identification of the most feasible projects based on the company's financial strength. Finally, the fifth perspective offers the possibility that the FPIMS can be considered as an argument for obtaining project financing, taking into account that the PIMS shows the company as financially healthy and with a low probability of default.

4. Discussion

The manufacturing sector is considered a key driver of national growth and economic development [38]. However, the manufacturing sector faces several challenges related to achieving sustainable development, poverty reduction, and economic growth [39].

The analysis of financial indicators has conventionally been used to assess the financial health of companies by contrasting internal financial metrics with those of other companies in the same industry [40]. Financial efficiency is of interest to internal and external stakeholders for strategic decision-making and is fundamental for the sustainability of companies evaluated through financial metrics that allow to analyze the economic behavior of the company [41]. This financial decision-making can be supported by financial forecasting models [42]. Identifying how to mitigate companies’ financial risks and promote innovation is a fundamental factor for the economic development of countries’ economies [43].

The case of emerging economies, such as Colombia, specifically the manufacturing sector of the Santander region. The results obtained confirm that since there is a high correlation between financial accounts assets, equity, sales, and income with the FPIMS index, the scale of financial performance is related to the size of the company. Company size can become a performance challenge for profitable production and financing metrics [44]. Large companies have more robust and modern systems that allow better management of information for decision making, reducing risk and allowing them to access more sources of financing at lower cost, which improves financial performance [45]. On the other hand, small and medium-sized enterprises (SMEs) present various challenges in terms of innovation and sustainability due to the existence of barriers in accessing sources of financing [46]. Currently, the sector under study is facing specific problems related to the increase in fuel prices, the deterioration of the region's roads, the lack of financial inclusion of SMEs and the lack of innovation leading to high costs for entrepreneurs that are extrapolated via price, generating loss of competitiveness in the sector.

In addition, it is important to manage project financial risks as a subset of overall project risk management and as a key variable for project compliance derived from funding and profitability, with financial performance becoming a critical factor in the success of a project [47,48]. It is essential that the project office calculates the financial performance and evaluates the results obtained in all phases of the project to find the optimal financial structure and balance between investment and profits [49]

Having non-conventional metrics to measure the financial performance of projects in the region of Santander, the manufacturing sector will allow to analyze the competitiveness of the sector, carrying relevant information to decision makers in order to mitigate financial risks to adopt strategies to improve the financial performance of companies, leading to the generation of corporate value or that will strengthen the financial sustainability contributing to the improvement of macroeconomic metrics achieving local and regional economic development. Therefore, financial results can be considered as the quantification of the objectives achieved by the companies as presented in financial metrics [50].

5. Conclusion, limitations, and future directions

After developing the research in which the Financial Performance Index (FPIMS) was proposed and analyzed, the four main conclusions are shown below First, the capacity of the FPIMS is to reveal the capacity of organizations to develop projects. In this way, and based on the identified correlations of the index with the variables of assets, liabilities, and net income, it can be stated that it also offers the possibility of estimating the financial strength and size of companies. The second conclusion is related to the machine learning models used for the prediction of the FPIMS (linear regression, decision tree, random forest, and gradient boosting), considering that in general, the performance measures showed a good level of fit. However, the gradient boosting model is the most suitable for monitoring financial performance.

The third conclusion is related to the practical implications of FPIMS because the analysis conducted on the companies allowed them to be classified according to their solidity, which can support strategic decision-making processes, resource allocation, and the creation of project portfolios, considering that companies with a high level of FPIMS may have a greater capacity to develop large projects. Finally, the fourth conclusion is related to the opportunity that the FPIMS offers to contribute to the competitiveness of the manufacturing sector in the Santander region considering that it can offer useful information for reducing financial risks and improving performance, which can be key to the growth of the said sector. It is necessary to consider a number of important limitations of this study: first, this study used cross-sectional data; future studies may use longitudinal data that would allow corroboration of the findings presented. Secondly, the study was based on quantitative methods, which analyze large volumes of data; future research may focus on mixed methods, which include case studies, focus groups, and focus groups to validate the numerical results.

References

[1] Gryshova, I., Kyzym, M., Khaustova, V., Korneev, V. and Kramarev, H., Assessment of the industrial structure and its influence on sustainable economic development and quality of life of the population of different world countries, Sustainability, 12(5), art. 2072, 2020. DOI: https://doi.org/10.3390/su12052072. [ Links ]

[2] Bui, P., and Nguyen, P., Unveiling the dynamics: corporate governance’s impact on firm performance in Vietnam’s thriving market landscape, Journal of the Knowledge Economy, 2024, DOI: https://doi.org/10.1007/s13132-024-02271-7Links ]

[3] Rahim, D.A., Supartoyo, Y. Setiawan, H.S., and Kasikoen, K.M., Investment and industrial sector in regional economic performance: Development strategies to Papua-Indonesia, Journal of Infrastructure, Policy and Development, 8(7), art. 4094, 2024. [ Links ]

[4] Manyanga, W., Kanyepe, J., Chikazhe, L. and Manyanga, T., The effect of debt financing on the financial performance of SMEs in Zimbabwe, Cogent Soc Sci, 9(2), Dec. 2023, DOI: https://doi.org/10.1080/23311886.2023.2282724. [ Links ]

[5] Pantea, M., Gligor, D., and Anis, C., Economic determinants of romanian firms’ financial performance, Procedia Soc Behav Sci, 124, pp. 272-281, 2014. DOI: https://doi.org/10.1016/j.sbspro.2014.02.486. [ Links ]

[6] Liu, G., Zhao, L., Wang, X., and Liao, M., Impact of social welfare finance on institutional financial performance: cross-country evidence, Res Int Bus Finance, 70, art. 102385, 2024, DOI: https://doi.org/10.1016/j.ribaf.2024.102385. [ Links ]

[7] Duguleană, C., Duguleană, L., and Deszke, K.-D., Financial performance and capital structure - an econometric approach for Romanian e-commerce companies during the COVID-19 pandemic, Econ Anal Policy, 83, pp. 786-812, 2024, DOI: https://doi.org/10.1016/j.eap.2024.05.024. [ Links ]

[8] Gerschewski, S., and Xiao, S.S., Beyond financial indicators: An assessment of the measurement of performance for international new ventures, International Business Review, 24(4), pp. 615-629, 2015. DOI: https://doi.org/10.1016/j.ibusrev.2014.11.003. [ Links ]

[9] Mousa, K.M.K., Ali, A.A., and Gurler, S., Strategic planning and organizational performance: an empirical study on the manufacturing sector, Sustainability, 16(15), art. 6690, 2024, DOI: https://doi.org/10.3390/su16156690. [ Links ]

[10] Thacker, J., and Saha, D., Financial performance and corporate distress: searching for common factors for firms in the indian registered manufacturing sector, Comput Econ, 2024, DOI: https://doi.org/10.1007/s10614-024-10620-6. [ Links ]

[11] Abu-Hamour, A.M., Saleh, M.M.A., Abdo, K.K., Alzu’bi, A.K.A., Alnsour, E.A., and Jwaifel, A.M.Y., The effect of financial reporting quality on earnings quality of industrial companies, Corporate and Business Strategy Review, 5(2), pp. 38-50, 2024, DOI: https://doi.org/10.22495/cbsrv5i2art4. [ Links ]

[12] Chen, X., and Xu, J., Analysis of financial management practices in China’s manufacturing sector before and during COVID-19: a comparison with Romania, Kybernetes, 2023. [ Links ]

[13] Fares, N., and Lloret, J., Barriers to supply chain performance measurement during disruptions such as the COVID-19 pandemic, International Journal of Quality & Reliability Management, 40(5), pp. 1316-1342, 2023. [ Links ]

[14] Rinaldi, M. and Bottani, E., How did COVID-19 affect logistics and supply chain processes? Immediate, short and medium-term evidence from some industrial fields of Italy, Int J Prod Econ, 262, art. 108915, 2023. DOI: https://doi.org/10.1016/j.ijpe.2023.108915. [ Links ]

[15] D’Ecclesia, R.L., Levantesi, S., and Stefanelli, K., Measuring business impacts on the sustainability of European-listed firms, Socioecon Plann Sci, 96, art. 102078, 2024. DOI: https://doi.org/10.1016/j.seps.2024.102078. [ Links ]

[16] Al-zoubi, A.M., COVID-19 pandemic and financial performance, International Journal of Professional Business Review, 8(4), art. e0825, 2023. DOI: https://doi.org/10.26668/businessreview/2023.v8i4.825. [ Links ]

[17] Tabash, M.I., Farooq, U., Ashfaq, K., and Tiwari, A.K., Economic policy uncertainty and financing structure: a new panel data evidence from selected Asian economies, Res Int Bus Finance, 60, art. 101574, Apr. 2022, DOI: https://doi.org/10.1016/j.ribaf.2021.101574. [ Links ]

[18] Consejo Privado de Competitivad, Informe nacional de competitivdad 2023-2024. [Online]. [Accessed: Oct. 24th of 2024]. Available at: Available at: https://compite.com.co/informe/informe-nacional-de-competitividad-2023-2024/mercado-laboral/Links ]

[19] DANE, Encuesta Mensual Manufacturera con Enfoque Territorial. [Online]. [Accessed: Oct. 23th 2024]. Available at: https://www.dane.gov.co/index.php/estadisticas-por-tema/industria/encuesta-mensual-manufacturera-con-enfoque-territorial-emmet/emmet-historicosLinks ]

[20] Nunes, L.B., Schumpeter’s entrepreneurs in the 20th century: the Tucker automobile, Technol Forecast Soc Change, 102, pp. 14-20, 2016. DOI: https://doi.org/10.1016/j.techfore.2015.02.021. [ Links ]

[21] Winter, S.G., The logic of appropriability: from Schumpeter to Arrow to teece, Res Policy, 35(8), pp. 1100-1106, 2006. DOI: https://doi.org/10.1016/j.respol.2006.09.010. [ Links ]

[22] Ansoff, H.I. and McDonnell, E.J., Corporate strategy, (No Title), 1987. [ Links ]

[23] Globocnik, D., Faullant, R., and Parastuty, Z., Bridging strategic planning and business model management - A formal control framework to manage business model portfolios and dynamics, European Management Journal, 38(2), pp. 231-243, 2020. DOI: https://doi.org/10.1016/j.emj.2019.08.005. [ Links ]

[24] Fang, K., Zhou, Y., Wang, S., Ye, R., and Guo, S., Assessing national renewable energy competitiveness of the G20: a revised Porter’s Diamond Model, Renewable and Sustainable Energy Reviews, 93, pp. 719-731, 2018. DOI: https://doi.org/10.1016/j.rser.2018.05.011. [ Links ]

[25] Lee, H., Kim, M.-S., and Park, Y., An analytic network process approach to operationalization of five forces model, Appl Math Model, 36(4), pp. 1783-1795, 2012. DOI: https://doi.org/10.1016/j.apm.2011.09.012. [ Links ]

[26] Cooper, S.C., Pereira, V., Vrontis, D., and Liu, Y., Extending the resource and knowledge based view: insights from new contexts of analysis, J. Bus Res, 156, art. 113523, 2023. DOI: https://doi.org/10.1016/j.jbusres.2022.113523. [ Links ]

[27] Monson, F.K.S., Unveiling the strategic resource dimension: a bibliometric and systematic review of the Resource-Based View and its application to corporate governance, The Journal of High Technology Management Research, 35(2), art. 100516, 2024. DOI: https://doi.org/10.1016/j.hitech.2024.100516. [ Links ]

[28] Jyoti, C., and Efpraxia, Z., Understanding and exploring the value co-creation of cloud computing innovation using resource-based value theory: an interpretive case study, J Bus Res, 164, art. 113970, 2023. DOI: https://doi.org/10.1016/j.jbusres.2023.113970. [ Links ]

[29] Ozdemir, S., Fernandez-de Arroyabe, C.J., Sena, V., and Gupta, S., Stakeholder diversity and collaborative innovation: integrating the resource-based view with stakeholder theory, J Bus Res, 164, art. 113955, 2023. DOI: https://doi.org/10.1016/j.jbusres.2023.113955. [ Links ]

[30] Reinoso, H., and Türegün, M., Examining the factor structure of MUIS-C scale among baby boomers with hepatitis C, Applied Nursing Research, 32, pp. 111-116, 2016. DOI: https://doi.org/10.1016/j.apnr.2016.06.007. [ Links ]

[31] Youssef, N., and Alharbi, H., Validity and reliability of the English version of the student evidence-based practice questionnaire among Arabic-speaking undergraduate students at health sciences colleges: a cross-sectional study, Nurse Educ Today, 118, art. 105525, 2022. DOI: https://doi.org/10.1016/j.nedt.2022.105525. [ Links ]

[32] Hair, J.F., Black, W.C., Babin, B.J., and Anderson, R.E., Multivariate data analysis: global edition, Pearson Higher Education Upper Saddle River. NJ, USA, 2010. [ Links ]

[33] Elharbili, R., El Moussaoui, T., El Ass, K., Belloulid, M.O., El Alaoui El Fels, A., and Samiri, M.Y., Hybrid data driven approach based on ANNs-PCA for wastewater treatment plant performance assessment, Cleaner Water, 2, art. 100058, 2024. DOI: https://doi.org/10.1016/j.clwat.2024.100058. [ Links ]

[34] Niu, Y., Wang, W., Geng, J., Zhao, W., Zhang, Z., and Li, X., Study on rheological properties and index of Ethylene-Propylene-Diene Monomer (EPDM) sulfur modified asphalt based on principal component analysis (PCA), Constr Build Mater, 449, art. 138546, 2024. DOI: https://doi.org/10.1016/j.conbuildmat.2024.138546. [ Links ]

[35] Çelik, Ö., and Sürücü, A., Soil quality assessment in the Araban plain across various land use types, J King Saud Univ Sci, 36(9), art. 103385, 2024, DOI: https://doi.org/10.1016/j.jksus.2024.103385. [ Links ]

[36] Dotters-Katz, S.K., Grace, M.R., Pilliod, R., Hofler, L.G., Temming, L. and Shanks, A., Cracking the code: interpreting content and phrases used in maternal-fetal medicine fellowship letters of recommendation, Am J Obstet Gynecol MFM, 6(8), art. 101404, 2024. DOI: https://doi.org/10.1016/j.ajogmf.2024.101404. [ Links ]

[37] Cui, F., Kim, M., Park, C., Kim, D., Mo, K., and Kim, M., Application of Principal Component Analysis (PCA) to the assessment of parameter correlations in the partial-nitrification process using aerobic granular sludge, J Environ Manage, 288, art. 112408, 2021. DOI: https://doi.org/10.1016/j.jenvman.2021.112408. [ Links ]

[38] Kaur, M. and Malhan, S., The role of the manufacturing sector in driving India’s Long-Term Growth, in the framework for resilient industry: a holistic approach for developing economies, Emerald Publishing Limited, pp. 301-312, 2024. DOI: https://doi.org/10.1108/978-1-83753-734-120241021. [ Links ]

[39] Oumbé, H.T, Djeunankan, R., and Mougnol, A.K.A., Analysing the effect of foreign aid on industrialization: Evidence from Africa, International Economics, 178, art. 100498, Aug. 2024, DOI: https://doi.org/10.1016/j.inteco.2024.100498Links ]

[40] Gallizo, J.L., Jiménez, F., and Salvador, M., Adjusting financial ratios: a Bayesian analysis of the Spanish manufacturing sector, Omega (Westport), 30(3), pp. 185-195, 2002, DOI: https://doi.org/10.1016/S0305-0483(02)00026-9. [ Links ]

[41] Bărbuță-Mișu, N., Madaleno, M., and Ilie, V., Analysis of risk factors affecting firms’ financial performance-Support for managerial decision-making, Sustainability, 11(18), art. 4838, 2019. DOI: https://doi.org/10.3390/su11184838. [ Links ]

[42] Matuozzo, A., Yoo, P.D., and Provetti, A., A right kind of wrong: European equity market forecasting with custom feature engineering and loss functions, Expert Syst Appl, 223, art. 119854, 2023. DOI: https://doi.org/10.1016/j.eswa.2023.119854. [ Links ]

[43] Xuan, S., Song, D., and You, G., Financial risk prevention and corporate green innovation: A quasi-natural experiment based on the new asset management regulation, Pacific-Basin Finance Journal, art. 102566, 2024. DOI: https://doi.org/10.1016/j.pacfin.2024.102566. [ Links ]

[44] Huang, P.-Y., and Huang, Y.-S., Financing and operational strategies for supply chains with yield uncertainty and capital constraints, Comput Ind Eng, 195, art. 110417, 2024. DOI: https://doi.org/10.1016/j.cie.2024.110417. [ Links ]

[45] Cheng, C., Qiu, K., and Yang, Y., The imprint effect of initial institutional environments and bank financing in family businesses, Emerging Markets Review, 63, art. 101213, 2024, DOI: https://doi.org/10.1016/j.ememar.2024.101213. [ Links ]

[46] Cui, D., Cheng, L., and You, J., Financing constraints and patent investment in small and medium-sized enterprises: a family entrepreneurial perspective, Financ Res Lett, 63, art. 105318, 2024. DOI: https://doi.org/10.1016/j.frl.2024.105318. [ Links ]

[47] Gładysz, B., and Kuchta, D., Sustainable metrics in project financial risk management, Sustainability, 14(21), art. 14247, 2022. DOI: https://doi.org/10.3390/su142114247. [ Links ]

[48] Vrchota, J., Řehoř, P., Maříková, M., and Pech, M., Critical success factors of the project management in relation to Industry 4.0 for sustainability of projects, Sustainability, 13(1), art. 281, 2020. DOI: https://doi.org/10.3390/su13010281. [ Links ]

[49] Coelho, M.B., Lacerda, D.P., Piran, F.A.S., da Silva, D.O. and Sellitto, M.A., Project management efficiency measurement with data envelopment analysis: a case in a petrochemical company, Applied System Innovation, 7(1), art. 2, 2023. DOI: https://doi.org/10.3390/asi7010002. [ Links ]

[50] Oláh, J., Hidayat, Y.A., Dacko-Pikiewicz, Z., Hasan, M., and Popp, J., Inter-Organizational trust on financial performance: proposing innovation as a mediating variable to sustain in a disruptive era, Sustainability, 13(17), art. 9947, 2021. DOI: https://doi.org/10.3390/su13179947. [ Links ]

How to cite: Sanabria-Ospino, A.E., Delgado-Ortiz, S.M., Moreno-Monsalve, N.A., and Fajardo-Moreno, W.S., Financial Performance Index (FPIMS): a proposal to measure the performance and project execution capacity in manufacturing companies in Santander (COL). DYNA, 92(236), pp. 73-80, Febre

A.E. Sanabria-Ospino is a professor at the Faculty of International Business, Universidad Santo Tomas. His research interests are project management, finance, accounting, strategic planning, and entrepreneurship. ORCID: 0000-0001-8250-0647

S.M. Delgado-Ortiz, is BSc. Eng. in Industrial Engineer, Sp. in Quality Management Systems, MSc. Business Administration MBA. PhD. (c) in Organizational Management. Research lines: quality management systems, process management, statistical control, digital transformation projects. Author of several books, book chapters, and research articles. Currently a professor - research at Ean University. ORCID: 0000-0003-2879-3439

N.A. Moreno-Monsalve, is BSc. Eng. in Systems Engineer, Sp. in Project Management, MSc. and PhD in Organizational Management. Main topics: project management, technology management and organizational information systems. Research lines: project management, ethics, organizational culture, project teams and stakeholders. Author of several books, book chapters and research articles. Director of the research group on direction and project management at Ean University. ORCID: 0000-0002-6372-0430

W.S. Fajardo-Moreno is a titular professor and researcher at Universidad EAN. His research interests are project management, data science, and dynamic capabilities. ORCID: 0000-0003-1819-1629

Received: October 30, 2024; Revised: January 09, 2025; Accepted: January 20, 2025

Creative Commons License This is an open-access article distributed under the terms of the Creative Commons Attribution License