




 English (pdf)
 Article in xml format
 Article references

 Automatic translation
 Send this article by e-mail
 Cited by SciELO
 Cited by Google
 Similars in
SciELO
 Similars in Google

 Permalink


1. Introduction
Wax deposition is one of the major flow assurance challenges. During crude oil transportation, the wax of paraffinic crudes can precipitate, form gel and deposit in pipelines. The problems can be greater depending on the content and type of wax. Higher wax content normally lead to higher viscosity, yield stress, pour point values. It also leads to a non-Newtonian behavior in temperatures below the crystallization temperature [1-3]. As to the type, wax can be of low molecular weight, which are linear wax (n-alkanes), called macrocrystalline or high molecular weight wax, which are non-linear wax (iso and cycloalkanes), known as microcrystalline. Macrocrystalline (linear waxes) consists of a distribution of carbon numbers from approximately C20 to C40 and tends to form plate or needle-like and harder crystals. Compared to the microcrystalline, these crystals can cause more problems during the flow. They can crystallize and agglomerate more easily due to their structural similarity, in addition to precipitating and depositing on the pipe walls. The microcrystalline (non-linear waxes) consists of a distribution of carbon numbers from approximately C30 to C70+ and tend to form smaller particles sized and spherical shape [4-7]. The paraffinic gel is composed of waxes that form a network that trap the oil, resulting in solid like plugs that settle. The thickness of this deposit tends to increase and harden with aging. The gel can form during the shut-in of wells. The major problem occurs during the restart process because the plug requires applied pressure to break the gel structure in order to flow. Kurniawan et al [8] studied the influence of macro and microcrystalline wax on gel strength. They found that microcrystalline (non-linear) wax does not have a solid fraction sufficient to form a gel with elastic properties, forming weak gels. While the macrocrystalline (linear) generates a strong physical gel with high elastic properties, forming harder gels. The methods used for paraffin deposition remediation can be thermal, mechanical, chemical or a combination thereof [4-6,9,10]. The thermal method includes insulation and heating of flow. The mechanical one is carried out by passing a pig (a polyurethane plug used to scrape off the paraffin deposited in the pipeline). The name of this practice is pigging. Chemical methods include wax inhibitors, dispersants and solvents. Inhibitors prevent deposits or form softer deposits. Dispersants and solvents help to remove deposits. Pigging often occurs after using these chemical remediation methods. It is a high-risk operation, and the inhibitors can help reduce the frequency of pigging [11,12]. Inhibitors can also have other benefits, they prevent the formation of paraffin networks because they modify the crystals, reduce the pour point, viscosity and yield stress besides preventing deposition by changing the wettability of the surface [13]. Polymers are widely applied as paraffin inhibitors of which poly(ethylene-co-vinyl acetate) (EVA) and poly(methyl acrylates) (MAC) are the most found in literature [3,12,14-17]. Surfactants are also used, but their application is still questioned and require more research. Ethoxylated surfactants are the most reported in literature [15]. Some classes, as ethers and esters are studied only as pour point depressant (PPD) [15,17].
Because petroleum is a complex mixture of many compounds, there are many factors that influence the inhibitors’ action. There are some reports in literature showing the importance of studying the correlation between the oil composition and wax deposition inhibitors [5-7,16]. The studies show that most inhibitors act best on low molecular weight waxes (C34 and below) and less on high molecular weight waxes (C35+) [5,15]. The more efficient analyses to evaluate the wax deposition inhibitors are cold finger, flow loop and rheology [2,4,12,14,18]. The aim of this work is to contribute to greater understanding of the surfactant's action mechanism. For that, alkyl glycerol ether and ester were synthesized and evaluated as paraffin deposition inhibitors. Their results were compared with a commercial polymeric inhibitor.
2. Experimental
2.1. Materials
The crude oils, called A and C, were provided by Rio Petroleo in Rio de Janeiro, Brazil, an engineering company specialized in services for oil producing operators. Oil A properties as well as the SARA value for the crude oils A and C are seen in Table 1 and 2 [19,20].
Table 1 Crude oil A properties
| Description | Method | Result | Units of measure |
|---|---|---|---|
| GT | Rheology | 8.69 ± 0.34 | ºC |
| WAT | Rheology | 14.36 ± 0.13 | ºC |
| WAT | DSC | 17.52 ± 0.03 | °C |
| Water content | ASTM D4377 [21] | 0.42 ± 0.02 | %m/m |
GT - Gelation Temperature; WAT - Wax Appearance Temperature; µDSC - differential scanning microcalorimetry
Source: own authorship.
Table 2 SARA values for crude oil A and C
| Sample | Oil Composition/ %m/m | |||
|---|---|---|---|---|
| Saturated | Aromatics | Resins | Asphaltenes | |
| A* | 46.7 | 45.4 | 7.9 | <0.1 |
| C ** | 59.87 | 30.57 | 9.35 | 0.21 |
* SARA obtained in a previous work [19]
** SARA obtained in a previous work [20]
Source: own authorship.
Methyl dodecanoate, methyl tetradecanoate, 1-bromotetradecane, 97%; 1-bromoctadecane, 97%; 1,2-isopropylidene-glycerol (solketal, 97%), and Amberlyst 15 (wet, hydrogen form) were purchased from Sigma-Aldrich, Rio de Janeiro, Brasil. Tetrabutylammonium bromide (99%), sodium hydroxide (NaOH, 97%), ethanol (95%), Sodium carbonate (Na2CO3) and ethyl ether were purchased from Vetec Química Fina, Duque de Caxias, Brasil. Sodium chloride (NaCl, 99%) and magnesium sulfate (MgSO4, anhydrous) were acquired from Labssynth, São Paulo, Brasil. Deuterated chloroform (CDCl3) was supplied by Tedia of Brazil, Rio de Janeiro, Brasil. Paraffin (mp 58-62°C) was purchased from sigma-Aldrich. Toluene PA was purchased from Synth. A commercial wax inhibitor, named EVA10, based on poly(ethylene-vinyl acetate), was supplied by Braskem, São Paulo.
2.2. Synthesis
Two classes of surfactants were synthesized: Alkyl glycerol ester and alkyl glycerol ethers.
2.2.1. Alkyl glycerol esters
The alkyl glycerol esters were synthetized in two steps, esterification of the solketal and hydrolysis of the solketal ester (Fig. 1), following a procedure adapted from Yu et al [22].
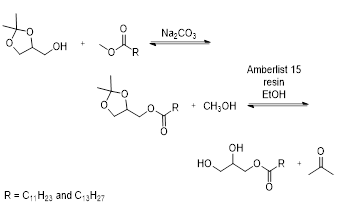
In the first step, methyl esters of different fatty chain sizes (C12 and C14) and solketal with a molar ratio of 1/2 and Na2CO3 (1.7% m/m in relation to the mass of the solketal) were added to a flask. The reaction took place under stirring, for 5 h at 200 ºC. After the reaction was completed, an excess of 1,2-O-isopropylidene glycerol was removed under vacuum (10 mmHg) distillation. The product was dissolved in ethyl ether and washed with water to remove Na2CO3. Then the phases were separated and the ethyl ether was removed from the organic phase to obtain the esterified solketal. In the second step, solketal ester, ethanol 95% (proportion:1g of the solketal ester and 4 mL of ethanol) and Amberlyst 15 resin (10% m/m in relation to the mass of solketal ester) were added to a flask. The mixture was kept under stirring for 3 h at 78 ºC. The final mixture was filtered, and the ethanol was removed to obtain Alkyl Glycerol Esters [23]. The objective was to obtain only monoglycerides molecules (only one esterified hydroxyl group). The products were called GEC12 and GEC14 in this paper.
2.2.2. Alkyl glycerol ethers
The alkyl glycerol ethers were also synthetized in two steps: Etherification of the solketal and hydrolysis of the solketal ether (Fig. 2) [24].
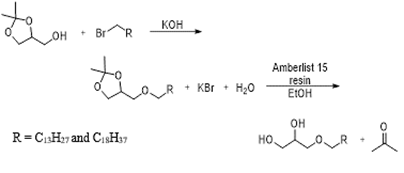
In the first step, a mixture of 0.05 mol of tetrabutylammonium bromide, 0.2 mol of solketal, and 36 mL of 33% (m/m) KOH solution was added to a flask and vigorously stirred for 15 min at ambient conditions. After that, 0.1 mol of alkyl bromide of different fatty chain sizes (C14 and C18) was added dropwise. The mixture took place under stirring for 48 h at 130 ºC. The phases were separated. The organic phase had the etherified solketal. In the second step, solketal ether, ethanol (4.0 mL per 1 g of ether) and Amberlyst 15 resin (0.1 g per 1 g of ether) were added to a flask. The mixture was kept under stirring for 4 h at 100 ºC. Soon after, the mixture was filtered, and the ethanol was removed to obtain Alkyl Glycerol Ethers [24]. The products were called GEtC14 and GEtC18 in this paper. The objective of this procedure was also to obtain glycerol ethers with only one esterified hydroxyl group.
2.3. Characterization of the synthesized surfactants
The reaction products were characterized by Fourier-transform infrared spectroscopy (FTIR), measured with a NICOLET Magna-IR 6700, and by 13C nuclear magnetic resonance spectroscopy (NMR), using a BRUKER DRX-400 instrument.
2.4. Solubilization of commercial inhibitor EVA10 in toluene
The solubilization was carried out by dissolving 0.125g of EVA10 in 5ml of toluene PA, keeping it under stirring for 1.5h at 45°C. The oils were analyzed with 1000 ppm of this mixture, called PI-CX.
2.5. Evaluation of inhibitors’ performance
The inhibitors’ performance was verified by rheological assays (gelation temperature, viscosity and yield stress measurement) and cold finger analysis. All the rheological assays were performed in a Thermo Scientific HAAKE MARS II Rheometer with cone-plate geometry, C60 and they were performed in duplicate. The oil samples were analyzed without and with 1000 ppm of inhibitors (GEC12, GEC14, GEtC14 and GEtC18). The performance of the inhibitors was compared with the commercial polymeric inhibitor (PI-CX). The rheological procedures were described in detail by the group in previous work [19].
2.5.1. Gelation temperature measurement
The oil samples were initially heated from 20 to 60 ºC in rotational mode, and then it was cooled from 60 to -5 ºC at 1 ºC min-1, frequency 1.59 Hz, under a shear stress at 0.01Pa, in oscillatory mode. GT was measured for oil A without inhibitor and with all inhibitors. And for oil C only without inhibitor.
2.5.2. Viscosity measurement
The samples were heated from 20 to 60 ºC and cooled from 60 to 5 ºC, at 1 ºC min-1, both steps in rotational mode. Viscosity was measured for oils A and C without inhibitor and with all inhibitors. This test was also carried out for oil samples only in the presence of 1000ppm of toluene.
2.5.3. Yield stress measurement
The samples were heated to 40 °C and then cooled to 5 ºC in rotational mode. Every 5 degrees, shear rates from 0.001 to 0.2 s-1 were applied and the shear stress was measured in these conditions. Yield stress was measured only for oil A without inhibitor and with all inhibitors.
2.5.4. Cold finger assay
For the cold finger test, a paraffin model system was initially prepared, 40% m/m paraffin (mp 58-62°C) in toluene. The paraffin was solubilized in toluene at 45 °C for 90 min. Four samples were placed in the cold finger in duplicate, the model system without inhibitor and with 1000 ppm of the inhibitors GEC14, GEtC14 and PI-CX, selected based on the first results. A Cold Finger from F5 Technology Model 62 was used. A temperature of 0°C was set in the cold finger to ensure paraffin precipitation and the bath in which the vials were placed was stabilized at a temperature of 50°C to ensure that the paraffin precipitated only on the finger and not on the walls of the vials. In addition, each vial had a magnetic stirrer to keep the sample homogenized. The equipment was programmed for a 24-hour test. After that, the vials were removed from the bath, keeping the fingers connected to maintain the precipitation of the paraffin. The deposited paraffin was dried and weighed.
3. Results and discussion
3.1. Alkyl glycerol esters characterization
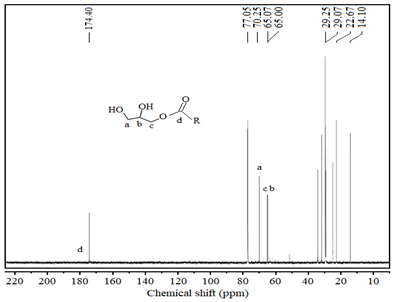
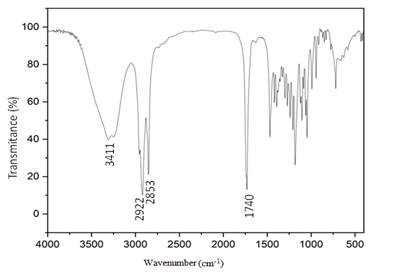
The production of alkyl glyceryl esters was confirmed by FTIR and 13C NMR. As desired, only monoglycerides were obtained. The 13C chemical shifts were quite similar for the two different esters: We can see in Fig. 3, GEC12 13C-NMR spectrum, δ = 174.4 ppm (RCOOR’) for the monoglycerides and absence of signals in 110 ppm (ketal group carbon) and 51.6 ppm (methyl carbon). The GEC12 FTIR spectrum (Fig. 4) presented characteristic peaks at 3411 cm-1 (OH), 2922 and 2853 cm-1 (CH), 1740 cm-1 (C=O for the monoglycerides obtained. The results agree with the literature [25].
3.2. Alkyl glycerol ethers characterization
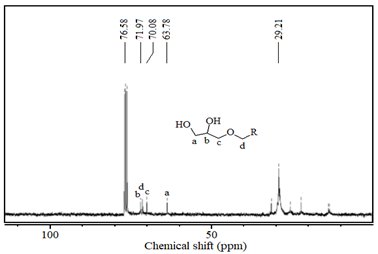
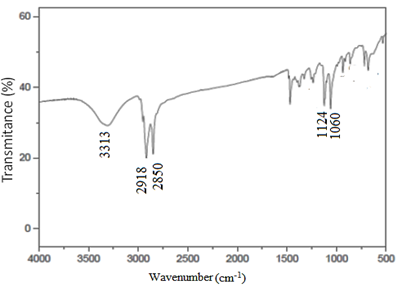
The production of alkyl glyceryl ethers was confirmed by FTIR and 13C NMR. As desired, only monoglycerides were obtained. The GEtC14 13C NMR spectrum presented that the complete ketal conversion (to diol) happened due to the absence of the signal in the at δ = 110 ppm of the carbon in the ketal group. The alkyl bromide was consumed due to the absence of the chemical shift at δ = 33.5 ppm which corresponds to the carbon (CH2) adjacent to the bromine atom. (Fig. 5). While the GEtC14 FTIR spectrum of alkyl glyceryl ethers (Fig. 6), presented their characteristic peaks at 3313 cm-1 (OH), 2918 and 2850 cm-1 (CH), 1124 and 1060 cm-1(C-O). The results agree with the literature [24].
3.3. Gelation temperature measurement
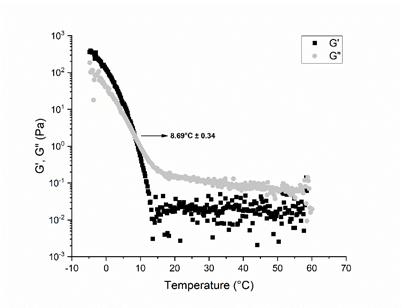
The assays were carried out under shear stress at 0.01Pa, the value which gel formation normally happens. Fig. 7 shows the graphs of G' and G" as a function of temperature for oil A without inhibitor. The GT was obtained as the intersection point between the G' and G" curves. For temperatures higher than the gelation temperature (GT), the G' value is lower than the G" value.
Source: own authorship.
Figure 7 G’ and G” measurement in function of temperature of oil A without inhibitor at 0.01Pa
For temperatures lower than the GT, the G' value is greater than the G" value [26]. G' is the storage modulus, it represents the elastic behavior of the fluid. G" is the loss modulus which corresponds to the viscous behavior of the fluid. The dispersion of points at temperatures above the GT for the G' happens because the gel [27] has not yet formed. The oil sample without inhibitor and with the other inhibitors presented similar behavior. The GT values obtained for all samples of oil A are summarized in Table 3. This oil with inhibitors presented a reduction of GT. This suggests that the inhibitors were able to interfere with the wax crystallization mechanism, reducing the temperature of formation of the three-dimensional crystal network responsible for oil gelation. The GT for oil A without inhibitor was 8.69 ºC, while for the oil in the presence of glycerol ester and glycerol ether additives were between 4.82 and 5.52 °C, respectively. This is the reason why the assays in the sequel will be executed at the range of 9 and 5 °C. All the inhibitors synthetized presented a good performance. They were able to reduce the gelation temperature of oil A around 44% and 36% for the oil in the presence of glycerol ester and glycerol ether, respectively. Considering the measurement errors, we can say that this difference in the performance is not significant. The size of the nonpolar chain also did not significantly interfere with the performance of the inhibitors. In previous work [19], it was observed a reduction in oil GT to -21.49, when using a commercial paraffin inhibitor (PI-CX) at the same concentration (1000 ppm), suggesting that this additive was able to further alter the shapes of the crystals, preventing the formation of paraffin gel.
Table 3 Gelation Temperature measurement of oil A with and without inhibitors
| Inhibitor (at 1000 ppm) | GT(°C) |
|---|---|
| No inhibitor | 8.69 ± 0.34 |
| GEC12 | 5.59 ± 0.33 |
| GEC14 | 5.57 ± 0.33 |
| GEtC14 | 4.96 ± 0.31 |
| GEtC18 | 4.82 ± 0.16 |
| PI-CX* | -21.49 ± 0.35 |
* GT obtained in a previous work [19]
Source: own authorship.
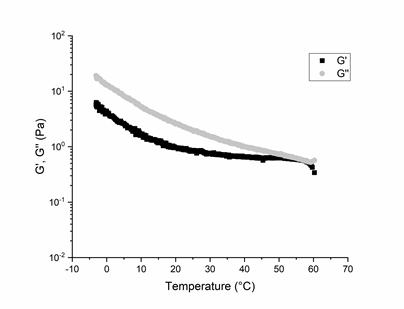
The measurements of G" and G" for oil C (Fig. 8) showed that this oil did not present GT until the final temperature of the test (-5 ºC). There was no intersection between the curves. Because of this, samples were not made with additives containing inhibitors. Based on the SARA (Table 2) of oils and the literature [8], we can say that even though oil C presented a higher paraffin content than oil A, the paraffins must probably be of the microcrystalline type (with higher molecular weights) which have a lower tendency to form paraffin gels.
3.4. Viscosity measurement
The viscosity measurements were carried out for the oils A and C without inhibitors and with the synthetized inhibitors. As the PI-CX inhibitor preparation is done using toluene, the viscosity measurement of the oils A and C were carried out also in the presence of toluene alone to study the influence of this solvent in the crudes viscosity.
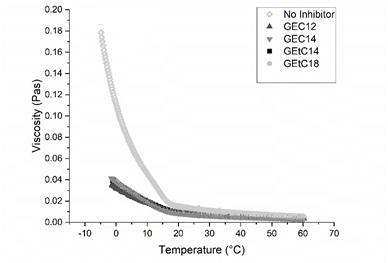
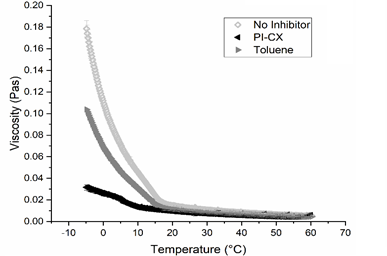
According the Figs. 9 and 10, for the oil A without inhibitor, the waxes dispersed in the medium influenced the oil rheology significantly increasing its viscosity as temperature decreases below GT, as predicted in the literature [28]. While for the oil with inhibitors, they were able to considerably avoid the increase of the oil viscosity in agreement with the literature where the inhibitors are known as rheological modifiers [29]. All the inhibitors had an excellent performance. Table 4 shows the viscosity values at 9 ºC and 5 ºC, which approximately corresponds to the oil GT with and without inhibitors. Among the synthesized inhibitors, GEC12 was the one that presented a slightly better behavior, at both 9 ºC and 5 °C, with a reduction in oil viscosity at both temperatures of around 60%, indicating the formation of softer gels comparing to the others. This phenomenon can be attributed to the presence of the ester carbonyl which may be causing the formation of smaller crystals or crystal dispersion.
Source: own authorship.
Figure 9 Viscosity measurement as a function of temperature of oil A with e without inhibitors
Source: own authorship.
Figure 10 Viscosity measurement as a function of temperature of oil A with PI-CX inhibitor and in toluene
Table 4 Viscosity measurement of oil A at 9 and 5 ºC with and without inhibitors and in toluene
| Inhibitor (at 1000 ppm) | Oil A Viscosity (Pas) | ||
|---|---|---|---|
| 9 ºC | 5 ºC | ||
| No inhibitor | 0.0498 ± 0.0012 | 0.0704 ± 0.0024 | |
| GEC12 | 0.0193 ± 0.0001 | 0.0248 ± 0.0003 | |
| GEC14 | 0.0213 ± 0.000 | 0.0284 ± 0.0003 | |
| GEtC14 | 0.0213 ± 0.006 | 0.0278 ± 0.0011 | |
| GEtC18 | 0.0205 ± 0.000 | 0.0279 ± 0.0003 | |
| PI-CX | 0.0142 ± 0.0010 | 0.0210 ± 0.0020 | |
| Toluene | 0.0344 ± 0.0004 | 0.0467 ± 0.0005 | |
Source: own authorship.
According to the results, we conclude that probably the C12 carbon chain of the GEC12 ester has a greater attraction to the paraffins. Perhaps the smaller chain, when compared to C14 and C18, has an easier diffusion in the medium or it has greater solubility in the medium, favoring the interaction. Comparing the surfactants with a commercial polymeric inhibitor PI-CX, the latter reduced the viscosity around 70% at 9 ºC and 5 °C. In Fig. 10 and Table 4, we can see that the toluene had an influence on the reduction of viscosity for the oil A, reducing this oil viscosity by 33% at 5 ºC. Therefore, it is possible to verify that the reduction in PI-CX was only 37%. These results show that the glycerol esters and ethers inhibitors were more effective in reducing viscosity for oil A. The synthetized inhibitors were able to reduce the oil viscosity more than the commercial polymeric inhibitor, that is normally used by the industry. Despite presenting a small reduction in GT when compared to PI-CX, the gels formed presented a softer consistence, enabling the oil to flow even under severe temperature conditions (5 °C), which justifies its application instead of the commercial inhibitor.
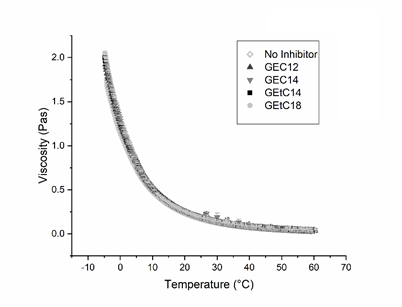
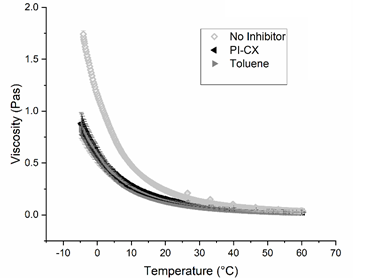
For oil C, the viscosity measurements were carried out at 5 ºC only. Although oil C does not present GT, the temperature of 5 ºC was the same analyzed for oil A. As this temperature is considered a severe condition. The rheological curves for oil C are presented in Figs. 11 and 12. As seen in Table 2, oil C has more asphaltenes than oil A, which justifies the viscosity of oil C being higher than that of oil A. For oil
Source: own authorship.
Figure 11 Viscosity measurement as a function of temperature of oil C with and without inhibitors
Source: own authorship.
Figure 12 Viscosity measurement as a function of temperature of oil C with PI-CX inhibitor and in toluene
C in the presence of synthesized inhibitors there was no reduction in oil viscosity. Since oil C does not have a gelation temperature, it is the type of oil that does not need paraffin inhibitor. In the presence of the commercial inhibitor (PI-CX), oil C showed a reduction in viscosity (Fig. 12). In this figure we can see that the toluene also had an influence on the reduction of viscosity for oil C. The reduction in viscosity was approximately the same for PI-CX and toluene (Table 5), proving that the efficiency effect was only due to toluene.
Table 5 Viscosity measurement of oil C at 5 ºC with and without inhibitors and in toluene
| Inhibitor (at 1000 ppm) | Oil C Viscosity (Pas) 5 ºC |
|---|---|
| No inhibitor | 0.7341 ± 0.0096 |
| GEC12 | 0.7918 ± 0.0253 |
| GEC14 | 0.8049 ± 0.0078 |
| GEtC14 | 0.8075 ± 0.0031 |
| GEtC18 | 0.8047 ± 0.0136 |
| PI-CX | 0.3896 ± 0.0350 |
| Toluene | 0.3689 ± 0.0332 |
Source: own authorship.
The change in behavior of the viscosity of oil A value under 15 °C is a typical behavior of oil when the paraffins appear, disperse in the medium, grow and agglomerate to form the gel and deposit in the pipelines. For this type of oil, the paraffin inhibitors were able to block the formation of the crystal network which, as a consequence generated a soft gel. Oil C does not have a gelation temperature and the increase in viscosity occurs with the decrease in temperature exponentially, without forming two straight lines. In this case, even though the paraffins do not form gel, they act on the increase of viscosity.
3.5. Yield stress measurement
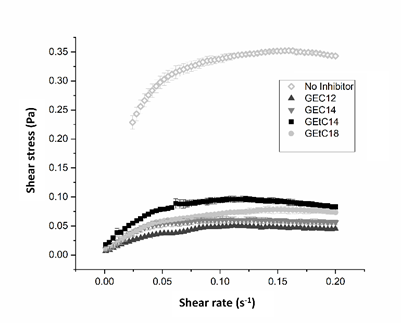
To quantify the yield stress (gel breakdown), the shear stress was measured by varying the shear rate. These measurements were carried out at temperatures from 35 °C to 5 °C every 5 °C for oil A samples without and with wax inhibitor (GEC12, GEC14, GEtC14, GEtC18 and PI-CX). The yield stress was determined when the shear stress value increased with the shear rate and reached a maximum value forming a plateau [2]. This behavior only occurred at 5 ºC, both for the oil without and with inhibitors, but it was more evident in the system without the inhibitor. This result makes sense because according to Table 3, at 5 ºC the oil without inhibitor has already formed a gel, the oils with synthesized inhibitors are starting to form a gel and the oil with PI-CX has not formed a gel. The other temperatures almost coincide with the x axis. The comparison of yield stress values at 5 °C for oil A samples without and with inhibitors can be seen in Table 6 and Fig. 13. The results of Table 6 show that the presence of inhibitors significantly reduced the yield stress by around 86% for glycerol esters,70% for glycerol ethers and 98% for PI-CX. Among the synthesized inhibitors, GEC12 was the one that presented the best result according to the results found in viscosity measurements a 5 ºC (Table 4). The results make sense since if the gel is softer, its viscosity and yield stress are lower. As for the commercial inhibitor, we can say that the oil doped with this inhibitor will have no problems restarting the flow after a production stoppage. Yield stress tests were not performed for oil C because this oil did not show a gelation temperature down to -5°C, and therefore did not form a gel.
Table 6 Yield stress measurement of oil A with e without inhibitors
| Inhibitor | Yield Stress (Pa) |
|---|---|
| No inhibitor | 0.352 ± 0.003 |
| GEC12 | 0.050 ± 0.001 |
| GEC14 | 0.061 ± 0.005 |
| GEtC14 | 0.096 ± 0.004 |
| GEtC18 | 0.078 ± 0.006 |
| PI-CX* | 0.01 ± 0.01 |
* Yield stress obtained in previous work [19].
Source: own authorship.
3.6. Cold finger assay
Cold finger is an equipment to try to simulate the conditions where fluid flow is halted, as when a well shuts down. As the cold finger test requires a large amount of oil, the study of paraffin deposition was done with model system. And as we noticed that the size of the fatty chain has not shown a significant change in the performance of the inhibitors, only two synthetized inhibitors were chosen (GEC14 and GEtC14). In this case, maintaining the size of the fatty chain and varying only the polar segment of the surfactants (ether and ester). The results were compared with the commercial polymeric inhibitor. The masses after removing the model system from the cold finger, the deposited masses can be seen in Table 7. Analyzing the table, the inhibitors GEC14 and GEtC14 reduced the paraffin deposition (around 30%). For this wax type and amount, the cold finger results show that there was no significant change between ester and ether. While in the presence of PI-CX the mass deposited presented 77% of reduction (from 6.05 to 1.38).
4. Conclusion
Rheological and cold finger tests showed that both the synthesized inhibitors and the commercial inhibitor could act as excellent paraffin inhibitors for one of the oils tested (oil A), reducing all the parameters studied, as gelation temperature, viscosity, yield stress and wax deposition. Even though the efficiency of the polymeric inhibitor is much greater than that of glycerol ethers and esters, these surfactants presented a reduction in rheological parameters and wax deposition in cold finger assay sufficient to form soft gels which help the flow of the oil. Comparing the synthesized inhibitors, the efficiency in reducing GT was not significant between them. The glycerol ester with a chain length of 12 carbons (GEC12) reduced the viscosity and yield stress slightly more than the others. These two low rheological parameters are important to maintain the flow, especially when restarting the well. Both inhibitors (GEC14 and GEtC14) presented the same reduction in wax deposition. The tests on oil C, which did not show a gelation temperature down to -5°C, showed that not all oils need paraffin inhibitors. Paraffin inhibitors did not influence the behavior of this type of oil.
Surfactant-type inhibitors are not yet widely used as paraffin inhibitors because polymeric inhibitors tend to provide better results as seen in the tests performed. But besides glycerol esters and ethers being biodegradable, another great advantage is that the entire product is considered active material. The efficiency is due to the surfactant-paraffin interaction. Polymeric inhibitors are usually sold on the market with low concentration of active material, requiring a large amount of product to be used to reach the required effect. Furthermore, it is usually prepared in toluene which promotes a reduction in viscosity masking the effect of the inhibitor.
From an industrial and economic perspective, comparing glycerol ester and ether, the first one is a more promising candidate for large-scale application. The esterification route requires fewer synthesis steps, milder reaction conditions, and employs cheaper and renewable reagents such as methyl esters (the main component of biodiesel) and glycerol, which is generated as a by-product in biodiesel production. On an industrial scale, synthesizing fatty-chain glycerol esters from these materials would be particularly attractive, as it would integrate wax inhibitor production into existing biodiesel production, enhancing both cost efficiency and sustainability.

