


 English (pdf)
 Article in xml format
 Article references
 Send this article by e-mail
 Cited by SciELO
  Cited by Google
  Similars in
SciELO
Similars in
SciELO  Similars in Google
 Permalink
Introduction
Puberty is a stage during which substantial physical, biological, and psychological changes occur,1 so height growth patterns in this period are a key focus of adolescent health. 2 Secular changes in the height of populations in different countries have been reported since the 1960s; 3,4 however, this phenomenon has slowed or even stopped in many countries, so current studies on the growth and development of children and adolescents can serve as important tools in the clinical evaluation of this population. 5,6
One of the hallmarks of puberty is the occurrence of a period of accelerated growth. In this regard, it has been observed that age at peak height velocity (APHV) provides an objective measure to determine the time at which puberty occurs. 1 Therefore, it should be noted that the annual increases in which height velocity (HV) values rise sharply are key aspects to study the maturation status of children and adolescents and determine the onset of puberty.7 In fact, growth descriptions incorporating age at minimal pre-spurt height velocity (AMHV) and APHV have been increasingly used to study the growth spurt interval, which occurs approximately between the ages of 12 and 15 years, 8-11 and are particularly valuable to clinicians as references for expected growth. (12
While international references such as those of the Centers for Disease Control and Prevention (CDC) 13 and the World Health Organization (WHO) 14,45 are useful for comparing growth between regions or countries, they may not be appropriate for clinical assessment of growth in populations of certain countries. 16-21 For this reason, it is necessary to conduct local studies on growth patterns to establish reference values that more accurately describe the physical development of children and adolescents in a given context.
In Colombia, some studies have been carried out on this subject. For example, in 2021, López-Laiseca & Massuça22 conducted a systematic literature review (18 articles) that aimed to identify and summarize original research studies on basic body dimensions in children and adolescents aged 2 to 18 years, with emphasis on the Colombian population. Likewise, in 2023, these same authors published a study in which they established percentile growth references for height, weight and body mass index of children and adolescents between 2 and 18 years of age in the department of Huila (n=130 599), demonstrating that the height of this population is below the international references described by the CDC and WHO. 23
In view of the above, authors such as Yoshii & Tanaka24 point out that standard growth charts are essential for evaluating an individual's growth. However, the growth patterns underlying these observations remain limited as they have not been fully described, so their clinical significance is still unclear. Thus, it seems appropriate to respond to the needs of researchers and local physicians in Colombia by presenting a detailed description of the biological parameters of growth spurts during puberty in terms of height or stature (AMHV, APHV, and age at minimal pre-spurt height velocity return [AMHVR]), which would facilitate (and expand) the direct comparison of height growth in children and adolescents in the department of Huila with the CDC13 and WHO references. 14,15
Considering the foregoing, the objectives of the present study were to identify AMHV, APHV and AMHVR in the population of Huila, and to construct height velocity curves.
Materials and methods
Data analyzed
The calculation of HV and the plotting of its curves were based on data collected from a total of 130 599 children and adolescents between 2 and 18 years of age (males: n=65 467; females: n=65 132) users of public health institutions in the 37 municipalities of the department of Huila. This sample consists of children and adolescents from rural and urban areas and from low- and middle-income households registered between 2009 and 2016 in the Identification System of Potential Beneficiaries of Social Programs. Data were provided by the Ministry of Health of the Department of Huila as reported in the letter of authorization to use the data under file No. 2017sal00002074-1 dated February 22, 2017. The distribution of participants by age group and sex is presented in Table 1.
Table 1 Distribution of the sample by age and sex.
| Age (years) | Sex | Total | |
|---|---|---|---|
| Male | Female | ||
| 2.0 | 94 | 80 | 174 |
| 2.5 | 58 | 56 | 114 |
| 3.0 | 53 | 74 | 127 |
| 3.5 | 64 | 66 | 130 |
| 4.0 | 58 | 66 | 124 |
| 4.5 | 59 | 57 | 116 |
| 5.0 | 4 656 | 4 527 | 9 183 |
| 5.5 | 9 740 | 9 394 | 19 134 |
| 6.0 | 9 635 | 9 137 | 18 772 |
| 6.5 | 8 961 | 8 421 | 17 382 |
| 7.0 | 8 234 | 7 777 | 16 011 |
| 7.5 | 4 096 | 4 154 | 8 250 |
| 8.0 | 4 752 | 4 755 | 9 507 |
| 8.5 | 3 502 | 3 373 | 6 875 |
| 9.0 | 3 978 | 3 823 | 7 801 |
| 9.5 | 2 582 | 2 624 | 5 206 |
| 10.0 | 1 538 | 1 432 | 2 970 |
| 10.5 | 529 | 544 | 1 073 |
| 11.0 | 356 | 407 | 763 |
| 11.5 | 222 | 306 | 528 |
| 12.0 | 186 | 284 | 470 |
| 12.5 | 160 | 259 | 419 |
| 13.0 | 191 | 239 | 430 |
| 13.5 | 116 | 239 | 355 |
| 14.0 | 241 | 412 | 653 |
| 14.5 | 330 | 481 | 811 |
| 15.0 | 191 | 340 | 531 |
| 15.5 | 132 | 312 | 444 |
| 16.0 | 157 | 282 | 439 |
| 16.5 | 129 | 266 | 395 |
| 17.0 | 180 | 350 | 530 |
| 17.5 | 199 | 375 | 574 |
| 18.0 | 88 | 220 | 308 |
| Total | 65 467 | 65 132 | 130 599 |
Source: Own elaboration.
Geographic distribution of the population
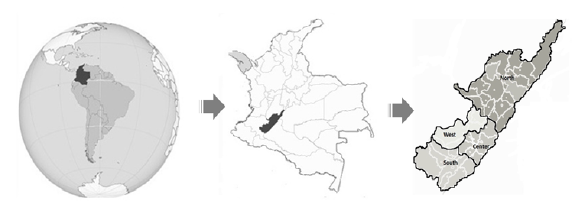
The department of Huila is located in southern Colombia and comprises 37 municipalities grouped into 4 regions: center, north, west, and south (Figure 1). Huila is characterized by its diverse climates and the temperature varies depending on altitude. According to the 2005 census conducted by the National Administrative Department of Statistics (DANE by its acronym in Spanish), 25 the census population in Huila was 1 001 476 inhabitants (adjusted population as of June 30, 2005, 1 011 418 inhabitants), of which 600 801 lived in the municipal seats and 400 675 in the rest of the territory. Ethnically, the population is divided into mestizos (97.8%), Afro-descendants (1.2%), and indigenous people (1.0%).
Age at peak height velocity
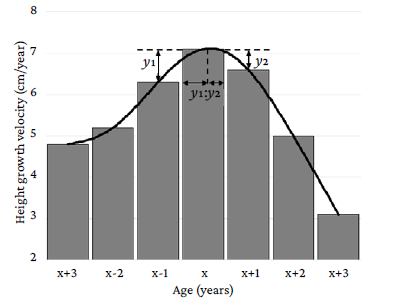
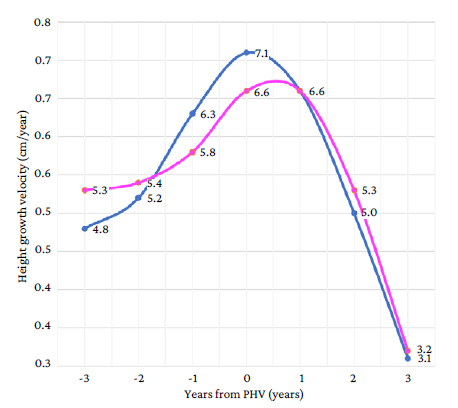
HV was defined as the difference between heights at two age points, one year apart, and peak height velocity (PHV) as the maximum HV value. APHV was determined by calculating the difference between PHV and HV during the year before/after PHV age using the formula x-[y2/(y1+y2)], where x, y1 and y2 are defined as the age at PHV, the absolute value of the difference between PHV and HV one year before the age at PHV, and the absolute value of the difference between PHV and HV one year after the age at PHV, respectively24 (Figure 2).
Growth spurt
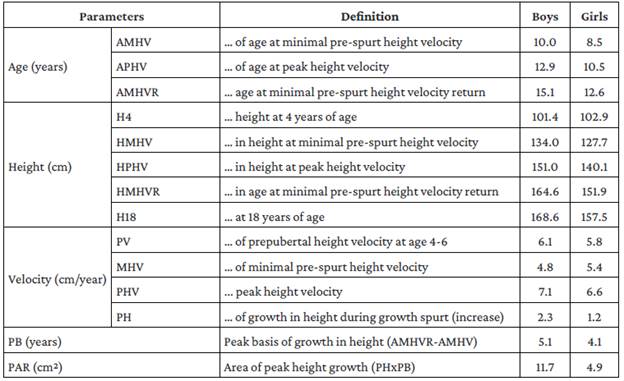
After estimating the APHV, the following parameters were calculated and/or determined: (i) AMHV, defined as the age at the beginning of the growth spurt; (ii) AMHVR, defined as the age at which the end of the growth spurt occurs and represents a measure of its duration; (iii) height at 4 years of age (H4); (iv) height at minimal pre-spurt height velocity (HMHV); (v) height at peak height velocity (HPHV); (vi) height at minimal pre-spurt height velocity return (HMHVR), defined as height at the end of the growth spurt; (vii) height at 18 years of age (H18); (viii) prepubertal height velocity at age 4-6 (PV), defined as the average annual increase between the ages of 4 and 6 years.; (ix) minimal pre-spurt height velocity (MHV), which represents the beginning of accelerated growth; (x) PHV; (xi) peak height (PH), which is defined as the increase in height growth velocity during the growth spurt and is determined by the formula PHV-MHV; (xii) peak basis (PB), which is calculated using the formula AM-HVR-AMHV and is a measure of the duration of the spurt; and (xiii) peak area (PAR), which is estimated with the formula PHxPB and is a measure of the intensity of the growth spurt.26 Furthermore, the age at which the last increase in height growth occurred was determined. 26 Figure 3 presents the parameters considered in the height growth increment analysis.
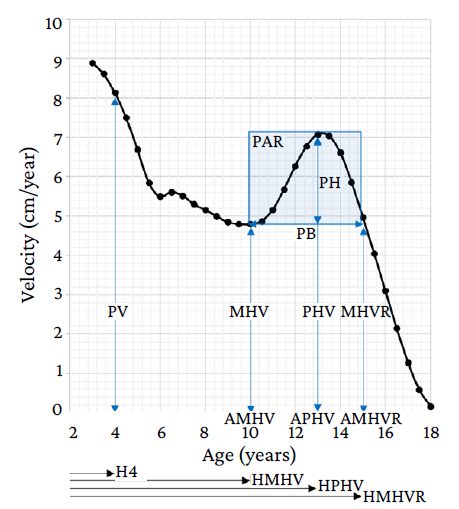
AMHV: age at minimal pre-spurt height velocity (years); AMHVR: age at minimal pre-spurt height velocity return (years); APHV: age at peak height velocity (years); H4: height at 4 years of age (cm); HMHV: height at minimal pre-spurt height velocity (cm); HMHVR: age at minimal pre-spurt height velocity return (cm); HPHV: height at peak height velocity (cm); MHV: minimal pre-spurt height velocity (cm/year); MHVR: minimal pre-spurt height velocity return (cm/ year); PAR: peak area (cm2); PB: peak basis (years); PH: peak height (cm/ year); PHV: peak height velocity (cm/year); PV: prepubertal height velocity at age 4-6 (cm/year).
Source: Own elaboration.
Figure 3 Parameters considered in the analysis of growth spurt.
Statistical analysis
HV was calculated using the least median of squares (LMS) method. In addition, Box-Cox transformations were used to fit the data to a normal distribution.27 L, M, and S values were smoothed for each age and sex range. 28 Sex-specific HV reference ranges were constructed using the LMS method and LMSchartmaker Pro version 2.54 (Medical Research Council, London, UK) 29 with three curves representing skewness (L-curve), median (M-curve), and coefficient of variation (S-curve).
The distance curves for height and HV were constructed based on the work of López-Laiseca & Massuça23 and Yoshii & Tanaka. 24 The following parameters were considered in the analysis of HV curves: AMHV, APHV, AMHVR, H4, HMHV, HPHV, HMHVR, H18, PV, MHV, PHV, PH, PH, PB, and PAR Figure 3 and Table 2). 26 In addition, the AMHV, APHV and AMHVR parameters were compared with CDC13 and WHO reference data, 14,15 and the age at which the last increase in height growth occurred was determined.
Ethical considerations
The study followed the ethical principles for biomedical research involving human subjects established in the Declaration of Helsinki30 and the scientific, technical and administrative standards for health research of Resolution 8430 of 1993 issued by the Colombian Ministry of Health. 31 Furthermore, it was approved by the Research Ethics Committee of the Caribbean Foundation for Biomedical Research BIOS by means of minutes No. 0127 of July 31, 2015.
Results
Of the 130 599 children and adolescents, 50.13% were boys and the following observations were made. In boys, HV started at age 10 (AMHV) and ended at age 15.1 (AMHVR), the maximum height growth velocity occurred at age 12.9 (APHV; PHV=7.1cm/year), and the last increase in height occurred at age 17.5. In girls, the age of growth spurt onset was 8.5 years (AMHV) and ended at 12.6 years (AMHVR), the maximum height growth velocity occurred at 10.5 years (APHV; PHV=6.6cm/year), and the last increase in height occurred at 16.9 years.
The height growth patterns of boys and girls reveal that: (i) AMHV in girls occurred 1.5 years earlier than in boys; (ii) APHV in girls occurred 2.4 years earlier than in boys (PHV=6.6cm/year); (iii) AMHVR in girls was 2.5 years earlier than in boys (15.1 years); (iv) PB was 0.9 years longer in boys than in girls (2.9 years and 2.0 years, respectively); and (v) PH was higher in boys (+1.1cm/year; boys: 2.3cm/year, girls: 1.2cm/year).
The height spurt increment parameters are summarized in Table 2.
Table 2 Height growth spurt parameters of children and adolescents in Huila, Colombia.
Source: Own elaboration.
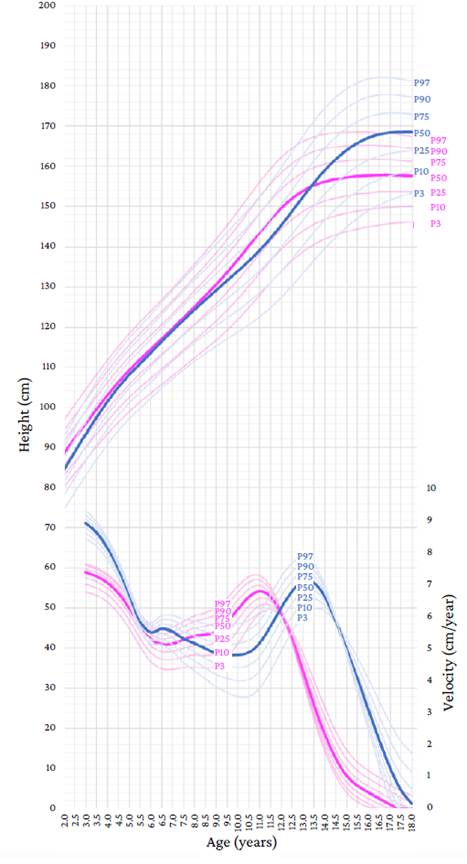
Reference values for height and HV curves aligned according to the distance from APHV are presented in Table 3 and Figure 4, respectively.
Blue: male; Pink: female.
Source: Own elaboration.
Note: Distance curves for height (left y-axis) indicate the height attained at a given age, and velocity curves (right y-axis) indicate the growth rate at a given age.
Figure 4 Height growth velocity curves aligned according to the distance from the age at peak height velocity in boys, girls and adolescents of Huila, Colombia.
Table 3 Reference values for height (cm) of children and adolescents in Huila, Colombia, according to the distance from age at peak height velocity.
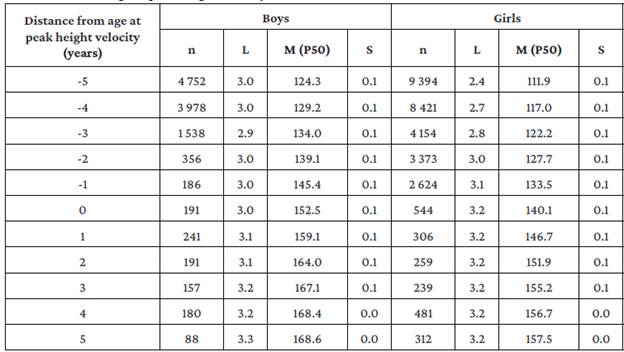
L: skewness; M: median; S: coefficient of variation; P50: 50th percentile.
Source: Own elaboration.
The height growth curve shows that, in the 50th percentile, the height of girls increased before that of boys (Figure 5). Likewise, it can be observed that girls entered the growth spurt earlier and have a higher height growth rate than boys in the same period, with their height being higher than that of boys from the age of 8.5 years (first point of intersection). However, as boys began to enter the growth spurt, the height growth rate accelerated, with boys' height surpassing that of girls at age 13.5 years (APHV), creating the second point of intersection. From this age on, the gap between the height of boys and girls continued to widen until the age of 18 (168.6cm and 157.5cm).
Discussion
The present study found that in boys: (i) HV begins at 10 years of age (AMHV) and ends at 15.1 years of age (AMHVR), (ii) APHV occurs at 12.9 years of age (PHV=7.1cm/year), and (iii) the last increase in height occurs at 17.5 years of age. In turn, in girls, it was found that: (i) HV begins at 8.5 years of age (AMHV) and ends at 12.6 years of age (AMHVR), (ii) APHV occurs at 10.5 years of age (PHV=6.6cm/year), and (iii) the last increase in height occurs at 16.9 years of age. Thus, it should be noted that: (i) AMHV, APHV and AMHVR in girls occur 1.5, 2.4 and 2.5 years earlier than in boys, respectively, and (ii) PHV in boys is longer (PB: +0.9 years) and more intense (PAR: +1.1 cm/year) than in girls.
In this regard, marked sex differences were observed, with AMHV and APHV in girls occurring earlier than in boys. This is consistent with what has been described in the literature, as Malina et al. 32 had already reported that girls start their period of adolescence two years earlier than boys on average and that, therefore, they reach the peak of growth earlier.
In fact, in the HV curve presented in Figure 5, it is observed that: (i) PHV occurred earlier in girls, because girls entered their growth spurt earlier and their height growth velocity was higher than that of boys in the same period; (ii) girls began to have greater increases in growth (height) and surpassed boys at 8.5 years of age (first point of intersection); (iii) as boys began to enter the growth spurt, the height growth velocity accelerated, while PB duration and PHV were higher than those of girls, causing the height of boys to exceed that of girls at 13.5 years of age (second point of intersection), and (iv) after that, the height gap between boys and girls continued to widen until age 18 (boys are +10.8cm taller than girls).
The APVH findings (12.9 years in boys and 10.5 years in girls) are in agreement with those reported by Marín et al. 33 in a study conducted in 156 boys and 152 girls aged 8, 12, 14 and 17 years in the Aburrá Valley (Colombia), where it was found that the greatest increase in height occurred between the ages of 8 and 12 in girls and 8 and 14 in boys. Furthermore, in the present study, APHV occurred 2 and 2.9 years after AMHV in girls and boys, respectively, which is consistent with reports by the CDC13 (2.3 years in girls and 2.9 years in boys) and WHO14,15 (3 years in girls and 3.4 years in boys) (Table 4).
Table 4 Growth velocity parameters from the Centers for Disease Control and Prevention and the World Health Organization and from the present study (children and adolescents from Huila, Colombia).
| Parameters | Boys | Girls | ||||
|---|---|---|---|---|---|---|
| Huila | CDC | WHO | Huila | CDC | WHO | |
| AMHV (years) | 10.0 | 10.4 | 9.7 | 8.5 | 9.3 | 8.0 |
| APHV (years) | 12.9 | 13.3 | 13.1 | 10.5 | 11.6 | 11.0 |
| AMHVR (years) | 15.1 | 15.0 | 14.8 | 12.6 | 12.9 | 12.2 |
CDC: Centers for Disease Control and Prevention; WHO: World Health Organization; AMHV: age at minimal pre-spurt height velocity; APHV: age at peak height velocity; AMHVR: age at minimal pre-spurt height velocity return.
Source: Elaborated based on Kuczmarski et al., 13 de Onis et al., 14 and WHO Multicentre Growth Reference Study Group. 15
In relation to what has been described in international studies, the APHV of children in Huila (12.9 years) is found to be: (i) between 0.8 and 1.4 years below that reported for this population in the United States (13.8 and 13.70 years), 34,35 Canada (13.9 years), 36 India (14.3 years), 37 Switzerland (13.9 years), 38 England (14.12 and 13.91 years), 39,40 and Brazil (13.9 years); 41 (ii) between 0.1 and 0.5 years below that reported in Canadian (13.4 years), 42,43 Brazilian (13.4 years), 36 Portuguese (13.0 and 13.4 years), 43,44 and Japanese (13.0 years) children; 45 and (iii) between 0.4 and 0.7 years above that reported in Brazilian (12.5 years) 46 and Japanese (12.2 years) children. 47
In the case of girls, APVH (10.5 years) is found to be: (i) between 1.5 and 2.0 years below that reported for this population in the United States (12.5 years), 34 India (12.4 years), 37 Switzerland (12.2 years), 48 and England (11.99 years); 39 (ii) between 0.7 and 1.4 years below that reported for girls in England (12 years), 40 Canada (11.8 and 11.7 years), 42,43 United States (11.6 years), 35 Japan (11.2 years), 45 Brazil (11.6 years), 41 and Poland (11.9 years); 9 (iii) 0.2 years above that of Japanese girls (10.3 years); 47 and (iv) similar to that reported for Brazilian girls (10.5 years). 46
Furthermore, PHV was 7.1cm/year in boys and 6.6cm/year in girls. Even though this value for children is consistent with that found in international studies where a PHV between 7.3cm/year and 10.4cm/year is reported (i.e., 7.3cm/year in Japan, 41 8.17cm/year in Portugal, 36 8.49cm/year in Brazil, 36 9.92cm/year in Canada, 36 9.79cm/year in England, 39 and 10.4cm/year in Canada42, it is lower in girls, as the values reported for this population worldwide vary between 7.1cm/year and 9.0cm/year (i.e., 8.1cm/year in England, 40 8.6cm/year in Canada, 42 and 9.02cm/year in Japan). 47
Considering the foregoing, it can be stated that the APHV and PHV of children and adolescents in Huila are lower (earlier maturation) than the APHV and PHV described in most of the previously mentioned international studies. Reasons that may account (directly or indirectly) for variability in height growth and pubertal maturation include: sex, genetics, nutrition, endocrine regulation, physical activity, and ethnicity; 49 urbanization of area of residence, health networks, and access to primary health care, 50,51 and/or secular trend. 52 Thus, the study of the variables listed above and the regular review of the growth charts are relevant contributions to improve the understanding of the variation in child development. 49
The main strengths of the present study are: (i) the large sample size; (ii) the use of the LMS method, which allows to create growth curves for height with normalized data by adjusting the skewness of the data that could be involved in the height variable (since the variation in HV is not constant as age and pubertal status change), and (iii) being the first and largest study that shows the height growth patterns during puberty for boys, girls, and adolescents in Huila. However, this study has some weaknesses, namely that only cross-sectional growth data were included due to its design and that etiological factors were not considered in the analysis (e.g., altitude of the region, or ethnic and racial populations).
Accordingly, and given that knowledge of the biological parameters of height growth during puberty allows us to understand the variation in child development (with an impact on health, education, sports practice, among other areas, in this population), we propose to conduct a large-scale longitudinal study to confirm these findings and study the (complex) effect of etiological factors.
Conclusion
The following are the findings of the present study: (i) AMHV, AMHVR and APHV occurred earlier in girls than in boys; (ii) there is a marked difference in height growth patterns between sexes; and (iii) APHV occurred relatively early (in both sexes) compared to the reference values reported by the CDC and WHO. Finally, the reference values established here may be useful for assessing height growth patterns during puberty in this population.

