


 English (pdf)
 Article in xml format
 Article references
 Send this article by e-mail
 Cited by SciELO
  Cited by Google
  Similars in
SciELO
Similars in
SciELO  Similars in Google
 Permalink
INTRODUCTION
Humanity has been using the Cannabis (marijuana) plant for various purposes since 7000 BC, based on cannabis tissues recovered from China. It is also well known for its ancestral use as a mood-altering and medicinal agent. Indeed, an important amount of marijuana was found in the tomb of a shaman in Central Asia, dating back 2700 years (Armentano, 2015). The plants in traditional medicine are also recognized due to their analgesic, relaxing, antidepressant, hypnotic, immunosuppressive, anti-inflammatory, anxiolytic, and bronchodilator properties (López et al., 2014).
Medical applications of cannabis have increased considerably, as it is used to treat diseases such as multiple sclerosis, Alzheimer’s, glaucoma, depression, chronic neuropathic pain, and pain associated with rheumatoid arthritis (Parmar et al., 2016). In addition, cannabis reduces the side effects caused by chemotherapy in cancer patients and therapy in patients with HIV/AIDS disease, such as weight loss, nausea, and vomiting (Gallo-Molina et al., 2019). For this reason, the medical properties of Cannabis have become of great interest in the scientific field (Velázquez et al., 2017). The Cannabis plant has various components, including (i) ∆9-tetrahydrocannabinol (∆9-THC or THC), known for its high psychoactive capacity; (ii) ∆8-tetrahidrocannabinol (∆8-THC), present in smaller amounts and having weaker effects; and (iii) cannabidiol (CBD), which practically lacks psychoactive properties but has been the focus of several studies due to its medicinal properties, such as in cases of anxiety and panic associated with excess consumption of THC and cannabinol (CBN), whose properties could be associated with immunomodulation capacity (González et al., 2002, Olivas-Aguirre et al., 2024). Other reported properties of cannabinoids are analgesic and anticonvulsant effects (Vučković et al., 2018) and improvements in sleep quality, management of anxiety, and post-traumatic stress disorder (Rubiano, 2019).
In the context of new worldwide provisions and regulations for the legalization of Cannabis for therapeutic and medicinal purposes, the need to implement analytical methods for the characterization of samples and extracts has increased. However, cannabis medicinal products, such as oils and extracts, as well as their different commercial presentations, are marketed in some regions without being subjected to quality control procedures and, in many cases, do not correspond to the properties that they claim to have. Quality control is essential in treatments that require the use of hemp with a low ∆9-THC content for recreational use in patients under addiction treatment and consumers (Zivovinovic et al., 2018), as well as for the medicinal and therapeutic properties widely described for this species.
The development of pharmacopeias has increased in recent years (Zivovinovic et al., 2018; Pavlovic et al., 2018). In 2020, the AOAC published the LC-DAD AOAC 2018.11 method to analyze cannabinoids in plant material, extracts, and oils from Cannabis sativa of the hemp variety (AOAC, 2020). Cannabinoids have been examined and quantified mainly by two analytical techniques: gas chromatography (GC) with a flame ionization detector or mass selective detector system (MSD) and high-efficiency liquid chromatography. These two techniques are used according to regulations, type of analysis (forensic analysis, analysis with medicinal purposes, indicators of species origin), and target cannabinoid compounds (UNODC, 2022). Depending on the purpose, cannabinoid analysis by gas chromatography can be performed with or without derivatization. For total THC, which is the result of the content of free THC and tetrahydrocannabinolic acid (THCA), GC is used with an FID flame ionization detector. Determination and quantification of total THC are important in the medicinal and legal fields since they facilitate the determination of Cannabis compounds. The use of GC coupled to mass spectrometry (MS) is employed for confirmation of cannabinoids in Cannabis samples. Furthermore, MS detection is necessary for identifying other compounds in samples, such as terpenoids, and for quality control of plant material concerning the analysis of residual pesticides (UNODC, 2022; Aizpurua-Olaizola et al., 2014). On the other hand, High-Performance Liquid Chromatography (HPLC) is widely used for cannabinoid analysis due to its versatility and efficiency in terms of analysis time. The use of this technique requires adequate performance in all stages of sample analysis, including preparation, storage, extract stability, and development of chromatographic conditions (Zivovinovic et al., 2018). The Reverse-phase HPLC is the most used chromatographic method for the analysis of cannabinoids due to its efficiency, selectivity, and resolution in the separation of THC, THCA, CBD, and CBN. Although C18 and C8 stationary phases with 150 - 250 mm lengths are the most used, Ultra High-Performance Liquid Chromatography (UHPLC) methods have been recently developed using short columns with small particle sizes (Patel et al., 2017). Variable wavelength ultraviolet (UV) detectors or diode array detectors (DAD) at wavelengths between 220 and 270 nm are used for identification and quantification (UNODC, 2022; Ruppel & Kuffel, 2016). As with the GC technique, LC-MS coupling systems have been developed in recent years, providing methodologies with high sensitivity for chemical analyses applied to medicinal, toxicological, and forensic studies (Aizpurua-Olaizola et al., 2014).
Considering that most commercial cannabis products do not meet the characteristics of medicinal products in terms of their cannabinoid percentage (potency), that the most common products are plant flowers and different types of oil or extracts, and that usually the traditional methods use buffer as a mobile phase-resulting in delayed and expensive analyses-this study aimed to develop and validate an HPLC-DAD analysis method for the identification and quantification of cannabinoids. The proposed method employs a C18 analytical column with particle size compatible with modular HPLC systems (dp ≥3.0 μm) and does not require a buffer as mobile phase., It allows for the identification and quantification of CBN, CBD, and Δ9-THC cannabinoids in vegetable samples as well as in commercial oil or extract products intended for medicinal and health care purposes.
MATERIAL AND METHODS
Regents and materials
Δ9-THC, CBD, and CBN standards were purchased from Restek (Bellefonte, USA). HPLC-grade acetonitrile, methanol, ethanol, and isopropanol were purchased from Fisher Sci (NJ, USA). The Arium Sartorius System (Goettingen, Germany) was used to generate ultrapure water. Oil samples of medicinal cannabis products were obtained at local stores that sell phytotherapeutic products. Cannabis sativa tipo cañamo (hemp) samples were purchased from La Finca Interactiva Arachna - Med SAS (Cali-Colombia) Company, which obtained license (Resolution number 060 from the Protection and Social Security Ministry of Colombia) to grow and manufacture cannabis derivatives for research purposes.
Chromatographic analysis
HPLC analysis. Different flow and mobile phase composition tests using a C18 reverse phase column were carried out to find the most suitable separation, resolution, and symmetry conditions. The analysis method proposed by the United Nations (UNODC, 2022) was used as a reference, with some modifications. The analyses were carried out using Waters Breeze HPLC high-efficiency liquid chromatography equipment (Milford, USA). It has a Waters 1525 binary pump, a PDA 2998 diode photo-array detection system, a Rheodyne 7525i manual injector, and a column oven for the Waters CHM column. Analyses were performed on an X-Terra C18 analytical column (250 mm x 4.6 mm, 5.0 µm, Waters Corp, USA). Separation of cannabinoids was achieved by applying a gradient elution, using ultrapure water (A) and acetonitrile (B) as mobile phases. The initial gradient was 80% B; 15 min, 90% B; 20 min, 80 % B. The injection volume was 20 µL, and the column temperature was kept at 30°C at a mobile phase flow rate of 1.0 mL/min. A 230 nm wavelength was used for detection. Finally, Empower II software (Waters Corp, Milford, USA) was used for data acquisition and processing.
Development and validation of the chromatographic method for the analysis of cannabinoids. A 100 mg/L working solution of Δ9-THC, CBD, and CBN cannabinoid mix in HPLC-grade methanol was prepared from the high-purity cannabinoid standard solution. This working solution was then used to prepare standard solutions at concentrations ranging from 0.1 to 75 mg/L, which were employed to determine the chromatographic conditions and calibrate the method for quantification across the linear range. A series of five intra-day and inter-day measurements of a 10 mg/L cannabinoid standard mix was carried out under the established operational conditions to determine the precision in terms of repeatability and reproducibility. Precision was calculated in terms of the relative standard deviation (%RSD). Accuracy was expressed in terms of % recovery through matrix enrichment at a high concentration level (20 mg/L). Accuracy experiments were carried out in triplicate. Detection and quantification limits were determined by calculating the S/N ratio of a low-concentration (0.1 mg/L) cannabinoid solution.
Sample preparation. 0.5 mL of commercial cannabis oil samples were dissolved in 5.0 mL of an isopropanol: acetonitrile solvent mixture in an 8:2 ratio. Samples were sonicated for 5 minutes in a Fisher FS20H ultrasound device (NJ, USA) and centrifuged at 5000 rpm for 5 minutes. 2 mL of supernatant was taken and diluted to 10 mL with acetonitrile. Samples were filtered through 0.45 µm syringe filters (GHP, Pall Corporation, USA) and were kept at 4°C until HPLC-DAD analysis. The extraction of plant samples was carried out through ultrasound-assisted extraction, according to Florian et al. (2009), with some modifications. 0.2g of dry samples were weighed with the addition of 2.0 mL of absolute ethanol. Then, the samples were sonicated for 7 min at room temperature, and the extracts were filtered and brought to a 5.0 mL volume with ethanol. Finally, the extracts were filtered and kept at 4°C as described above.
RESULTS AND DISCUSSION
Chromatographic analysis. The analyzed cannabinoids were separated in less than 10 min, whereas the total analysis time was 20 min. Peak separation was adequate, presenting resolution values greater than 1.5. Regarding symmetry, values between 1.04 and 1.2 showed symmetrical and Gaussian peaks, ensuring an adequate analysis of these compounds under the established operational conditions. Figure 1 shows the chromatogram at 230 nm of the standard mixture under the operational conditions described above. Table 1 presents the determined chromatographic parameters.
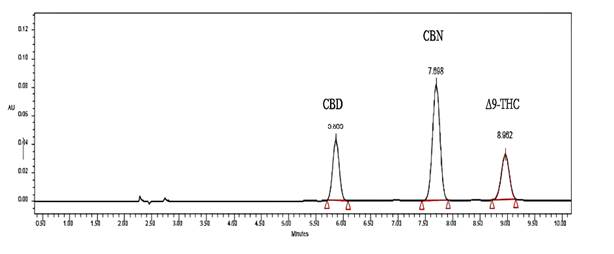
Table 1 Chromatographic parameters of the HPLC-DAD method
| Cannabinoids | Rt (min) | Capacity Factor k | Selectivity Factor σ | Symmetry (5%) | Resolution Rs |
|---|---|---|---|---|---|
| Cannabinoids | |||||
| CBD | 5.86 | 2.90 | 1.42 | 1.10 | |
| CBN | 7.70 | 4.13 | 1.20 | 1.00 | 4.23 |
| Δ9-THC | 8.96 | 5.00 | 1.20 | 2.76 |
Development and validation of the chromatographic method for the analysis of cannabinoids. The recorded values for the retention times and chromatography were adequate. Relative standard deviation values are lower than 5%, which is acceptable according to both the analytical standards contained in the ICH Harmonised Tripartite Guideline (2005) and previous reports by Vaclavik et al. (2019). About the detection and quantification limits, values of 0.5-2.0 µg/L for CBD and Δ9-THC and 0.2-1.0 µg/L for CBN were observed, which indicates the achievement of a sensitive method for the determination of these compounds in the study matrices. The recovery percentage for the samples ranged from 89% to 94%, which was acceptable considering the complexity of the study matrix. Indeed, Saingam & Sakunpak (2018) obtained 96-99% values in products for medicinal use derived from cannabis. The values of the analytical figures of merit in the validation are summarized in Table 2.
Table 2 Validation parameters of the HPLC-DAD method
| Cannabinoids | Precision (RSD%) | Accuracya | LOD µg/L | LOQ µg/L | Linearity R2 | |
|---|---|---|---|---|---|---|
| Intraday n=5 | Interday n=15 | |||||
| CBD | 2.30 | 4.40 | 93.40 | 0.50 | 2.00 | 0.998 |
| CBN | 1.90 | 4.34 | 89.60 | 0.20 | 1.00 | 0.998 |
| Δ9-THC | 2.20 | 3.93 | 94.00 | 0.50 | 2.00 | 0.999 |
a Percentage recovery; Instrumental LOD and LOQ (LOD S/N=3) (LOQ S/N=10)
Extraction of cannabinoids from commercial samples. The extraction and solubilization of the commercial cannabis oil samples were carried out using small amounts of samples and solvents, eliminating the use of halogenated organic solvents, which favor the generation of organic solvent residues. Samples in 100% acetonitrile or ethanol showed solubility problems due to the formation of emulsions. This phenomenon could arise from the nature of the matrix as well as the quality of the oils used as raw material for the production of these commercial extracts, since it is common to use paraffin or mineral oils instead of using oils of vegetable origin, such as olive or sunflower oil. The choice of extraction solvents was based on preliminary work (Citti et al., 2019; Madej et al., 2020; Layton & Reuter., 2017). Furthermore, the extraction of Cannabis sativa leaves used an ultrasound-assisted method with ethanol as a solvent, which is classified as a "green" solvent, guaranteeing an efficient and environmentally friendly extraction protocol.
Analysis of cannabinoids in commercial samples. The content of Δ9-THC was the highest among all the commercial samples analyzed. Table 3 shows the CBD, CBN, and Δ9-THC content in those samples. Three (A, B, and E) out of the five samples displayed >1% Δ9-THC concentrations (% w/w), which is why they are considered psychoactive according to Colombian legislation. The percentage of CBD in the samples was either low or absent. It is important to highlight that CBD compensates to some extent for the harmful effects of THC (Niesink & Van Laar, 2013; Santos-Álvarez et al., 2021). Regarding the CBN content, samples A and B showed the highest concentration of this cannabinoid, with a CBN/THC ratio of 0.25 and 0.12, respectively. Since CBN is a degradation product of THC, the relationship between these two cannabinoids indicates the degree of freshness and the storage conditions of the Cannabis resins and products. CBN/THC ratio values between 0.04 and 0.08 indicate that the products are 1-2 years old (UNODC, 2022). Figure 2 depicts the chromatogram of the analyzed samples.
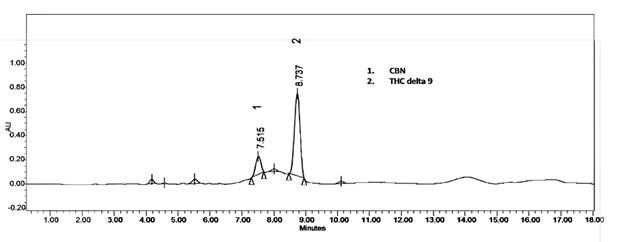
Table 3 CBD, CBN, and Δ9-THC content in commercial samples
| Sample | Quantification in oil (mg/mL) (a) | ||
|---|---|---|---|
| CBD | CBN | Δ9-THC | |
| A | ND | 10.51 (3.5) | 42.55 (3.0) |
| B | 3.20 (3.0) | 4.15 (5.0) | 33.10 (5.0) |
| C | ND | 0.30 (5.0) | 3.70 (3.0) |
| D | ND | 0.20 (2.0) | 2.60 (0.3) |
| E | 4.30 (5.0) | 0.25 (3.0) | 17.40 (2.0) |
ND= not detected. (a) n=3 (RSD% value of concentration)
Analysis of cannabinoids in vegetable samples. The plant material analyzed was representative of Cannabis sativa chemotype with a high CBD content, corresponding to a 0.8% weight percentage (% w/w). Furthermore, the Δ9-THC percentage was lower (0.59% w/w) with a THC/CBD ratio of 0.74 (Brighenti et al., 2017; Bolchi et al., 2021). Since the plant material has a higher content of CBD and a THC w/w percentage lower than 1%, it can be classified as non-psychoactive (Minsalud, 2017). The CBD concentration of Cannabis sativa has medicinal applications due to its relaxing, analgesic (Karanian & Bahr, 2006; Rubiano, 2019), anti-inflammatory, and antiepileptic properties (Brighenti et al., 2017). Additionally, Cannabis sativa is valuable in the treatment of central nervous system disorders such as Alzheimer’s and anxiety disorders (Attard et al., 2018; Teräsvalli, 2020). Unlike THC, CBD is not considered a controlled substance. Table 4 shows the values registered in the samples from leaves of Cannabis sativa hemp-type.
CONCLUSIONS
Results of the development and validation method for the analysis of cannabinoids (CBD, CBN, and Δ9-THC) through HPLC-DAD were satisfactory, meeting the analytical requirements in terms of precision with RSD percentage less than 5%, accuracy in terms of recovery higher than 90%, and adequate sensitivity for cannabinoid analysis for Cannabis research and quality control processes for medicinal and health products marketed, which, in many cases, do not meet the guidelines established by the Colombian Health Ministry, mainly about the concentration of CBD and THC. The analyzed oil samples showed a high ∆9-THC content, with values that ranged between 2.6 and 42.55 mg/mL, which is higher than 1.0% w/w in most samples. Regarding CBD, samples had lower content than THC, with values between 3.2 and 4.3 mg/mL; in some samples, it was not detected. The analysis determined that the vegetable material analyzed can be classified as non-psychoactive (∆9-THC ≤ 1%). Likewise, the concentration of CBD was higher than that of THC, complying with the regulations of the Health Ministry with the use of this type of raw material in the preparation of phytotherapeutics.

