




 English (pdf)
 Article in xml format
 Article references
 Automatic translation
 Send this article by e-mail
 Cited by SciELO
  Cited by Google
  Similars in
SciELO
Similars in
SciELO  Similars in Google
 Permalink

INTRODUCTION
The European pear (Pyrus communis L.) cv. Triumph of Vienna is cultivated in the tropical regions at altitudes between 1,800 and 2,800 m above sea level (Fischer et al., 2022). Pear fruits are healthy and confer benefits with regular consumption (Molina-Ochoa et al., 2015). In Colombia, the cultivated area has increased in recent years, from 1,229 to 1,601 ha between 2018 and 2022 (Agronet, 2024), for both fresh consumption and processing. This trend also highlights the importance of the country's production of deciduous fruit crops (Gutiérrez-Villamil et al., 2022).
The reduction in water resources is a major concern in agriculture, as it strongly affects the overall performance of fruit trees, including pear trees. One alternative to address this problem is regulated irrigation (Devin et al., 2023; Babaei et al., 2025). Regulated deficit irrigation (RDI) is an important technique for efficient use of irrigation, in which water is supplied in smaller amounts during certain development stages of the crop (non-critical periods), and applied at the necessary amount during the rest of the phenological cycle (critical periods) (Martínez-Nicolás et al., 2019; Blanco, Torres-Sánchez et al., 2019). RDI can help manage vegetative growth, improve fruit quality, reduce physiological disorders, and enhance water-use efficiency, as reported in various pear cultivars (Blanco et al., 2025). In pear trees of the cv ‘Triumph of Vienna’, the main variety cultivated in Colombia, the RDI has improved water-use efficiency, with a significant effect on fruit production and quality at harvest in two production cycles (Vélez-Sánchez et al., 2021; Vélez-Sánches et al., 2022). It has even been reported that the RDI increased total soluble solids and organic acids (Díaz-Abril et al., 2016), without affecting volatile organic compounds (Vélez et al., 2019). However, there is limited information regarding its impact on postharvest behavior.
During the cultivation cycle of the pear tree in the Colombian tropics, rainfall is relatively high, except in January and February when pear fruits grow rapidly. That is to say, the rapid growth phase of pears in Colombia has the highest water demand, and several researchers have indicated that this phenological phase is critical from a productive point of view (Marsal et al., 2012; Galindo et al., 2018).
Therefore, this study aimed to evaluate the effects of reducing irrigation regimes during the rapid growth phase of the European pear (Pyrus communis L.), cv. Triumph of Vienna in the Colombian tropics and the effect of slight water stress on postharvest quality.
MATERIALS AND METHODS
Experimental site and plant material
This experiment was conducted during the 2013-2014 and 2014-2015 growing seasons of the European pear cv. Triumph of Vienna, on a farm in Sesquilé, Cundinamarca, with a clay-loam soil, which has an assimilable moisture retention capacity of 120 mm m-1 and an apparent density of 1.06 g cm-3. Likewise, the moisture content at field capacity and the permanent wilting point is 27% and 15%, respectively; the pH is 4.6, with a potassium content of 78.2 ppm and phosphorus of 23.9 ppm, organic matter of 5.06%, and electrical conductivity of the soil and irrigation water of 1.7 and 2.0 dS m-1. The trees of the Triumph of Vienna pear variety were planted in 1998 at a spacing of 4 m × 4 m. They were planted on a rootstock of the same material, drip-irrigated with six drippers with a flow rate of 8 L per plant, and had a shaded area of 44%. Edaphic fertilization was carried out twice a year, via irrigation system every fifteen days, from September to May. The total amount applied was 60, 44, and 100 kg ha-1 in 2014 and 63, 60, and 100 kg ha-1 in 2015 of N, P2O5, and K2O, respectively.
Climatic Conditions and Water Requirements
Climatic data were recorded with a WS-GP1 portable station (ΔT devices, Cambridge, UK), positioned in the vicinity of the experimental plot. The mean temperature of the daily maximums was 21 and 16 °C in 2014 and 2015, respectively. The mean temperature of the daily minimums was 8 and 10 °C in 2014 and 2015, respectively. The mean daily temperatures were similar in both years (13 °C). The total precipitation (Pt) from November 2013 to April 2014 was 465.4mm, concentrated in November 2013 and February, March, and April 2014, and the Pt from September 2014 to March 2015 was 233.44 mm, concentrated in September and October 2014 and March 2015.
Irrigation Treatments and Experimental Design
The reference crop evapotranspiration (ETo), obtained using the Penman-Monteith method (Maskey, 2022), was 2.09- and 2.03-mm d-1 during the period between flowering and harvest, spanning 169 days in 2014 and 161 days in 2015. The crop evapotranspiration (ETc) was estimated as ETc = ETo x Kc, with Kc being the crop coefficient for each phenological stage.
During the experiment, 3 irrigation treatments were applied with 4 replicates each (12 plots, each with 16 or 20 trees), arranged in a randomized block design.
The irrigation period ranged from day 41 to 99 after flowering (59 days) in the 2013-2014 season and from day 53 to 114 (62 days) in the 2014-2015 season. The control (T0) trees were watered to meet the crop's water requirements. The T1 treatment trees were watered at 100% ETc, except during the period of rapid fruit growth, which had 74% ETc in 2013-2014 and 48% ETc in 2014-2015. During the same phenological phase, the T2 treatment trees were watered at 60 and 27% ETc in 2013-2014 and 2014-2015, respectively. These humidity levels in the treatments were selected from the results obtained by Molina-Ochoa et al. (2015), who tested treatments with RDIs of 67% and 55% of ETc in 2011 and 2012, with only a 12% difference in humidity, which may explain the lack of significant differences. During the irrigation period, trees in treatment T0 received 67.6 mm (2013-2014) and 48.3 mm (2014-2015), treatment T1 received 49.8 mm (2013-2014) and 23.3 mm (2014-2015), and treatment T2 received 40.9 mm (2013-2014) and 13.1 mm (2014-2015).
From the fruits collected in each season of each treatment and replication, 20 were randomly selected and kept at a temperature of 1 °C and 90% relative humidity. The storage ended after 49 days for the fruits evaluated in 2014 and 59 days for those in 2015.
Fruit measurements
From the fruits collected in each season of each of the treatments and replication, 20 were randomly selected and stored at a temperature of 1 °C and 90% relative humidity, according to Rizzolo et al. (2015) for pear fruits. The evolution of the pear quality in each treatment during the postharvest storage was periodically determined by the following variables:
For each treatment, the postharvest duration of the fruits was determined, expressed in days after harvest (dah).
The fruits' weight loss (%) was determined using a precision electronic scale (Mettler Toledo, PB3001, Shanghai, China).
The soluble solids content (SS) was measured with a digital refractometer (Krüss Optronic, DR201-95, Germany). The titratable acidity (TA) was measured using a Titroline 6000 device (SI Analytics, Germany) with an alkaline solution in a 5 mL juice sample containing 2 to 3 drops of phenolphthalein. The TA expressed as % of malic acid.
The pulp firmness was measured at two opposite points on the equatorial zone of the fruit using a texturometer with a 6 mm diameter probe (METEK LS1 LLOYD). The total carotenoid content was determined using the procedure described by Vélez-Sánchez et al. (2021). Extracts were measured at 645 nm, using 80% acetone as the blank.
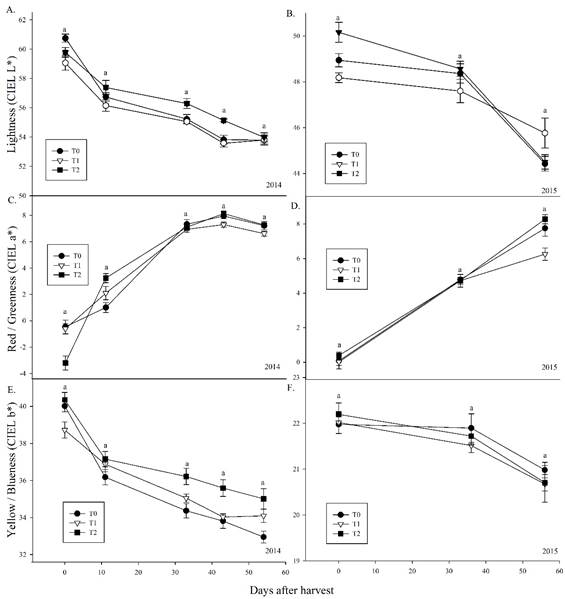
Fruit epidermis color was measured by reflection using a Chromameter CR400 device (Konica Minolta, Tokyo, Japan) on three points of the epidermis in the fruit's equatorial zone, according to the CIELab color space system (L*, a*, and b*).
Fruit respiration (mg CO2 kg-1 h-1) was measured using a CO₂ sensor (Vernier, Software & Technology, Beaverton, Oregon, USA) and LabQuest software. Measurements were recorded every 5 s for 900 s using two fruits per sample. The software calculates the respiration rate based on CO₂ emission per unit of weight and time.
Statistical analysis
The information was analyzed using the SAS/STAT program (SAS Institute Inc., 2004). An analysis of variance (ANOVA) was carried out between irrigation levels each year. The irrigation treatments were compared using a post hoc Tukey test (p < 0.05).
RESULTS
Weight loss
In 2014 and 2015, the irrigation treatments showed statistically significant differences in weight loss, with a clear tendency towards a progressive increase postharvest. In 2014, the greatest weight loss was observed in fruits with 60% ETc (T2); fruits with 100% and 74% ETc (T1) did not differ statistically (Figure 1A). In 2015, 27% of ETc (T2) generated the least weight loss in the fruits (Figure 1B).
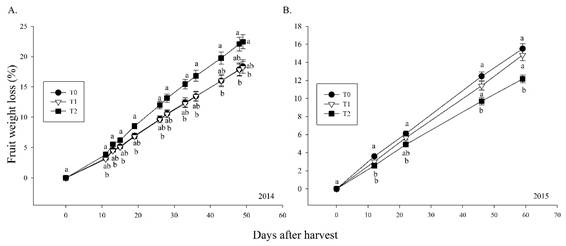
Note. Treatments followed by the same letter for each sampling point were not different according to the Tukey test (p < 0.05). Vertical bars indicate standard error (n=4). For 2014, T0, Control- 100% ETc; T1- 74% of ETc, and T3- 60% of ETc. For 2015, T0, Control- 100% of ETc; T1- 48% of ETc, and T2- 27% of ETc.
Figure 1 Effect of regulated deficit irrigation on postharvest weight loss of pear fruit during the 2014 (A) and 2015 (B) seasons.
Firmness
Pears in the three irrigation treatments showed a clear decrease in firmness during postharvest storage in 2014 and 2015, with no statistically significant differences among irrigation levels. However, during the first 11 days of 2014, there was a slight increase (Figure 2A). In this study, pear fruits showed similar dry matter contents across different irrigation levels, as previously observed for a harvest cycle in the cv. Triumph of Vienna (Vélez-Sánchez et al., 2021). The decrease in pulp firmness begins even before fruit harvest. Firmness stabilization was observed during a distinct period in the first days of storage in 2014 (10 days), which was longer in 2015 (30 days) (Figure 2B). This difference was observed across all treatments and was attributed to the fact that, in 2015, all fruits had higher firmness at the beginning of postharvest storage than the fruits of the previous year.
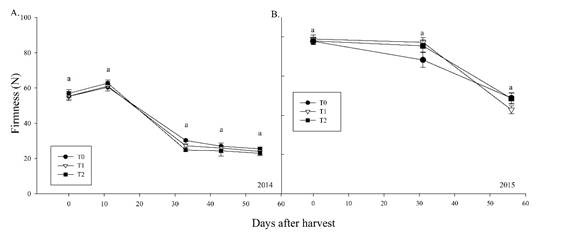
Note: Treatments followed by the same letter for each sampling point were not different according to the Tukey test (p < 0.05). Vertical bars indicate standard error (n=4). For 2014, T0, Control- 100% ETc; T1- 74% of ETc, and T3- 60% of ETc. For 2015, T0, Control- 100% of ETc; T1- 48% of ETc, and T2- 27% of ETc.
Figure 2 Effect of regulated deficit irrigation on postharvest firmness of pear fruit, during the 2014 (A) and 2015 (B) seasons.
Soluble solids (SS)
In all treatments, the SS content showed a clear tendency to increase with storage time (Figures 3A and 3B). In the 2014 season, there were no statistical differences between treatments, but the SS values in fruits with 48% ETc (T1) tended to be higher during the 2015 evaluation, with statistical differences at 33 days after harvest. The values found are slightly lower than those reported by Rizzolo et al. (2015), who reported that the SS of pear fruits averages 13.6±0.26%.
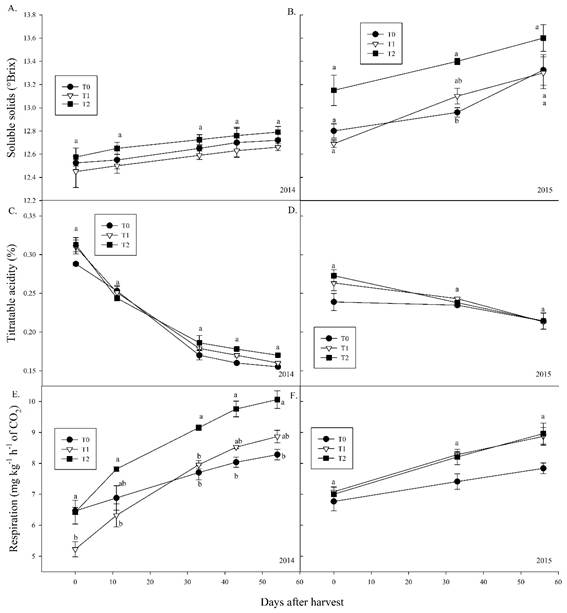
Note. Soluble solids (A and B), total titratable acidity (C and D), and respiration rate (E and F) for each year, respectively. *Treatments followed by the same letter for each sampling point were not different according to the Tukey test (p < 0.05). Vertical bars indicate standard error (n=4). For 2014, T0, Control- 100% ETc; T1- 74% of ETc, and T3- 60% of ETc. For 2015, T0, Control- 100% of ETc; T1- 48% of ETc, and T2- 27% of ETc.
Figure 3 Effect of regulated deficit irrigation on postharvest behavior of pear fruit during the 2014 and 2015 seasons.
Titratable Acidity (TA)
There was a clear decrease in TA levels during storage in all irrigation treatments. In the 2015 season, no statistical differences were observed, but differences were noted in 2014, when the highest acidity at the end of storage was observed in fruits with 60% ETc (T2) (Figure 3C and D).
Respiratory rate (RR)
The respiration values in 2014 and 2015 at harvest had some differences during postharvest. Specifically, in 2014, the pears with 60% of ETc (T2) had higher RR values. In 2015, the irrigation treatments did not differ statistically (Figures 3E and 3F).
Total Carotenoids
The ripening process of pears during postharvest conservation did not show marked differences in carotenoid content among the treatments. However, a tendency to increase fruit contents was observed in the most deficient treatment (T2) (Figure 4).
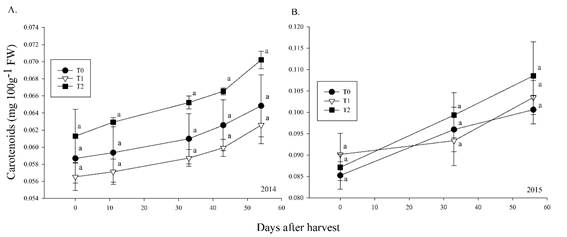
Note: Treatments followed by the same letter for each sampling point were not different according to the Tukey test (p < 0.05). Vertical bars indicate standard error (n=4). For 2014, T0, Control- 100% ETc; T1- 74% of ETc, and T3- 60% of ETc. For 2015, T0, Control- 100% of ETc; T1- 48% of ETc, and T2- 27% of ETc.
Figure 4 Effect of regulated deficit irrigation on total carotenoids of pear fruit during postharvest in 2014 (A) and 2015 (B) seasons.
Color
The color parameters of the CIEL*a*b* system (Figure 5) were not significantly affected by the irrigation levels. During storage, a reduction in greenish color was observed in pears, in favor of the evolution of more reddish tones (increases in a* and C*), less yellowish tones (decreases in b*), and darker tones (decreases in L*). This behavior is well known because luminosity and pigment content are inversely related: as pigment content increases, more light is absorbed, and luminosity decreases (L*) (Fialho et al., 2021).
DISCUSSION
Weight Loss
The change in the rate of weight loss observed in this study could have been due to a decrease in the skin thickness and/or changes in its properties that promote greater water loss through transpiration, without fruit deterioration in any of the treatments, as reported in fruit crops with water stress (Collado-González et al., 2013). Similarly, Lopezet al. (2011) mentioned that the difference in weight loss between water-deficient and well-watered plants could be due to differences in the structure and/or composition of the epidermis or epicuticular waxes.
Firmness
Regarding firmness, Lu (2022) found that water deficit resulted in lower postharvest firmness loss in apples due to higher dry matter content. The absence of differences in values among the irrigation treatments led to the conclusion that water savings were achieved without affecting this quality parameter, indicating that irrigation can be reduced under similar conditions. The decrease in pulp firmness is largely due, according to Álvarez-Herrera et al. (2022), to the action of hydrolytic enzymes that degrade starch and to the conversion of protopectins and pectins into other water-soluble compounds. In contrast to the results obtained in this study, previous reports indicate that fruits subjected to water stress tend to have lower water content and, consequently, higher firmness (Wu et al., 2013), as observed in pear fruits cv. Conference under water deficit followed by storage at 0 °C and 90% relative humidity (Lopez et al., 2011). Conversely, fruits with a water deficit experience a clear acceleration of ripening, with a notable decrease in firmness.
Soluble Solids (SS)
For soluble solids, it is known that a water deficit favors an increase in the SS of fruits (Vélez-Sánchez et al., 2021; Rodríguez et al., 2018). In the pear fruit cv ‘conference’, the RDI strategy supplied during ripening generated the highest SS at harvest (14.2 °Brix) compared with the control (13.9 °Brix), which is attributed to the fact that as water stress increases, the fruit may present partial dehydration, which increases the concentration of SS (Lopez et al., 2011). At first glance, there may appear to be a concentration effect resulting from a decrease in fruit moisture at 27% ETc (T2), which may be related to a lower osmotic potential, as reported by Volschenk (2020). However, the fact that the weight losses were very similar across treatments (Figure 1) reduces the possibility that this factor was a determinant for the observed behavior. On the other hand, the transformation of organic acids into sugars has been reported as a possible cause (Rodríguez et al., 2018; Silveira et al., 2020), possibly via gluconeogenesis.
Titratable Acidity (TA)
Concerning total acidity, the rise observed in 2014 may be attributed to the increase in organic acid metabolism due to water stress, and to the osmotic adjustment mechanism that also increases SS, and is related to fruit flavor that implies greater acceptance by the consumers, as reported for peach fruit (Conesaet al., 2021). Similar results in TA were reported by Lopez et al. (2011) in the pear cv. Conference. For apples Ambrosia™, the water deficit caused minor degradation and maintained the highest acidity (Lu, 2022). According to Volschenk (2020), water deficits cannot affect or increase acidity. In grapes cv. Chardonnay, to increase berry acidity, full irrigation is recommended (Prats-Llinàs et al., 2019).
Respiration Rate (RR)
For respiratory rate, it is known that fruits have internal regulation mechanisms that maintain a constant or adjusted RR in response to changes in water supply, and that for the respiratory rate of the fruits to be affected, the water stress must be severe (Seleiman et al., 2021). The deficit affected the RR of the fruits in storage in specific cases, resulting in higher values. This is typical behavior in climacteric fruits that produce a greater number of characteristic compounds with intense aromas during ripening (Vélez et al., 2019), coinciding with high ethylene production and high respiration rate, which produce several changes due to degradation that occurs in cell walls, along with pigmentation and thickening of the epidermis that becomes permeable. The higher sugar content in the deficit treatments could have been due to a lower water supply or an osmotic adjustment induced as a response mechanism to stress, which generated a greater conversion of reserve carbohydrates into soluble sugars used in the respiration process for the decomposition of polysaccharides and oxidation of sugars to organic acids, CO₂, water, and energy (Álvarez-Herrera et al., 2022).
Total Carotenoids
Regarding total carotenoids, Sun et al. (2022) report that carotenoids are compounds that plants can synthesize from precursors available in the soil and in the air. Therefore, differences in irrigation do not significantly affect the plant's ability to absorb the nutrients necessary to produce carotenoids, which is similar to Vélez-Sánchez et al. (2021), who also did not find significant differences in the carotenoid content in pear fruits subjected to different water levels. In contrast, Mossad et al. (2020) found that a water deficit stimulates carotenoid accumulation and suggested that the evolution of color reflects the characteristic physiological process during ripening, driven by the degradation of chlorophyll and the synthesis of carotenoids.
Color
For color, the results are consistent with those reported for pomegranate fruits, where the RDI did not significantly affect the color parameters L*, a*, and b* during cold storage (Fialho et al., 2021), and in the pear fruit cv. Triumph of Vienna did not affect the color index of the epidermis and pulp during cold storage (Bayona-Penagos et al., 2017). In apples, the color is water-dependent (Lu, 2022). However, water deficits affecting fruit quality parameters result in changes in epidermal color due to their implications for fruit ripening. Additionally, reduced vegetative growth under water deficit conditions may increase fruit exposure to sunlight (Conesa et al., 2021), with no changes in pear fruit epidermal coloration during cold storage, as observed for total carotenoids. This result can also be attributed to storing pears at 1°C, which reduces ethylene synthesis and its effects in all fruits. It is well known that ethylene is involved in the color change of the fruits. In cherry, the RDI did not affect fruit color during storage at 2°C for 20 days and during the subsequent shelf-life period (Blanco, Martínez-Hernández et al., 2019).
The absence of differences between the results found in the different irrigation levels for the 2015 season led to the conclusion that the water deficits reduced irrigation and provided significant water savings without causing differences or effects on the postharvest quality and crop yield, as compared to the fruits in the control (100% of ETc, T0).
CONCLUSIONS
The results showed minimal differences in pear behavior among the three irrigation levels, with a similar postharvest duration for all fruits in both 2014 and 2015. In the Colombian tropics, significant water savings may be achieved in soils with similar characteristics using the two deficit irrigation treatments, without altering key fruit properties during postharvest cold storage, such as firmness, carotenoids, and skin color. However, some of the parameters studied, including soluble solids, titratable acidity, and respiration rate were more sensitive to deficit irrigation, showing differences compared with pears from well-watered trees.

