




 English (pdf)
 Article in xml format
 Article references
 Automatic translation
 Send this article by e-mail
 Cited by SciELO
  Cited by Google
  Similars in
SciELO
Similars in
SciELO  Similars in Google
 Permalink

Introduction
Currently, different nations around the world are looking for different types of low-emission energy sources, processes, and technologies that allow them to face climate change. One of the biggest and most complex challenges that companies generating greenhouse gas emissions face today is the issue of carbon and the management of the full cycle of their emissions (NETL, n.d.; SLB, n.d.).
The capture and geological storage of CO2 have experienced growing interest and application in recent years, emerging as a promising strategy for mitigating atmospheric carbon emissions. This approach involves capturing excess CO2 from various anthropogenic sources and injecting it into suitable geological formations, where it can be securely stored over extended periods, thereby preventing its release back into the atmosphere (GCCSI, 2022; SLB, n.d.). In Colombia, studies related to CO2 capture and storage are limited; however, the country has begun to encourage research on carbon storage, which is why the evaluation of CO2 storage potential in the country's basins is highly valuable for the path to decarbonization (Ministerio de Minas y Energía, 2022).
The Lower Magdalena Valley (LMV) Basin, located in the northwest of Colombia, is one of the country's potential sites for geological CO2 storage, considering the proximity of various CO2 sources, such as petrochemical, cement, and oil and gas industries (Corficolombiana, 2019; Yáñez et al., 2020). Total emissions from the departments within the basin area (Magdalena, Bolívar, and Córdoba) amount to approximately 19 Mton of CO2 equivalent per year (IDEAM et al., 2016).
Therefore, in the present study, the CO2 storage potential of the Lower Magdalena Valley Basin is evaluated. Additionally, a compilation of information related to carbon storage processes, the geological characteristics of the basin, and a description of the potential based on geological aspects and properties of the basin is presented. The geological units evaluated in the study include the Ciénaga de Oro Formation, interpreted as Oligocene to early Miocene transgressive deposits, and the Porquero Formation, which was deposited after a regional early Miocene tectonic event involving shallow marine, clastic sedimentation, and fine-grained facies (Mora-Bohórquez et al., 2020).
A comprehensive basin model was developed using diverse datasets, including depth structural maps, facies maps, paleogeographic maps, and well data.
The basin model was constructed using Petrel and PetroMod software. Subsequently, using the basin model with PetroMod software, various properties of the basin were simulated, including temperature, pore pressure, pressure gradient, temperature gradient, and porosity. These results served as the basis for assessing the CO2 capture and storage potential in the basin's geological formations. Additionally, simulations of CO2 injection were carried out in different sectors of the basin to observe the CO2 plumes and their behavior in the geological units over time, since the injection began. The results obtained from this study allow us to demonstrate the potential of the Lower Magdalena Valley Basin in terms of CO2 storage and present an optimal methodology for the assessment of this type of project in the country and any basin around the world.
Theoretical Framework
Carbon Capture and Storage (CCS)
This section provides a concise overview of each component associated with Carbon Capture and Storage (CCS), along with the current state of knowledge about each element within the context of Colombia.
Carbon capture: Carbon dioxide (CO2) capture involves capturing the CO2 produced from different sources instead of releasing it into the atmosphere. The main options for capturing CO2 as a result of human activities are industrial processes, cement factories, electricity generation, and hydrogen production (Kaldi et al., 2009). In Colombia, potential sources of carbon dioxide emissions suitable for carbon capture include cement and steel production, fossil fuel combustion for electricity generation, petroleum refining, and activities related to natural gas extraction and processing. Several projects addressing these emission sources are currently being implemented as part of national efforts to reduce greenhouse gas emissions and advance climate change mitigation strategies (CIAT-Ministerio de Minas y Energía, 2021).
Carbon Storage: Carbon storage involves the injection and disposal of CO2 into the subsurface, storing it in reservoirs or geological traps (Kaldi et al., 2009).
Geological Storage: Geological storage involves injecting and storing CO2 underground in reservoirs or geological traps. CO2 can be stored in different types of geological traps. Among the geological storage options for CO2, the best-known types are depleted oil and gas deposits, deep saline aquifers, deep coal beds, basalts, shales, and cavities (Kaldi et al., 2009).
Rodriguez (2023) conducted a comprehensive evaluation to screen and rank sedimentary basins in Colombia based on key criteria, including containment security, storage capacity, and technological feasibility. The study found that the basins with the highest containment security scores were Cayos, Colombia, Sinu Offshore, and Tumaco Offshore. In terms of storage capacity, the top-performing basins were Llanos, Caguán-Putumayo, and Cordillera. Meanwhile, the Lower Magdalena Valley, Sinu-San Jacinto, and Llanos basins ranked highest for technological feasibility.
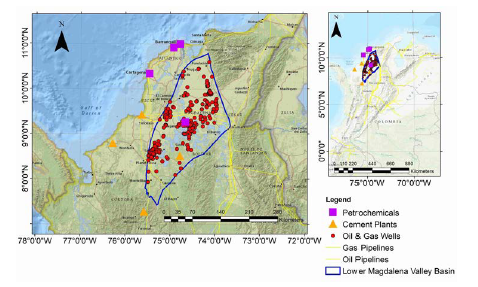
Study Area - Lower Magdalena Valley Basin (LMV) Location - General Information: The Lower Magdalena Valley Basin is located in northwest Colombia (Figure 1). It extends from the Serranía de San Lucas and the Sinú region in the south to Barranquilla in the north, and from the Santa Marta Massif in the east to the Montes de María in the west. It has a length of 355 km along the north-south axis and an extension of 240 km from west to east (Arminio et al., 2011). The LMV covers an area of 42,000 km2 and is located between two major basement terranes: the northern Central Cordillera in the S and SE and the Sierra Nevada de Santa Marta on the NE (Mora-Bohórquez et al., 2020).
Geological Background: The Lower Magdalena Valley is a Paleogene "peri-Caribbean" to recent multiphase basin, which is classified as a forearc basin, involving transtension, transrotation, crustal flexure, and tectonic collapse processes. All these processes are guided by multiple and successive tectonic phases (Arminio et al., 2011). The LMV is located in an area where the Caribbean oceanic plate and the South American continental plate have been interacting throughout the Cenozoic (Mora-Bohórquez et al., 2020).
The main sedimentary component (Figure 2) in the basin spans from the Oligocene to the present, throughout most of the basin. The Oligocene sequence includes the Ciénaga de Oro Formation, which consists of coastal sands and neritic muds, and on paleohighs, there are isolated carbonate banks that formed between the Late Oligocene and Early Miocene (Reyes et al., 2000).
The Ciénaga de Oro Formation is considered a potential target unit for carbon storage due to its diverse depositional environments, which include shoreface, deltaic, estuarine-tidal, and shallow marine platform settings. The shoreface facies is characterized by interbedded sandstones, claystones, and siltstones. The estuarine-tidal facies comprises bioturbated sandstones and shales, with thicknesses ranging from 15 to 20 meters. The platform facies is distinguished by bioclastic layers rich in foraminifera and mollusk shell fragments (Rosero et al., 2014).
The Porquero Formation is associated with neritic to bathyal depositional environments and is stratigraphically subdivided into the Upper Porquero and Lower Porquero members. The Upper Porquero is characterized by interbedded shales and sandstones, whereas the Lower Porquero predominantly comprises shales with turbiditic deposits, reflecting deposition in a deeper marine setting (Di Luca-Vingelli, 2016). The shales of the Upper Porquero are particularly significant for this study due to their excellent physical properties as a sealing unit. They serve as the regional top seal for the underlying reservoir rocks, playing a critical role in the integrity of potential carbon storage systems (ANH, 2006).
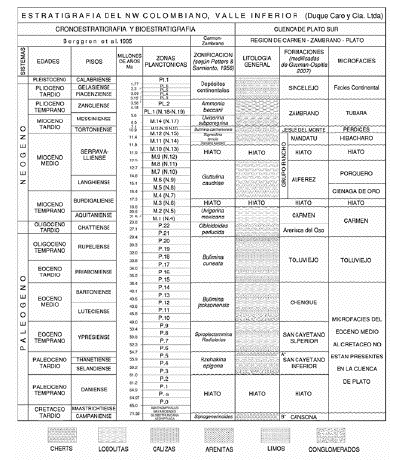
Figure 2 Stratigraphic column Lower Magdalena Valley Basin (from THX Energy Sucursal Colombia, 2015).
Regarding the sedimentary cycles during the Oligocene, there was a cycle of transgression with a maximum episode of flooding in the Early Miocene that extended throughout the basin, during which massive shales rich in organic matter were deposited, underlying a thick succession of massive shales and sandstones. This succession is known as the Lower Porquero Formation or the Lower Carmen Formation, according to different authors (Niño et al., 2006; Arminio et al., 2011; Mora-Bohórquez, 2021).
For the Middle Miocene, units with a high shale content in most of the basin and a greater abundance of sand than the Lower Porquero Formation are found. This unit is known as the Middle Porquero Formation, Floresanto Formation (Flinch, 2003), or the Middle Carmen Formation (SHELL, 1995).
Lower Magdalena Valley Basin - CO 2 Sources: In the study area, and mainly in nearby areas, there are concrete and cement plants, oil and gas fields, and the petrochemical industry (Figure 1), which are important sources of CO2 to the atmosphere and have the potential for CO2 capture (Corficolombiana, 2019; Google, n.d.a; Google, n.d.b). The total CO2 equivalent emissions for the departments that cover the LMV basin area are Magdalena: 5.75 Mton, Bolívar: 8.05 Mton, and Córdoba: 6.70 Mton per year (IDEAM et al., 2016). Potential Cd transport routes may align with existing natural gas pipeline infrastructure (Yáñez et al., 2020). For emission sources located outside the basin, the estimated transport distances to the storage site range from approximately 100 to 200 kilometers, as illustrated in Figure 1.
Methodology
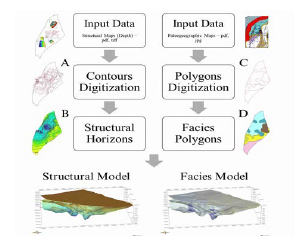
The basin model used for property estimation and CO2 injection simulation (Figure 3) was developed by integrating multiple data sources, including structural depth maps, paleogeographic reconstructions, and general basin information obtained from academic studies and the Petroleum Information Bank (BIP) of the Colombian Geological Survey (SGC). The methodology applied in this study is commonly used in the oil and gas industry when available data are stored in formats such as PDF, TIFF, or other image-based formats. This approach enables the utilization of interpreted data from academic or industry sources by digitizing maps, thereby reducing the time required for manual interpretation (Xu et al., 2013).
Input Data
The structural surfaces in depth used in this study were generated from structural maps derived from various oilfield projects within the basin, developed by companies such as Petrolifera Petroleum (Colombia) Limited, Hocol S.A., and Canacol Energy. Additionally, structural maps from academic studies conducted in the region, including those by Mata (2014) and Mora-Bohórquez et al. (2017, 2020), were incorporated to enhance the structural model by providing additional data (Figure 3).
The data utilized in this study were collected and provided by the Colombian Geological Survey through the Petroleum Information Bank (BIP). The structural maps correspond to the Ciénaga de Oro and Porquero formations, which were selected as the primary focus of the study based on their lithological characteristics, depth ranges, and the role of the Porquero Formation as a regional seal within the basin, as previously discussed.
As this study was conducted at the basin scale (site screening level), facies distribution maps were generated using paleogeographic reconstructions covering the entire basin during the time intervals corresponding to the deposition of the Ciénaga de Oro and Porquero formations (Oligocene-Miocene). These maps were compiled from multiple sources, including ANH (2021), Sarmiento-Rojas (2019), and Mata (2014).
Contours Digitization
Depth contours for the study area were digitized from the structural map datasets referenced in the previous section. These datasets were previously georeferenced using ArcGIS software. Polygons were created to delineate the areas of interest, within which the depth contours were digitized and stored for subsequent analysis (Figure 3A). The resulting contours carry inherent uncertainties, both from the resolution limitations of the original structural map datasets and from the interpretation process carried out by the original authors of the maps.
Depth Structural Maps Generation
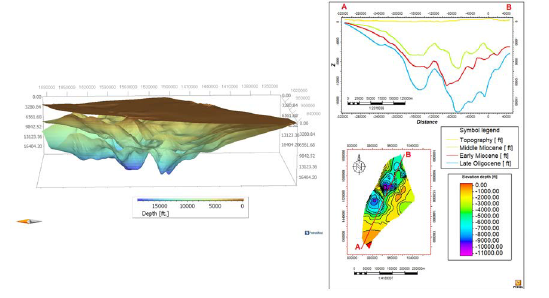
The structural depth maps were generated based on the digitized depth contours and using the Make/ Edit Surface tool included in Petrel Software (Figure 3B). The algorithm selected for the generation of the structural surface based on contours is the "Convergent Interpolation" method, and the geometry of the surface (size and position of the grid) was adjusted based on the input (contours). To generate the topographic structural map (surface), contour lines derived from a digital elevation model (DEM) were used as input, following the same procedure applied to the other depth structural maps.
Extrapolation of Structural Maps
The digitized structural maps from which the depth contours were generated cover a large portion of the study area (Lower Magdalena Valley Basin). However, there are areas in which there is no contour coverage. For these areas, an extrapolation of the structural contours was carried out based on a polygon representing the edge of the basin, which defines the total study area.
Facies Polygons Generation
Facies maps were generated by delineating representative polygons based on paleogeographic reconstructions of the study area, as described in the Input Data section and illustrated in Figure 4. These paleogeographic maps, developed by ANH (2021), Sarmiento-Rojas (2019), and Mata (2014), were constructed using biostratigraphic data from wells, previously published paleogeographic interpretations, structural maps, and estimates of paleowater depths.
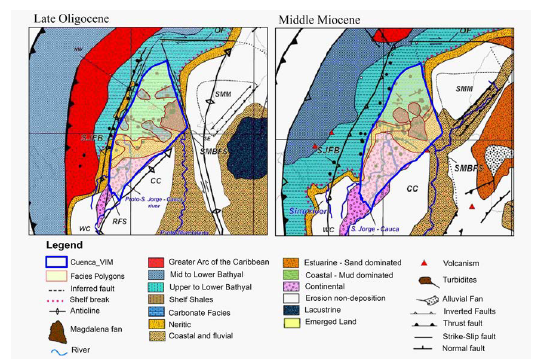
The analysis of the facies and their relationship with the paleogeographic maps was carried out based on the stratigraphy of the study units (Ciénaga de Oro Formation - Porquero Formation) and onpaleogeographic descriptions of the depositional periods of the formations studied between the Oligocene and Miocene (Figure 5).
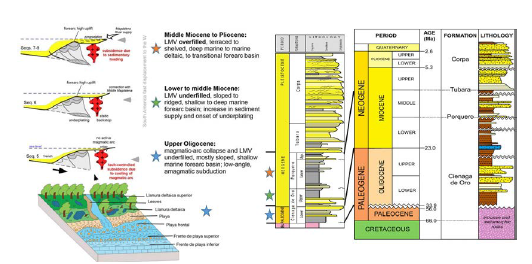
Figure 5 Depositional environments - Ciénaga de Oro and Porquero Formations (modified from ANH, 2006; Mata, 2014; Castillo-Guerra and Soto-López, 2017).
According to different authors such as Dueñas (1986), Niño et al. (2006), and Mata (2014), during the Oligocene - Lower Miocene, the Ciénaga de Oro Formation was deposited in a range of environments, from neritic and bathyal to paleo-highlands with calcareous platforms, while the Porquero Formation was deposited in the Lower Miocene - Middle Miocene in a deep marine to bathyal environment (Figure 5).
Reservoir properties for the Ciénaga de Oro Formation, as reported in various studies (Arminio et al., 2011; ANH, 2006; Di Luca-Vingelli, 2016), indicate a thickness range of approximately 500 ft, although significant variations exist across the basin. The formation outcrops at the surface in some areas, whereas in the deepest parts of the basin-specifically the Plato and San Jorge depocenters-it reaches depths of up to 17,000 ft. Average porosity is around 15%, with localized intervals in some wells exhibiting sandstone porosities ranging from 19% to 28%. The most suitable reservoir zones for carbon injection are expected to be associated with these high-porosity sandstone bodies, provided they fall within the acceptable depth range for CO2 storage.
For the sealing unit, the Porquero Formation, the same authors report thicknesses ranging from 20 to 500 ft and depths from surface outcrop down to approximately 14,000 ft. The formation is characterized by low porosity, primarily due to its high shale content, making it an effective regional seal.
Facies polygons were created by digitizing paleogeographic maps of the study area, as described in the Input Data section. Each polygon corresponds to a distinct facies, defined according to the paleogeographic environments and descriptions provided by the original authors (Figures 3C, 3D, and 4).
Basin Modeling
The basin model (Figure 6) was designed in PetroMod software based on the models generated in Petrel (depth structural maps - facies polygons). Figure 3 presents the methodology and sequence of steps used to generate the model of the Lower Magdalena Valley Basin, from the input data and Petrel application to basin modeling through PetroMod simulations.
The objective of the simulation using the basin model was to generate a three-dimensional representation of the basin, incorporating key subsurface property distributions, including temperature, geothermal gradient, pore pressure, pressure gradient, and effective porosity. Additionally, the model was used to simulate CO2 injection, enabling the evaluation of saturation evolution and CO2 behavior over time. The results of this simulation serve as a basis for identifying the most suitable areas within the basin for carbon storage. To perform this analysis, it was necessary to assign lithologies to each facies polygon, define the basin's latitude to determine the standard temperature at sea level (SWIT), and specify heat flow conditions to simulate the basin's thermal regime. For the injection simulation, injection points and the properties of the injected fluid (CO2) were also defined.
Lithology Definition: Lithologies were defined based on sedimentological and stratigraphic data from multiple sources, including Niño et al. (2006), Mata (2014), Castillo-Guerra and Soto-López (2017), and Manco-Garcés et al. (2020), in conjunction with the paleogeographic maps used to generate the facies polygons. Once the appropriate lithologies were theoretically assigned to each facies polygon within the basin, the PetroMod lithology libraries were utilized to define lithologies and assign the corresponding petrophysical property values, as shown in Tables 1 and 2. It is important to note that these lithological assignments carry a degree of uncertainty due to potential discrepancies between the generalized platform lithology properties and the actual properties of the geological formations in the study area.
Table 1 Lithology definition for the model (PetroMod).
| Lithology name | Thermal conduct. model | Thermal conduct. at 20°C (W/m/K) | Thermal conduct. at 100°C (W/m/K) | Thermal conduct. min. temperature (°C) | Thermal conduct. max. temperature (°C) | |
|---|---|---|---|---|---|---|
| 1 | Continental Sandstone | Sekiguchi model | 3.95 | 3.38 | 0.00 | 320.00 |
| 2 | Upper-Mid-Bathyal Limestone (micrite) | Sekiguchi model | 3.00 | 2.69 | 0.00 | 320.00 |
| 3 | Coastal-Fluvial Sand- stone (subarkose) | Sekiguchi model | 4.55 | 3.82 | 0.00 | 320.00 |
| 4 | Neritic-Sandstone (Wacke) | Sekiguchi model | 2.60 | 2.40 | 0.00 | 320.00 |
| 5 | Fan-Sandstone (subarkose) | Sekiguchi model | 4.55 | 3.82 | 0.00 | 320.00 |
| 6 | Upper-Mid-Bathyal Shale | Sekiguchi model | 1.64 | 1.69 | 0.00 | 320.00 |
| 7 | Carbonate - Limestone (Organic rich) | Sekiguchi model | 2.00 | 1.96 | 0.00 | 320.00 |
Table 2 Model Lithologies and rock properties theoretical models (PetroMod).
| Thermal conduct. multi-point model | Anisotropy factor thermal conduct. | Depositional anisotropy | Depositional anisotropy | Thermal expansion coefficient [1e-6/K] | |
|---|---|---|---|---|---|
| 1 | Sandstone (typical) | 1.15 | Off | 1.15 | 33.00 |
| 2 | Limestone (micrite) | 1.19 | On | 1.02 | 33.00 |
| 3 | Sandstone (subarkose) | 1.14 | Off | 1.14 | 33.00 |
| 4 | Sandstone (Wacke) | 1.40 | Off | 1.40 | 33.00 |
| 5 | Fan-Sandstone (subarkose) | 1.14 | Off | 1.14 | 33.00 |
| 6 | Shale (Typical) | 1.60 | On | 1.02 | 33.00 |
| 7 | Limestone (Organic rich) | 1.95 | On | 1.17 | 33.00 |
Facies Modeling: Facies maps were generated in PetroMod using facies polygons initially constructed in Petrel. Each polygon was assigned a specific lithology based on paleogeographic maps and sedimentological and stratigraphic data from various authors (Figure 5). Facies definitions were established in PetroMod and lithological properties were assigned to each facies type according to the previously defined classifications. The facies polygons were then imported into PetroMod, where facies maps were created by assigning the corresponding lithology to each polygon (Figure 3D). The model resolution was set to a cell size of200 m x 200 m, balancing the extensive spatial coverage of the basin with the computational requirements of the simulation. It is important to note that the model presents limitations in representing anisotropy and lateral facies variability due to the nature and resolution of the available input data.
Model Settings: Based on the structural model and facies models generated, certain configurations were applied to link the structural maps to the facies maps, and, on the other hand, define the boundary conditions to be used for property modeling and injection in simulation.
Two models were designed (Figure 7), varying the facies of the unit that acts as a seal between the Middle and Early Miocene to observe the importance of the seal and compare migration variations with the lithology. The first model was designed considering the facies of the paleogeographic maps and lithology information associated with these facies for the Porquero and Ciénaga de Oro formations. The second model was designed using the same facies and lithologies, except that in this case the Middle Miocene unit was assigned as a shale layer (simulating a regional seal based on well information), and the lithology corresponding to the Upper-Mid Bathyal shale was assigned for further analysis and correlations.
Model Preparation for Simulation
This section outlines the adjustments made to the models prior to simulation. Table 3 summarizes the models and equations configured in PetroMod for basin modeling and for the simulation of reservoir properties relevant to CO2 injection.
Table 3 Summary of models and equations used for basin modeling and CO2 injection simulation.
| Property Simulation Models | |
|---|---|
| Thermal Conductivity | Sekiguchi’s Model - 1984 (Sekiguchi, 1984) |
| Heat Capacity | Waples’s Model for Rocks - 2004 (Waples and Waples, 2004) |
| Mechanical Compaction | Athy’s Law - 1930 (Athy, 1930) |
| Permeability | Multipoint Model |
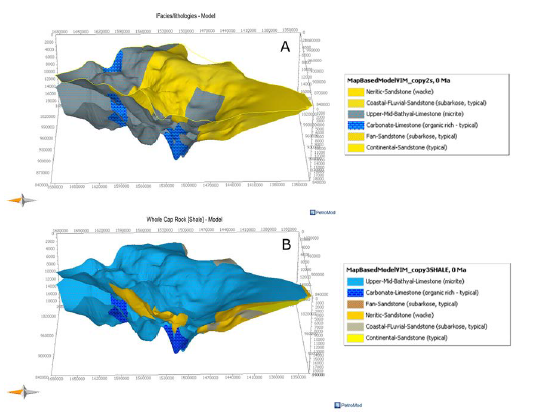
Figure 7 Lower Magdalena Valley Basin facies models. A. Facies/Lithologies model based on paleogeographic maps. B. Whole Cap Rock model with a continuous shale layer representing a regional seal.
Age Assignment: In this section, the ages were assigned for each of the model horizons, based on the depth maps and ages from diferent studies (Mora-Bohórquez et al., 2020; Rosero et al., 2014). Likewise, facies maps corresponding to each layer were assigned. Additionally, for the injection study unit, five sublayers were generated to achieve better resolution in this area.
Sediment Water Interface Temperature (SWIT): In this section, the information about the hemisphere, continental location, and latitude of the basin was set so that, based on the Wygrala model, the standard temperature at sea level can be extracted through geological time based on the current geographical location and the paleolatitude (Wygrala, 1989).
Heat Flow: Heat Flow settings were applied to generate thermal regimes and trends, establishing the basin's thermal conditions. This process was done based on average values for heat flow in the study area, with an average value of 40 mW/m2 and an error of ±15% (López and Ojeda, 2006; Mora-Bohórquez, 2021).
Component Injection: The injection simulation was configured to run over a 50-year injection period followed by a 200-year prediction phase. Carbon dioxide (CO2) was used as the injected fluid, with an injection temperature of 31.04 °C, pressure of 1,071 psi, and a liquid-phase density of 818 kg/m3. A total CO2 mass of 50 Mtons was assigned to each injection well. This value was established based on typical carbon capture rates from comparable projects, where the average capture is approximately 1 Mton/year (Veloso, 2023).
Twenty injection points were created randomly within the basin, using polygons that surround the areas with the lowest data uncertainty as boundaries (Figure 8). The uncertainty is associated with the areas that were extrapolated, as described in the Extrapolation of Structural Maps section (Figure 3A).
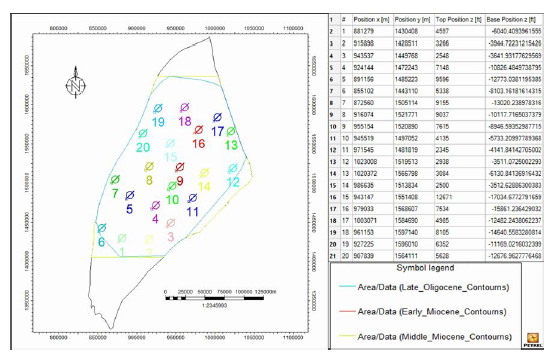
The injection depth was determined based on the structural surfaces corresponding to the Late Oligocene and Early Miocene intervals, which represent the prospective reservoir units. Accordingly, the injection depth for each well was set near the base of the stratigraphic interval defined by these two horizons. This configuration was designed to simulate CO2 migration through the formations across different regions of the basin, enabling the identification of areas with the highest potential for carbon storage.
Simulation
The simulation was configured using a 4x4 model sampling scheme with a grid cell size of 200 m x 200 m. Both 2D and 3D temperature and pressure modeling were performed, and CO2 migration was simulated using Darcy flow as the governing transport mechanism. The simulation output included a three-dimensional model of the basin, along with spatial distributions of temperature, pressure, and saturation properties.
Results and Discussion
Two distinct facies models were developed for the simulation: the first was based on facies distributions derived from paleogeographic maps, while the second incorporated a continuous shale layer to represent a regional seal for the Middle Miocene. For both models, heat flow conditions were varied using a baseline value of 40 mW/m2, with an uncertainty range of ±15%. As a result, six basin models were generated, each incorporating assigned facies distributions and varying heat flow scenarios (three values), along with alternative configurations for the Middle Miocene surface-either using the shale seal or the paleogeographic facies interpretation (Table 4).
Table 4 Model classification based on facies and heat flow.
| Facies/Heat Flow | 34 mW/m2 | 40 mW/m2 | 46 mW/m2 |
|---|---|---|---|
| Shale Regional Seal | Model 5 | Model 2 | Model 6 |
| Paleogeographic Maps | Model 3 | Model 1 | Model 4 |
Properties related to temperature, fluid pressure, compaction, and CO2 saturation were simulated based on the six basin models. Upon analysis, it was observed that certain parameters-particularly those associated with the basin's thermal regime-did not significantly influence key outputs such as porosity and pore pressure. Consequently, maps and detailed outputs are not presented for all model variations; instead, the focus is on those that exhibited meaningful differences.
Properties
The properties section presents simulation results (maps) of thermal, compaction, and fluid pressure conditions for the models. It is important to highlight that since the base and top of the reservoir correspond to the surfaces of the Late Oligocene and Early Miocene, no significant variation in properties was observed in these units when modifying the surface of the Middle Miocene based on lithology, for this reason in some results only one of the two models is presented (Whole cap rock - Shale).
Temperature: The reservoir temperature greatly influences the migration of CO2. At high temperatures, CO2 has a lower density, which implies lower efficiencies in the use of the pore volume available for storage and a strong buoyant force that facilitates migration (Chadwick et al., 2008). For the models, temperature maps were generated for the entire basin based on the lithologies, heat flow settings, and SWIT. Figure 9 illustrates the temperature distribution resulting from variations in facies and lithologies (model 1 and model 2).
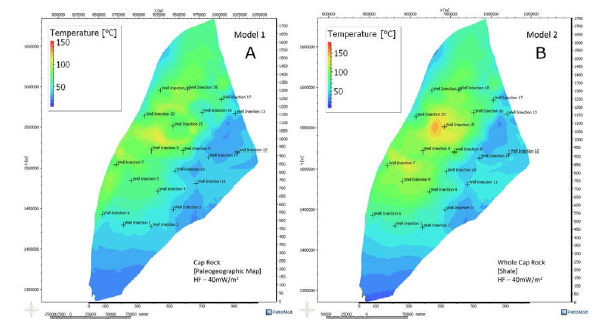
Figure 9 Temperature variations based on facies of the Middle Miocene Surface and injection wells. A. Model 1 - Cap Rock/ Paleogeographic. B. Model 2 - Whole Cap Rock/Shale.
The geothermal regime, or behavior, of the basin is highly relevant because it influences the injection depth, storage capacity, and the behavior of CO2 in the medium, considering that the fluid is stored at supercritical conditions at approximately 31.1 °C (Ruiz et al., 2007). For the Lower Magdalena Valley (LMV) Basin, the temperature results (Figure 9) show values between 20 °C to 114 °C and 22 °C to 140 °C for Model 1 and Model 2, respectively. The highest temperatures are observed in the central and northwestern parts of the basin, represented by green to red colors.
Figure 10 presents the temperature distribution for the top and base of the reservoir according to heat flow variations.
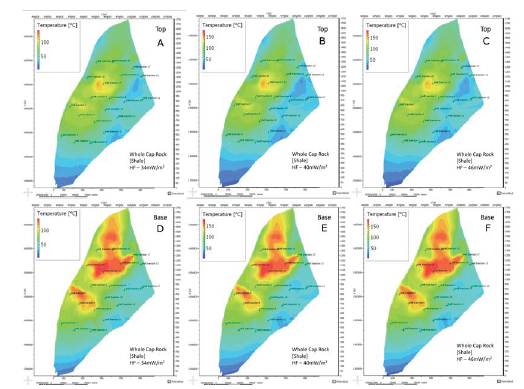
Figure 10 Temperature variations according to heat flow - Reservoir Top and Base. Top reservoir: A. 34 mW/m², B. 40 mW/m², C. 46 mW/m². Base reservoir: D. 34 mW/m², E. 40 mW/m², F. 46 mW/m²
The variations in heat flow (Figure 10) reveal significant temperature fluctuations within the 25 °C to 200 °C range. However, a clear pattern is evident, with the highest temperatures concentrated in the northern and central regions of the basin (green to red colors). Based on this evidence, this area has sufficient temperatures to store CO2 under supercritical conditions.
Temperature (Geothermal) Gradient: The temperature gradient or geothermal gradient indicates the variations in temperature with depth (Figure 11). The gradient is site-dependent, which can lead to variations in temperature at storage depths and affects CO2 density (Vilarrasa and Rutqvist, 2017).
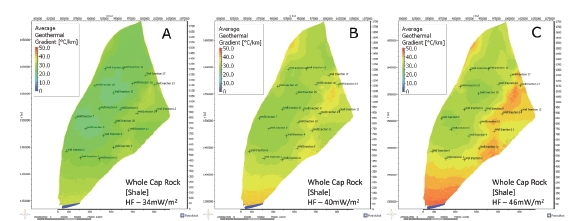
Figure 11 Temperature gradient variations according to heat flow (HF) - Reservoir Top - Shale Model (Whole Cap Rock). A. HF = 34 mW/m2, B. HF = 40 mW/rtf, C. HF = 46 mW/itf.
Gradients between 15 °C/km-35 °C/km are evident (Figure 11), where the greatest potential for storage and optimal use of volume is found in the intermediate gradients between 20 °C/km-30 °C/km, located in the center and northwestern regions. Comparing the geothermal gradient results with the geothermal map of Colombia (Alfaro et al. 2009), in which the ranges for the basin are between 15 °C/km-25 °C/km, the ranges are very similar.
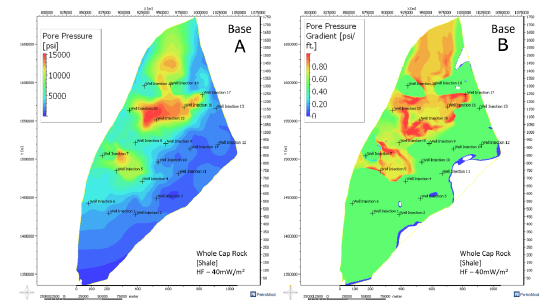
Pore Pressure: Pore pressure (Figure 12A) is an important parameter in geological CO2 storage projects, as the integrity of the seal layer and the sealing capacity of faults depend on pore pressure conditions, along with other geomechanical properties of the rock. Furthermore, pore pressure is a determining parameter in the costs of an injection project (Chang, 2017).
The pore pressure from the basin model shows a wide range of pressures (600 psi to 15,000 psi). The highest pressures (9,000 psi-15,000 psi) are found in the deepest parts of the basin (12,000 ft-19,000 ft), corresponding to the Plato depocenter in the north and the San Jorge depocenter in the south (Figure 12), and are represented by yellow to red colors. These high-pressure and high-depth areas are not considered potential for CO2 injection due to the high costs involved. Zones of intermediate pore pressure (3,000 psi-8,000 psi) occur at depths of 6,000 ft-10,000 ft (blue to green regions). These zones show greater injection potential, since CO2 reaches supercritical conditions at pressures above 1,057 psi (NETL, n.d.). Depths less than 6,000 ft with lower pore pressures may present a risk of CO2 migration to the surface or shallow aquifers, according to injection simulation.
Pressure Gradient: The pore pressure gradient (Figure 12B) indicates the variation of pressure with depth. A normal pressure gradient ranges between 0.433 psi/ft for fresh water and 0.465 psi/ft for brine. An abnormal intermediate pressure gradient is between 0.6-0.7 psi/ft, an overpressure gradient is above 0.7 psi/ft, while a subnormal pressure gradient has values below 0.4 psi/ft (Abdelaal et al., 2021).
The pore pressure gradients in the model (Figure 12B) present normal gradients close to 0.45 psi/ft for most of the basin, however, there are overpressure zones with gradients between 0.7 psi/ft-1.0 psi/ft (red zones in Figure 12), which correspond to the depocenters of Plato and San Jorge, these areas are not considered potential for CO2 storage.
Effective Porosity: Effective porosity (Figure 13) is one storage capacity because it represents the free space in of the determining and critical parameters in the CO2 the reservoir in which the volume of injected CO2 will be stored (Chadwick et al., 2008).
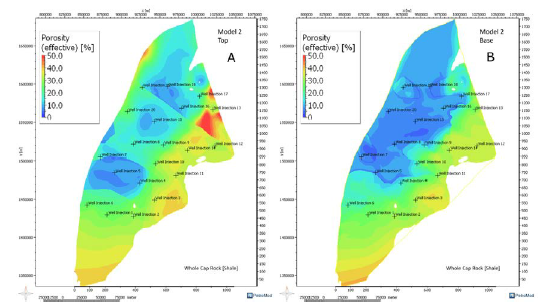
Figure 13 Effective porosity at the base and top of the reservoir (Late Oligocene - Early Miocene). A. Top of the reservoir, B. Base of the reservoir.
The efective porosity results across the models range from 5% to 35%, with values between 5% and 23% observed in the central and northwestern regions of the basin, which is a good indicator of the CO2 storage capacity (Figure 13). Notably, higher porosity values are found in the southern and eastern areas, contrasting with the distribution of favorable thermal properties. This observation is significant, as porosity is a critical parameter for evaluating the feasibility and performance of carbon storage projects and should be carefully considered in site selection.
CO2 Injection
The CO2 Injection section presents simulation results of CO2 saturation and CO2 plume migration for the models.
CO2 Saturation: CO2 saturation (Figure 14) is an important parameter for the safety of a CO2 injection process and to evidence the flow and mobility of CO2 in the reservoir (Moghadasi, 2022). Carbon saturation is represented by green and red plumes in Figure 14.
CO2 Plumes: the CO2 plumes show the flow and migration of CO2 over time according to the simulation parameters. Furthermore, it demonstrates the safety of the basin for CO2 storage (Figure 14).
The results of saturation and CO2 plumes (Figure 14) show that, in the eastern part of the basin, there is a risk of CO2 migration to the surface due to low pore pressures and shallow depths. These plumes correspond to wells 1, 2, 12, and 16. Additionally, in Model 2 (whole cap rock - shale as a regional seal), CO2 migration does not reach the surface because the seal prevents vertical movement. Instead, CO2 moves horizontally, which is the expected fluid migration behavior.
Based on these results, and considering depth, pressure, temperature, and optimal saturation for CO2 storage in geological formations, the areas with the greatest storage potential in the Lower Magdalena Valley Basin are shown in Figure 15. These areas correspond to the center and northwest of the basin.
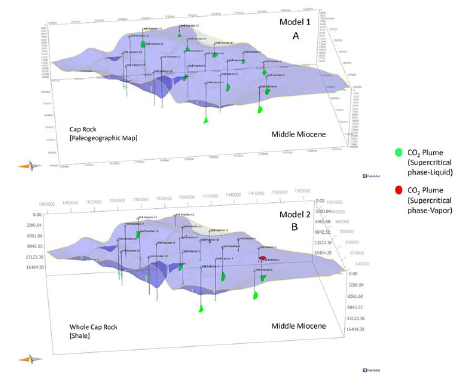
Figure 14 Plumes and CO2 saturation at the cap rock (surface). A. Model 1 - Cap rock (paleogeographic facies), B. Model 2 -Whole cap rock (shale).
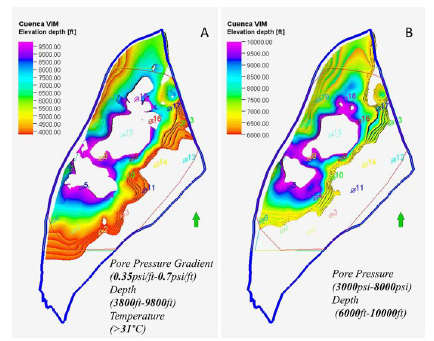
Figure 15 Potential areas for carbon storage in the Lower Magdalena Valley Basin - Reservoir: Late Oligocene-Lower Miocene (Ciénaga de Oro Formation). A. Based on pore pressure, pressure gradient, depth, and temperature; B. Based on pore pressure and depth.
Based on the results and considering pore pressure gradients, temperatures, and optimal depths for carbon storage in geological formations, boundary conditions were established to highlight the areas with the greatest storage potential (Figure 15A).
High-pressure and high-depth areas are not considered suitable for CO2 injection due to the associated high costs. In contrast, zones with intermediate pore pressures (3,000-8,000 psi) at depths of 6,000-10,000 ft show greater injection potential (Figure 15B), since CO2 reaches supercritical conditions at pressures above 1,057 psi (NETL, n.d.). Depths less than 6,000 ft, with lower pore pressures, may pose a risk of CO2 migration to the surface or shallow aquifers, according to injection simulations.
Conclusion
This modeling study of the Lower Magdalena Valley (LMV) Basin enabled the evaluation and identification of potential areas for geological CO2 storage by integrating structural, facies, and sedimentological information with thermal, pressure, and saturation simulation results. The assessment was based on key reservoir and seal properties, including temperature, geothermal gradient, pore pressure, pressure gradient, depth, efective porosity, and CO2 migration patterns.
The results indicate that the LMV Basin possesses promising potential for CO2 storage, particularly in the central and northwestern regions. These areas exhibit favorable conditions for injection, such as appropriate reservoir depths, pressure and temperature regimes, and positive simulation outcomes. Notably, the pressure and temperature conditions in the potential reservoir units support the maintenance of CO2 in a supercritical state, which is a critical requirement for effective long-term geological storage.
Porosity values within the modeled formations range from 5% to 23%, indicating adequate storage capacity across different areas of the basin. Notably, the highest porosity values are observed in the southern and eastern regions; however, these do not align with the most prospective areas identified based on other key properties. These properties, along with CO2 saturation distributions and migration behavior, allowed for the delineation of target areas within the basin that warrant further investigation. The preliminary identification of these zones, illustrated in Figure 15, lays the groundwork for more detailed site-specific studies aimed at supporting future carbon capture and storage (CCS) initiatives in the LMV Basin.

