




 English (pdf)
 Article in xml format
 Article references

 Automatic translation
 Send this article by e-mail
 Cited by SciELO
 Cited by Google
 Similars in
SciELO
 Similars in Google

 Permalink


The figures from the Pan American Health Organization indicate a considerable increase in the number of people with excess weight throughout the Americas in recent decades (PAHO, 2023). In Colombia, data indicates that 50% of adults and 17% of adolescents are overweight (Ministerio de Salud y Protección Social, 2021). This condition has usually been studied by addressing the causes and the consequences on physical health (Meldrum et al., 2017; Philip & James, 1998; Rosiek et al., 2015). However, this is not the only area of impact. People with excess weight often experience rejection behaviors, which can lead to mental health issues such as guilt, altered self-esteem, and emotional dysregulation, among others (Navajas-Pertegás, 2017; Warnick et al., 2022; Wu & Berry, 2017). Likewise, it has been shown that this social rejection contributes to adopting poor eating habits, increasing excess weight, affecting physical health, and even causing body rejection (Puhl et al., 2020).
To address the impacts on mental health, it is essential to understand that these rejection behaviors are derived from negative attitudes towards people with excess weight. According to Crandall (1994), these attitudes are composed of three elements: (1) dislike of associating with overweight people; (2) the belief that people can control their weight; and (3) the fear of gaining weight. These manifestations impact various biopsychosocial aspects, such as differential treatment in the medical field that hinders access to adequate healthcare (Talumaa et al., 2022). Also, in the entertainment industry, this problem is evident as there is a negative (villains, comic resources, without a partner, laziness) and scarce representation of overweight people (Greenberg et al., 2003). Likewise, news that can increase weight stigma is disseminated in the media. On social networks, overweight people tend to receive more hostile, aggressive, and persistent comments about their physical appearance compared to thin people (Chou et al., 2014; Westbury et al., 2023).
Given the conditions in which discrimination occurs, one of the most affected populations is children and adolescents, as during this stage, they begin to be exposed to exclusion behaviors both in their family and school environments, where bullying dynamics are established towards overweight youths (Adelardi, 2022). Also, this population is more susceptible to beauty stereotypes, reflected in the emission (even unconscious) of rejection behaviors toward excess weight (Cullin, 2021; Saz & Baile, 2023). This increases the likelihood of developing emotional problems (Juvonen et al., 2017), body image disturbances leading to body dissatisfaction, or a negative self-perception of one’s body (Meadows & Calogero, 2018), engaging in risk behaviors associated with suicidal ideation and attempts (Brochu, 2020), and engaging in unhealthy eating behaviors such as skipping meals or binge eating (Vartanian & Porter, 2016).
Given the impact of this problem, it is necessary to measure these negative attitudes to prevent negative behaviors which could impact the mental and physical health of children and adolescents (Adelardi, 2022; Puhl & King, 2013). This has led to the development of instruments designed to assess different dimensions of negative attitudes, such as weight bias internalization and negative attitudes towards people with excess weight. Examples of instruments measuring the first dimension include the Weight Bias Internalization Scale (WBIS; Durso & Latner, 2008), the Weight Self-stigma Questionnaire (WSSQ; Lillis et al., 2010), and the Scale for Treatment-based Experiences of Weight Stigma (STEWS; Chen & Gonzales, 2022). Additionally, scales such as the Attitudes Towards Obese Persons Scale (I-ATOP; Allison et al., 1991) and the Antifat Attitudes Scale (AFA), developed by Crandall in 1994, are used to measure the second dimension, the latter of which is one of the most frequently employed instruments (Brown et al., 2022; Selensky & Carels, 2021; Stangl et al., 2019).
This scale measures the three components of weight discrimination through 13 items divided into three subscales: dislike, fear of fat, and willpower. The AFA has been adapted in several countries, such as Greece (Argyrides et al., 2022), France (Langumier, 2022), the Czech Republic (Pipová et al., 2024), and Spain (Macho et al., 2022; Magallares & Morales, 2014). Additionally, the pertinence of the items to each subscale was confirmed, finding results similar to Crandall’s original test. Despite the AFA being valid for application in other contexts, it has not been adapted or validated in Colombia. Therefore, this research aimed to adapt and validate the AFA for the Colombian adolescent population, expecting a factorial structure and adequate psychometric properties similar to Crandall’s (1994) version and Magallares and Morales’s (2014) adaptation. Sex differences are anticipated, with males scoring higher on the general AFA scale, along with a correlation between negative attitudes towards being overweight and a negative body image.
Method
Participants
This study initially included 689 participants, of which 27 were discarded for failing to meet the inclusion criteria. Therefore, the final sample consisted of 662 students between 12 and 19 years of age (M = 16.40 SD = 1.64) from 16 cities and municipalities in the departments of Cundinamarca, Caldas, Boyacá, Risaralda, and Casanare. Of these, 14.9% resided in rural areas and 85% in urban areas. The Body Mass Index (BMI) was calculated based on participants’ self-reported weight and height. The values available were: 82% (n = 532) had a BMI indicating normal weight, 11% (n = 74) overweight, 2% (n = 16) obesity, and 4% (n = 23) underweight. No cases of malnutrition were reported. Participants were selected through non-probability convenience sampling. Inclusion criteria required participants to be of Colombian nationality, sign informed consent, and have written authorization from their legal guardians in the case of minors (under 18 years of age in Colombia). Additionally, cases where participants did not complete all scale questions (AFA and S-BISS) or marked multiple options on any item were excluded. Table 1 details the sociodemographic variables of the participants.
Table 1 Sociodemographic characteristics of the sample divided by gender
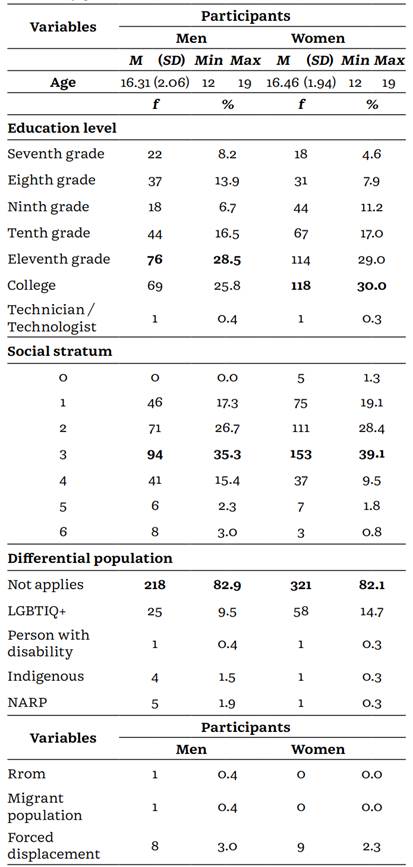
Note. M = mean; SD = Standard Deviation and f = frequency; % = percentage; NARP (Black communities), Afro, Raizal, Palenquero; Rrom (Gypsies). Social stratum refers to the Colombian classification of the incomes of the population, low incomes (0-2); middle incomes (3-4); high incomes (5-6). The values in bold indicate the chosen option based on the highest sample percentage.
Instruments
Sociodemographic and Weight Perception SemiStructured Questionnaire (ad hoc). This questionnaire was specifically designed for this study to gather information on sociodemographic characteristics and perceptions related to being overweight. This section includes questions related to age, gender, academic level, the presence of a family member who is overweight, self-perception of being overweight, social conditions, and negative attitudes towards being overweight. The purpose of this questionnaire is to characterize the sample.
Antifat Attitudes Scale (AFA; Magallares & Morales, 2014). The Antifat Attitudes Scale (AFA) is a version translated and validated in Spain of the AFA developed by Crandall in 1994. This scale consists of 13 items with responses on a Likert scale ranging from 1 (strongly disagree) to 7 (strongly agree). The AFA is structured into three subscales, each representing a specific factor of negative attitudes towards overweight. The first subscale, Dislike, encompasses items 1 to 7 and measures negative feelings towards overweight people. The second subscale, Fear of Fat (items 8 to 10), assesses the fear of gaining weight, while the third subscale, Willpower (items 11 to 13), measures perceptions regarding weight control. This version of the AFA obtaining a Cronbach’s Alpha (a) reliability coefficient of .85 for the global scale. The subscales also demonstrated reliable scores: dislike (a = .86), fear of fat (a = .78), and willpower (a = .68). Likewise, favorable reliability values have been reported for other Spanish versions (Macho et al., 2022). A higher score on the scale indicates more negative attitudes towards overweight.
Body Image State Scale (S-BISS; Mebarak et al., 2019). The Body Image State Scale (S-BISS), initially developed by Cash et al. (2002), is a tool designed to assess the body image state in individuals. This scale consists of six items answered on a nine-point Likert scale, focusing on different aspects of the individual’s perception of their physical appearance. An example of an item is: “At this moment, I feel about my physical appearance.” The version of the S-BISS used in this study was adapted, translated, and validated for the Colombian context by Mebarak et al. (2019), obtaining a reliability coefficient of Cronbach’s Alpha of a = .80 in their sample of Colombian university students.
Procedure
This research was submitted to the ethics committee of the Fundación Universitaria Konrad Lorenz, and after approval, the AFA adaptation was conducted. First, a linguistic and cultural adaptation was carried out with three Colombian psychologists (who had lived in Spain for at least one year) to improve semantic nderstandding in Colombia. Subsequently, four experts (two in health psychology and two in evaluation and measurement) validated the adaptation. A pilot test was then conducted with ten students, leading to modifications in 7 items (Appendix 1). Educational institutions were contacted, and meetings were held with parents to obtain consent and assent according to Law 1090 of 2006. The instruments were applied physically and virtually: (1) Semi-structured sociodemographic questionnaire, (2) AFA, and (3) S-BISS. Finally, students received a workshop on respect for body diversity as compensation, with no monetary reward provided.
Statistical analysis
The statistical analyses were performed using JASP®. For the AFA adaptation, the protocol for linguistic and cultural adaptation of questionnaires in the same language was followed (Vallejo-Medina et al., 2017). For validation by judges, five properties were assessed: representativeness, ownership, comprehension, interpretation, and clarity (Soto & Segovia, 2009). Aiken’s V coefficient was estimated (scores < 0.5; CI = .95; Aiken, 1985). Then, exploratory and confirmatory factor analyseswere performed to determine construct validity. Prior to these analyses, Mardia’s Multivariate Normality test (Mardia, 1980) was applied, followed by multicollinearity tests, Bartlett’s test of sphericity (values < 0.5; Bartlett, 1950), and the Kaiser-Meyer-Olkin test (KMO; values between 0 and 1; Kaiser, 1970).
Half of the randomly selected sample was used for the exploratory factor analysis (EFA), employing Oblimin rotation and a polychoric covariance matrix (Lloret-Segura et al., 2014). Confirmatory factor analysis (CFA) was conducted with the remaining sample using the unweighted least squares (ULS; Uriel & Aldás, 2005) estimation method. Four indicators were considered to evaluate model fit: RMSEA (< 0.1), TLI (> 0.9), CFI (> 0.9), and SRMR (< 0.08; Browne & Cudeck, 1989).
Finally, Cronbach’s Alpha and McDonald’s Omega (Ω) were calculated to determine reliability. Due to the distribution of AFA and S-BISS scores, Spearman’s correlation test was used to analyze convergent validity.
Results
Construct validity
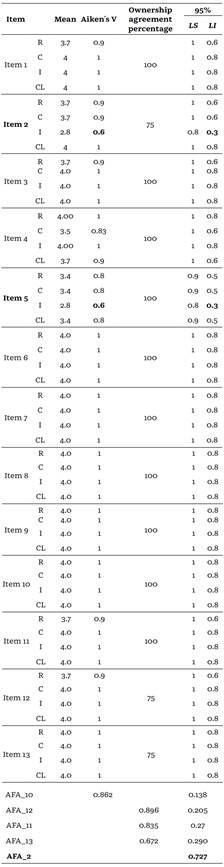
The results of Aiken’s V coefficient (Table 2) show that most items obtained adequate scores, except for items 2 and 5, which obtained values < .05 in the lower limit. In both items, this score was obtained in the interpretation interpretation factor. Originally, item 2 was constructed with a negative format with double negation, which can cause a construct-irrelevant variance (CIV) when applying this format to students (Carrillo et al., 2020), so the final item was “I have few friends who are fat” (“Tengo pocos amigos que son gordos”). Despite this change, the research team considered that the content of this item did not have a clear relationship with the AFA subscales. These items were monitored in other analyses to determine their permanence in the scale. Therefore, all items show over 75% agreement on ownership of factor belonging, indicating a likely high relevance and alignment with the factor under evaluation.
Exploratory and confirmatory factor analysis
The Mardia test yielded a p-value < 0.001 for the factorial analyses, indicating that the data are not normally distributed. Consequently, the factorial analyses used a polychoric correlation matrix and the ULS estimation method. Subsequently, collinearity values were obtained, with Bartlett’s test of sphericity yielding a p-value < 0.001 and the KMO test scoring .87, considered acceptable (Kaiser, 1970).
Based on these values, Exploratory Factor Analysis (EFA) was performed, revealing three components into which the 13 AFA items were divided. Most items replicated Crandall’s (1994) original structure, except for item 2, which exhibited a high uniqueness value, excluding it from any AFA factors (Table 3). The three factors that obtained eigenvalues greater than 1 were considered satisfactory (Kim & Mueller, 1978). These three factors accounted for 72.7% of the variance, indicating a good fit, according to Meneses et al. (2013). The first component, dislike, excluding item 2 (as it did not achieve the inclusion criteria), explained 31.9% of the variance. The second component, fear of fat, explained 20.9% of the variance, and the third factor, willpower, explained 19.9%.
Table 3 Exploratory factor analysis scores
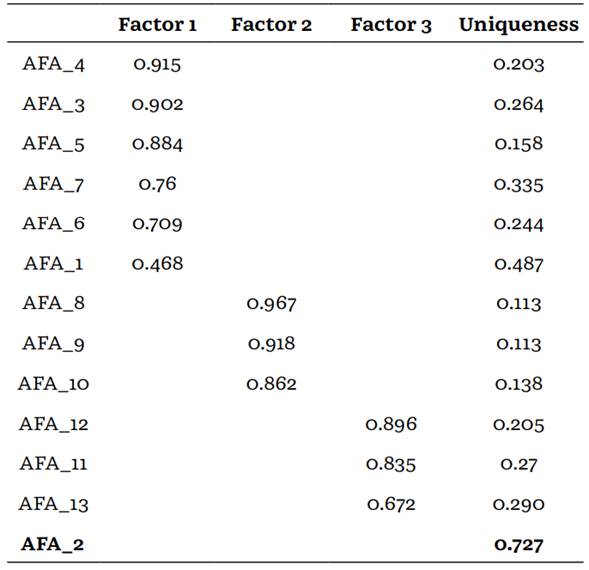
Note. The applied rotation method is Oblimin. The value presented in bold indicates a high uniqueness value, excluding it from any of the AFA factors.
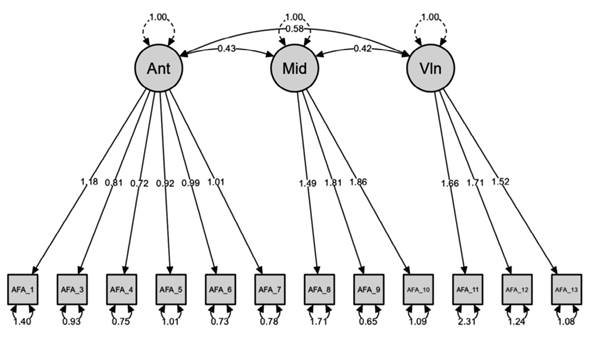
CFA was first conducted using the original model proposed by Crandall (1994). The initial model yielded adequate values in the fit indices CFI = 0.97, TLI = 0.96, and SRMR = 0.07; however, the RSMEA value of 0.2 indicated a poor fit. Due to this, a second analysis was performed, excluding item 2 from the scale based on the EFA results. This revised model produced the following values: RSMEA = 0.17, CFI = 0.98, TLI = 0.98, and SRMR = 0.05. These results suggest that the original model (including item 2) does not fit well, whereas the revised model, which excludes item 2, shows good fit indices (Figure 1).
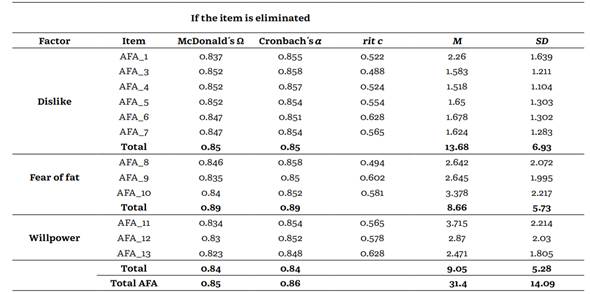
After the factor analysis, Cronbach’s alpha (a) and McDonald’s omega (Ω) were calculated with the whole sample; the results showed high-reliability scores for both the subscales and the overall scale. The dislike subscale had a score of Ω = .81 and a = .82. However, based on the Aiken´s V test results and the EFA, it was decided to calculate the reliability of the subscale without item 2, resulting in a score of Ω = .85 and a = .85, thereby increasing reliability. The other subscales achieved reliable scores, all above .84. Similarly, the overall score of the scale was Ω = .85 and a = .86, indicating that the AFA has good internal consistency (Meneses et al., 2013). The psychometric properties of the scale items can be seen on Table 4.
Convergent validity
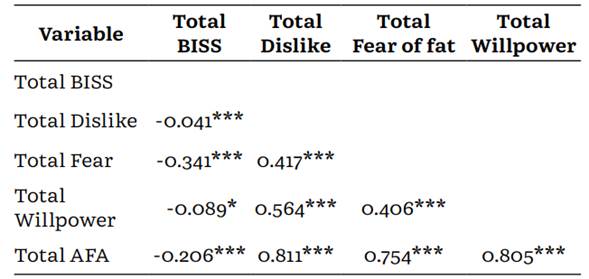
A Spearman correlation was performed to calculate the AFA’s convergent validity due to the data’s non-normal distribution (Table 5). Both the AFA subscales and the total score moderately, negatively, and significantly correlate with the S-BISS. The dislike and fear of fat subscales obtained a p-value < .001, while the willpower subscale obtained a p-value < .05. Finally, the total AFA score obtained a p-value < .001. These values are expected since individuals who score higher on the AFA tend to have lower scores on the S-BISS, indicating a more negative body image. Additionally, a high positive correlation was found among the AFA subscales.
Discussion
Obesity is highly prevalent worldwide (World Health Organization, WHO, 2021). This condition has implications for both physical and mental health, which rejection behaviors towards excess weight can exacerbate (Westbury et al., 2023). Despite being a significant problem, no instruments measuring these behaviors have been found in Colombia, especially among adolescents more exposed to the consequences of this rejection (Adelardi, 2022). Therefore, this article sought to adapt and validate the AFA, one of the most commonly used psychometric tools for evaluating negative attitudes towards obesity. A sample of 662 participants from 12 to 19 years of age from various Colombian departments was collected.
The tests indicate that the AFA model has a good fit except for item 2. Initially, during the test adaptation, the original content of item 2, “I do not have many friends who are fat,” was discussed. It was considered that this item might present difficulties because the prevalence of excess weight among Colombian adolescents is 17.9% (Ministerio de Salud y Protección Social, 2021), implying that few adolescents in classrooms are overweight, which could influence participants’ responses. This analysis followed the protocol for adapting the same language described by Vallejo-Medina et al. (2017) to evaluate content validity, an aspect not assessed in other adaptations such as those by Magallares and Morales (2014), Argyrides et al. (2022), Pipová et al. (2024), nor in Crandall’s original adaptation (1994).
Furthermore, when comparing the results of item 2 with those from other versions of the AFA, it was observed that in the Czech version (Pipová et al., 2024), the analyses performed did not allow for the identification of item 2’s values. In contrast, in the Greek version (Argyrides et al., 2022) and the Spanish version (Macho et al., 2022), both a principal component analysis (PCA) and a CFA were conducted, indicating that item 2 scored the lowest in both versions. In the case of Magallares and Morales (2014) Spanish version, item 2 yielded low EFA values, indicating a potential issue with this item beginning with the test translation. This, along with the low prevalence of overweight adolescents (Ministerio de Salud y Protección Social, 2021), could explain the inadequate scores found in the EFA for item 2, suggesting it does not belong to any AFA subscales in this adaptation. This is consistent with the CFA results, where Crandall’s original model (1994) obtained an inadequate RSMEA value (0.2); instead, the analysis without item 2 yielded a value of 0.1 and adequate values in the CFI, TLI, and SRMR indices, indicating a good model fit (Browne& Cudeck, 1989). Therefore, along with the reliability impact on the dislike subscale, it was decided to remove item 2 (Appendix 2). Excluding this item, a factorial structure similar to Crandall’s original (1994), Magallares and Morales (2014) and Macho et al. (2022)was found, with items distributed across the expected three factors. Additionally, a large percentage of the total variance explanation was found, indicating good criterion validity, according to Meneses et al. (2013).
The reliability scores of the scale, evaluated using a and Ω coefficients, indicated high internal consistency in both individual subscales and the overall scale, with values above 0.80 (Meneses et al., 2013). Furthermore, a significant positive correlation was observed between the AFA subscales, consistent with previous findings (Crandall, 1994; Magallares & Morales, 2014). Regarding convergent validity, a moderate negative correlation was found between the AFA and S-BISS, suggesting that more negative attitudes are associated with a more negative body image.
Although the results show an adequate adaptation to Colombian Spanish and favorable psychometric properties, such as convergent validity and a three-dimensional model, some limitations must be considered. The sample is concentrated solely on school-going adolescents and does not cover all regions of the country, limiting the generalisability of the results to the entire Colombian adolescent population. Furthermore, despite considering BMI, its classification, and the results being consistent with the distribution of excess weight among Colombian adolescents (Ministerio de Salud y Protección Social, 2021), the representation of people with excess weight is not equivalent to the other BMI classifications. Therefore, future research could include a representative sample of all BMI groups, as conducted by Macho et al. (2022), to assess intra-group discrimination. Moreover, variations in application conditions, such as physical and virtual modalities and the use of self-reported BMI, may have introduced biases. Future research is recommended to include a more diverse sample representing adults, unschooled adolescents, standardizing application conditions and reliable anthropometric measurement methods.
Despite the limitations, this study suggests that the AFA can be a valuable and promising tool for assessing attitudes towards overweight and obesity in the Colombian context, with significant implications for clinical practice and health research. The AFA represents the first test adapted and validated for the Colombian adolescent population, with good age representation, positioning itself as an instrument that allows identifying negative attitudes towards obesity in groups with higher prevalence and significant psychological impact, such as in health contexts (Talumaa et al., 2022) and educational contexts (Juvonen et al., 2017)1.

