


 English (pdf)
 Article in xml format
 Article references
 Send this article by e-mail
 Cited by SciELO
  Cited by Google
  Similars in
SciELO
Similars in
SciELO  Similars in Google
 Permalink
Introduction
Dairy cows mobilize body reserves to meet energy demands on the days before parturition and the first three weeks post-calving. As a result, plasma concentration of non-esterified fatty acids (NEFA) increase and are oxidized in the liver. Increased fatty acid (FA) oxidation depends, among others, on augmented carnitine palmitoyl transferase-I (CPT-1) activity, which increases by 49% on day one prepartum (Dann et al., 1999). This implies a proportional increase in the substrates (FA and carnitine) used by the enzyme CPT-1. Mobilization of protein reserves provides the necessary precursors for L-carnitine synthesis (Bell et al., 2000). Under the prevailing nutritional conditions of dairy farms in the Colombian high tropics, it is likely that the negative energy balance (NEB) during the transition period forces cows to increase the use of amino acids for energy, diminishing the lysine and methionine pools, which are substrates for carnitine synthesis. Under these conditions, significant associations have been reported between NEB and hepatic ammonium concentration, and between liver ammonium and pyruvate, suggesting increased usage of amino acids from body reserves as an energy source (Galvis et al., 2010). This situation can decrease carnitine precursors, possibly limiting CPT-1 activity. Under in vitro conditions, palmitate oxidation increases when bovine hepatocytes are supplemented with carnitine. Adding a CPT-1 inhibitor stops this increase, demonstrating how sensitive CPT-1 is to carnitine availability and suggesting that carnitine supplementation could modulate the enzyme activity (Drackley et al., 1991a). It is also known that carnitine supplementation in dairy cows produces variable results depending on dose and delivery route (Lacount et al., 1995; Lacount et al., 1996a; 1996b; Carlson et al., 2006; Carlson et al., 2007a).
Therefore, the objective of this study was to evaluate the lipotropic potential of L-carnitine in Holstein dairy cows during the transition period to lactation.
Materials and methods
Ethical considerations
The ethics committee for research of Universidad Nacional de Colombia (Medellín campus) approved this study (CEMED 200 communication, minute # 13, October 5th, 2010).
Location
The experiment was conducted at Paysandú Center, property of Universidad Nacional de Colombia, located in a tropical lower montane wet forest region according to the Holdridge classification of life zones (Espinal, 1977).
Animals and diet
A total of 21 Holstein cows between 2nd and 6th parity were used. Cows were between d 260 of gestation to d 20 postpartum. The cows grazed on kikuyu (Cenchrus clandestinum) grasslands and during pre-partum received 2 kg/d of feed supplement containing 0, 100, or 200 g L-carnitine fumarate according to treatment (T0, T100, and T200, respectively). After calving, the cows received 6 kg/d of feed supplement containing 0, 100, or 200 g of L-carnitine fumarate according to treatment. After the third postpartum day, milk production was recorded daily. When milk production was greater than 24 L, one additional kg of base supplement without L-carnitine fumarate was supplied for every 4 L of milk produced. The nutritional composition of grass and feed supplements are described in Table 1.
Concentrations of crude protein (PC, Kjeldahl method, Icontec, 1999, standard NTC-4657), fiber in neutral detergent (FDN, AOAC standard 2002.04), fiber in acid detergent (FDA, AOAC 973.18 standard), ash (Cen, AOAC standard 942.05), ether extract [EE, Icontec (2002), NTC-668 standard] and lignin (Lig, potassium permanganate) in kikuyu grass (C. clandestinum), and feed supplements are presented in Table 2.
Ruminal degradability of L-carnitine fumarate was estimated through the in vitro incubation test described by Galvis (2016), who reported 89.7% degradability. L-carnitine fumarate (99.59% L-carnitine fumarate, 58% of L-carnitine, Suzhou Vitajoy Biotech, China) was added to the basal feed formula. The inclusion levels of carnitine fumarate were 100 and 200 g. According to Galvis (2016), these levels were used to achieve approximately 6 and 12 g L-carnitine available for intestinal absorption, respectively. The experiment included seven cows per treatment. The experimental treatments were as follows: Control (T0), 100 g/d L-carnitine fumarate (T100), and 200 g/d L-carnitine fumarate (T200).
Table 1 Ingredients used in the formulation of the feed supplement
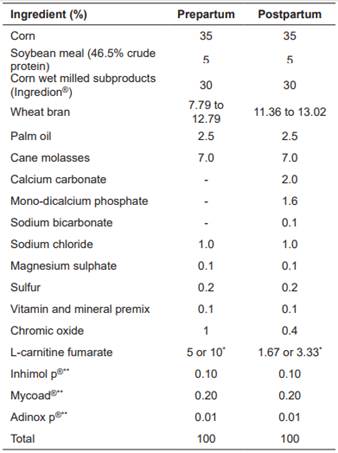
*These concentrations of L-carnitine fumarate guarantee 58 or 116 g/d consumption of L-carnitine depending on the supplementation level (treatment T100 or T200), with 2 and 6 kg/d consumption of feed supplement during prepartum and postpartum, respectively. **Feed preservatives.
Table 2 Chemical composition of kikuyu grass (Cenchrus clandestinum) and feed supplement.
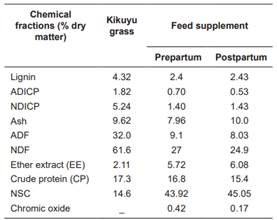
ADICP: Acid detergen insoluble crude protein; NDICP: Neutral detergen insoluble crude protein; NDF: Neutral detergent fiber; ADF: Acid detergent fiber; NSC: Non-structural carbohydrates = 100 - (CP + NDF + ash + EE) + CPIDN (NRC, 2001).
Sampling and laboratory analysis
Cows were weighed, blood-sampled (approximately 5 mL per cow), and body condition evaluated on d 270 of pregnancy, on the day of calving, and on d 10 and 20 postpartum. Liver biopsies were taken from each cow on d 270 of pregnancy and d 10 and 20 postpartum using previously described procedures (Galvis et al., 2016). Blood samples were taken from the base of the tail, thereby reducing pain or stress compared with other puncture sites such as the jugular vein. Local anesthesia was used and mild sedation was induced to collect liver biopsy samples through standard protocols (Waver et al., 2005). Serum was analyzed with spectrophotometric kits for NEFA, NEFA Fa-115 (Randox, London, UK), β-hydroxybutyrate (β-HB) by Ranbut RB 1008 (Randox, London, UK), and urea by UREA/BUN Color (Biosystems, Barcelona, Spain) concentrations. Liver samples were analyzed for total carnitine, free carnitine and acylcarnitine following the methods described by Prieto et al. (2006). Liver triglycerides were analyzed with a previously described method by Galvis et al. (2016). A Genesys 10S UV-VIS spectrophotometer (Thermo Scientific, NY, USA) was used. Estimation of dry matter intake was previously described by Madrid et al. (2015).
Net energy for lactation (NEL), live weight change (WeightC), balances of metabolizable protein (MP) and rumen-degradable protein (RDP) were calculated using NRC Software (NRC, 2001).
Statistical analysis
Data from repeated measures over time were analyzed using PROC MIXED of the SAS statistical package, version 8 (SAS, 1999). Composite symmetric and first-order auto-regressive covariance structures were modeled following Littell et al. (1998). First-order autoregressive was the most suitable covariance structure for all variables. Calving number, corrected milk yield (305d-2X-ME) in the previous lactation, and body condition at the beginning of the experiment were used as covariates. Mean comparison was performed using the LSD test. Statistical differences were considered at p<0.05. The statistical model included the fixed effects of treatment, sampling period and the interaction between treatment and sampling period.
Results
No interactions were observed between treatments and sampling periods for any of the variables (blood concentrations of NEFA, β-HB and urea, balances of NEL, MP and RDP, WeightC and hepatic concentrations of triglycerides, total carnitine, free carnitine and acyl-carnitine; p>0.05). None of the covariates [calving number, corrected milk yield (305d-2X-ME) in the previous lactation, and body condition at the beginning of the experiment] had a significant effect (p>0.05). Table 3 shows the nutritional balance and plasma indicators for each treatment. There were no significant differences (p>0.05) between treatments for NEFA, β-HB, NEL, MP, RDP, and WeightC. In contrast, blood urea concentrations were significantly lower in the control treatment (T0; p>0.05). Table 4 shows plasma indicators and nutritional balance per sampling period. All variables presented significant differences (p<0.05) between sampling periods. The ENL, MP, and RDP balances were significantly lower during postpartum. Blood concentrations of glucose and NEFA increased significantly at calving. Blood urea and β-HB were related to the variations of RDP and ENL in the different periods.
Table 3 Treatment means for nutritional balance and plasma indicators in Holstein cows fed increasing levels of L-carnitine fumarate.
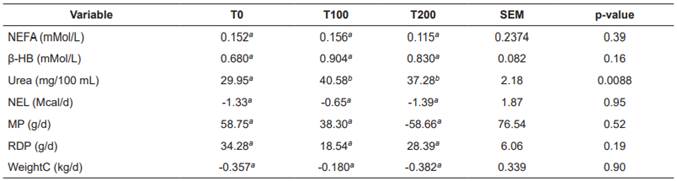
Means with different superscript letters (a, b) within the same row indicate significant difference (p<0.05). T0: Control; T100: 100 g/d L-carnitine fumarate; T200: 200 g/d L-carnitine fumarate; SEM: Standard error of the mean; NEFA: Non-esterified fatty acid; β-HB: β-hydroxybutyrate; NEL: Net energy for lactation; MP: Metabolizable protein balance; RDP: rumen-degradable protein; WeightC: live weight change.
Table 4 Sampling-period means for nutritional balance and plasma indicators in Holstein cows.
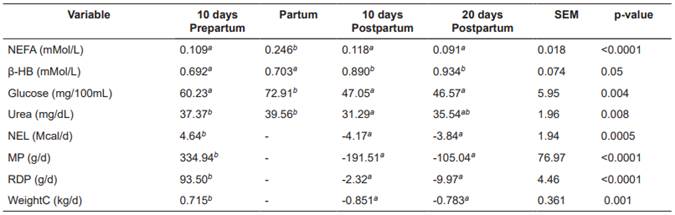
Means with different superscript letters (a, b) within the same row indicate significant difference (p <0.05). SEM: Standard error of the mean; NEFA: Non- esterified fatty acid; β-HB: β-hydroxybutyrate; NEL: Net energy for lactation; MP: Metabolizable protein balance; RDP: Rumen-degradable protein; WeightC: Live weight change.
There were no significant differences (p>0.05) between treatments with respect to liver concentration of acylcarnitine, free carnitine, and total carnitine. In contrast, hepatic triglyceride concentration was significantly lower (p<0.05) in T200 (Table 5).
Table 5 Treatment means for hepatic concentration of triglycerides, acylcarnitine, and total carnitine in Holstein cows fed increasing levels of L-carnitine fumarate.
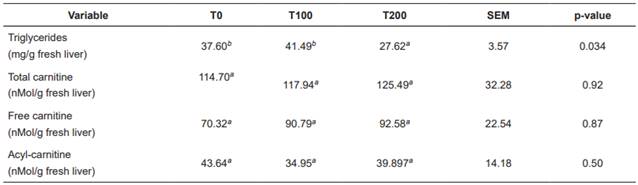
Means with different superscript letters (a, b) within the same row indicate significant difference (p<0.05). T0: Control. T100: 100 g/d L-carnitine fumarate. T200: 200 g/d L-carnitine fumarate. SEM: Standard error of the mean.
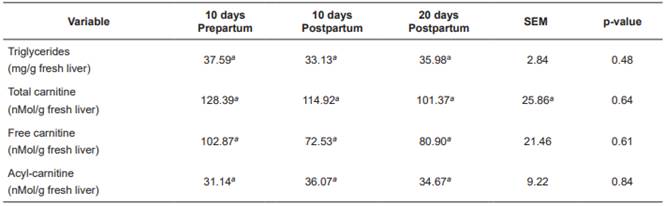
No significant differences were found between sampling periods for hepatic triglycerideconcentrations, acylcarnitine, free carnitine, and total carnitine (p>0.05; Table 6).
Discussion
Significant differences (p<0.05) were found in NEFA and β-HB concentrations within the different periods. The NEFA values around calving were significantly higher. This is due to the decrease in dry matter intake that occurs together with the increase of cortisol (Weber et al., 2013), which induces NEFA mobilization from the adipose tissue. The β-HB values at 10 days postpartum were significantly lower than the values found at d 10 and 20 postpartum; increased milk production leads to energy deficit and NEFA oxidation, which combines with increasing glucose deficit leading to greater β-HB concentration. The relationship between NEFA and β-HB at calving was not evident, because the increase in gluconeogenesis induced by cortisol during this period (Hammon et al., 2005) increased glucose levels, preventing the elevation of β-HB values (Erfle et al., 1971). Plasma urea values were higher at d 10 prepartum and at calving day. High values during prepartum can be explained by a higher rumen degradable protein balance during this period (Putnam and Varga, 1998). The high plasma urea values around calving result from the intense catabolism of amino acids destined for cortisol-induced gluconeogenesis (Hammon et al., 2005). This increases oxidative deamination of amino acids, generating ammonium, which is mostly transformed into urea (Madsen, 1983).
L-carnitine fumarate supplementation significantly increased plasma urea concentration (Table 3). According to other reports, administration of L-carnitine in sheep (Chapa et al., 1998; 2001) and growing bovines (White et al., 2001) increases plasma ammonium removal, possibly due to its conversion to urea. Most reports about carnitine effects on urea synthesis have been conducted in species other than bovines. Studies on monkeys with induced hyperammonemia (Ratnakumar et al., 1993; O’Connor et al., 1987a, O’Connor et al., 1987b), and on rat hepatocytes (Takeuchi et al., 1988; Tomomura et al., 1996) reported decreased hyperammonemia and increased urea synthesis in response to carnitine, which was attributed to several mechanisms (i.e. changes in enzyme expression, in enzymatic activity, and in the concentration of allosteric effectors). Indeed, a decrease in the carnitine-dependent fatty acid transport system causes an accumulation of acyl-CoA molecules in the cytosol, and these metabolites inhibit the urea cycle (Malaguarnera, 2013). Therefore, we suggest that the rise in plasma urea observed in animals supplemented with L-carnitine fumarate could be due to a significant increase in the urea cycle activity induced by L-carnitine. The first study with L-carnitine in cows indicated that carnitine infusion in the blood significantly increases blood concentrations of total ketones (Erfle et al., 1971), accounting for an increase in fatty acid oxidation. Researchers found that β-HB concentrations tended to be higher (p =0.07) in cows receiving 10 and 20 g carnitine available for intestinal absorption (Carlson et al., 2007a). However, the amount of ketone production in response to carnitine depends on the availability of carbohydrates (Erfle et al., 1971). In the present study, elevation in β-HB concentrations was not observed, possibly due to the amount of available glucose (Table 4), so that the increase of fatty acid oxidation could be significant, but without apparent changes in β-HB concentration.
Liver concentration of triglycerides (Tables 5 and 6) was low, according with levels reported by other authors (Kalaitzakis et al., 2007; Starke et al., 2010; Gross et al., 2013). Supplementation with 200 g/d L-carnitine fumarate significantly decreased hepatic triglyceride concentrations (Table 5), possibly due to a higher rate of fatty acid oxidation by the liver, decreasing their availability for esterification. Liver slices from cows during early lactation showed that carnitine increases total palmitate oxidation and decreases its esterification (Drackley et al., 1991b). In rat liver cells, distribution of fatty acids between esterification and oxidation is regulated by cytoplasmic concentrations of glycerol-phosphate or carnitine, respectively (Bremer et al., 1978). Carlson et al. (2007a) found that carnitine supply during early lactation decreases hepatic triglycerides and increases plasma concentrations of β-HB, even when liver triglycerides are low in the control treatment. Hepatic concentrations of the different forms of L-carnitine were lower (Tables 5 and 6) than those reported in other studies (Erfle et al., 1971; LaCount et al., 1995; Carlson et al., 2007a; 2007b) and were not affected by supplementation with L-carnitine fumarate. Other studies were able to increase hepatic carnitine concentrations only when they gave doses higher than 10g/d carnitine available for intestinal absorption, or 20 g/d in abomasal infusion (Carlson et al., 2007a; 2007b). The carnitine transport system in the liver has been characterized in human, rat and mouse (Ramsay et al., 2001). Carnitine uptake by the liver depends on relatively high carnitine concentration in the blood, since carnitine enters the liver through OCTN2 (organic cation transporter 2), a carrier with high Km (Michaelis-Menten constant) for carnitine (Km = 5.6 mM: Christiansen and Bremer, 1976), thus the liver takes carnitine from the blood when its concentration is significantly rised. It is possible that the low amounts of carnitine available for intestinal absorption in our study did not increase enough plasma carnitine concentration to achieve a significant increase in its entrance to the liver, thus its concentration was not increased. In conclusion, supplementation with 200 g/d L-carnitine fumarate significantly reduces hepatic triglyceride concentration, even when NEFA and hepatic triglycerides are low. Hepatic triglycerides decreased in response to carnitine supplementation possibly due to increased fatty acid oxidation. Supplementation with L-carnitine increases blood urea levels possibly due to an increase in the conversion of ammonia into urea. Both effects of the supplementation with L-carnitine can be beneficial for the metabolic health of dairy cows under energy deficit and dietary excess of rumen degradable protein.

