




 Spanish (pdf)
 Article in xml format
 Article references
 Automatic translation
 Send this article by e-mail
 Cited by SciELO
  Cited by Google
  Similars in
SciELO
Similars in
SciELO  Similars in Google
 Permalink

Introduction
Milk is composed of water, protein, amino acids, vitamins, lipids, fatty acids, and minerals. It is affected by factors such as breed or genetic group, milk production, stage of lactation, parity, feeding, and season of calving. Knowledge on the relative effects of genetic and environmental factors affecting milk components allows for changes in milk composition (Simões et al. 2014; Boro et al. 2016). Milk yield, milk chemical composition, and somatic cell count (SCC) can be affected by multiple genetic and non-genetic interrelated factors, such as parity, stage of lactation, calving season, herd, and calving year (Erdem et al., 2007; Atasever & Stadnik, 2015; Bertocchi et al., 2014; Sobczuk-Szul et al., 2015; Boujenane, 2021).Practices that help breeders gain information on how to obtain quality raw milk and improve milk quality for milk products (cheese, yogurt, cream, etc.) in different regions of Türkiye are also needed (Şahin & Yıldırım, 2012). The SCC in cow’s milk should be less than 200,000 cells/mL. When this number exceeds 200,000 cells/mL the udder lobe is most likely infected (Querengasser et al., 2002). In addition, the SCC in milk is an indicator of both resistance and sensitivity of animals to mastitis, which can be used to monitor the level or formation of subclinical mastitis in herds or individual animals (Malik et al., 2018). Milk Urea Nitrogen (MUN) is not in the protein structure and represents total nitrogen in milk. Urea passes into the milk from the secretory cells of the mammary glands and indicates the amount of degradable protein in the rumen. The MUN value is determined directly by the amount of urea in milk. MUN values between 10 and 14 mg/dL are considered normal. Daily dry matter and protein consumption affect MUN concentration in milk. While MUN values in milk below 10 mg/dL indicate insufficient dry matter and protein consumption, MUN values above 14 mg/dL indicate the opposite (Keser et al., 2019).The purpose of this study was to determine the effects of non-genetic factors (calving season, lactation number, lactation stage, and animal age) on milk yield, chemical composition of raw milk, and SCC in Holstein-Friesian cows.
Materials and Methods
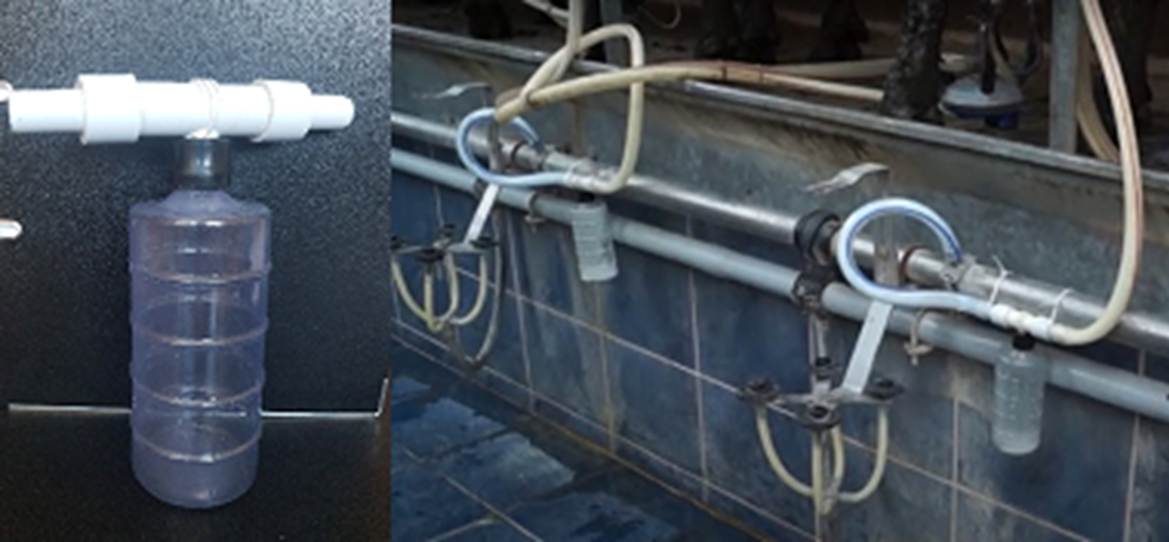
Data were obtained from 15,354 raw milk samples of 5,118 Holstein-Friesian cows from 276 dairy cattle farms in Türkiye. An average of three raw milk samples per cow was used. Based on EU standards, raw milk samples were taken from each cow 3 times a year to determine the SCC (Anonymous, 2006). Raw milk samples were taken equally from the beginning to the end of the milking process using a special sampling tool (Izmirbirlik Süt Numune Alma Aparatı, Izmir, Türkiye). The raw milk sampler consists of two parts: a pipe system in a spiral structure that separates the samples from the milk output, and a 500 mL container for collecting milk samples (Figure 1).
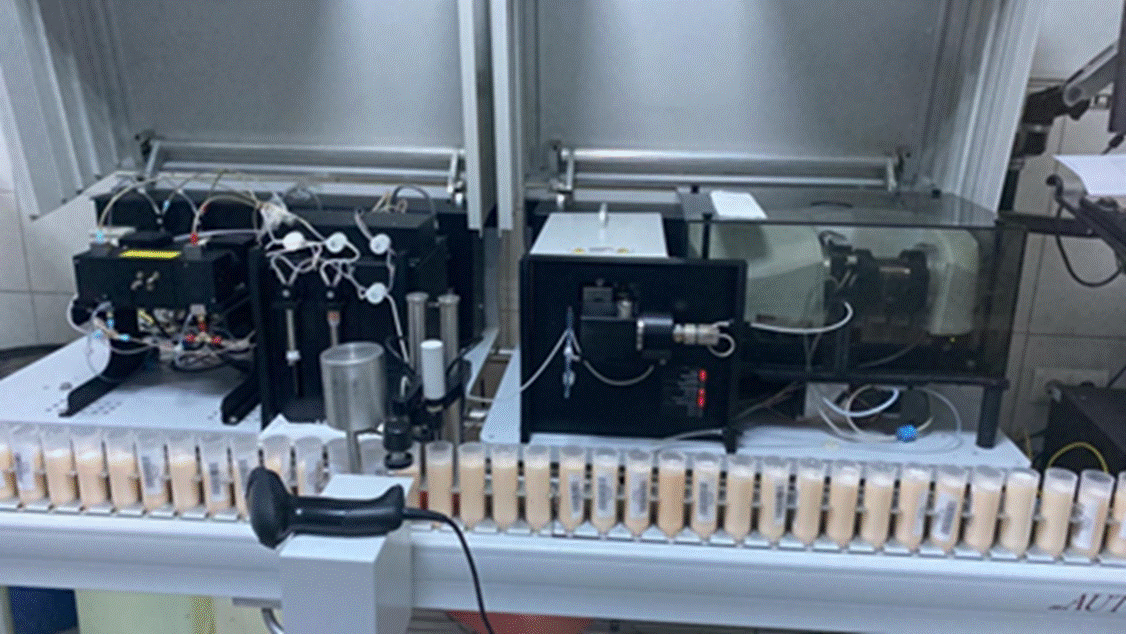
SCC and chemical components (fat, protein, dry matter, lactose, and urea) of the collected raw milk were analyzed using the milk analyzer (Bentley Combi FTS, Maroeuil, France) (Figure 2). This analyzer was suitable and met the requirements of the International Committee for Animal Recording standards (ICAR, 2017).
The Bentley FTS, which represents the latest technology for automated milk analysis, can analyze 400 samples per hour. This piece of equipment was engineered in accordance with Bentley Instruments’ rigorous design principles and provides precise and accurate measurements. It uses a Fourier Transform Spectrometer (FTIR) to analyze the milk composition, including dry matter, fat, protein, lactose, urea, and SCC. After the first stirring, the milk is drawn from a sample vial and delivered to the measurement module. The sampling, sequencing, and identification of the sample vials are performed using the auto sampler. No chemicals are used in the analysis (Figure 2).
The Bentley FTS meets the standards set by the International Dairy Federation (IDF), International Committee of Animal Recording (ICAR), and Association of Official Agricultural Chemists (AOAC) (BENTLEY, 2023).
The following data were collected for each animal sampled: fat, dry matter, lactose, protein, SCC, animal age, number of milking days, the highest daily milk yield, lactation milk yield, 305-day milk yield, season in which samples were taken, and lactation number. This information was obtained from the herd-book system of the Cattle Breeders’ Association of Türkiye.
Milk yield and milk components
In this study, the effects of calving season, lactation number, lactation stage, and animal age on fat (F), protein (P), dry matter (DM), lactose (L), urea (U), SCC, lactation milk yield (LMY), 305-day milk yield (305-d MY), and peak-day milk yield (PDMY) were investigated (Tables 1, 2 and 3).
Seasons were grouped into the following four classes: 1) Winter (December, January, February), 2) Spring (March, April, May), 3) Summer (June, July, August), and 4) Fall (September, October, November). Regarding lactation number, cows were categorized as 1 through 7 and above. Animal age was classified in months, as follows: 24-36, 37-48, 49-60, 61-72, 73-84, 85-96, and 97 and above. Herd size was grouped into the following five classes: <51, 51-100, 101-500, 501-1000, and >1000 animals.
Lactation stage was divided into six groups, as follows: Lactation-I (<46 days), early Lactation-II (46-90 days), mid-Lactation (91-180 days), late lactation-I (181-270 days), and late Lactation-II (>270 days) (Table 4).
Statistical analysis
Data analysis was performed with the SPSS statistics program (SPSS 25.0; 2021). Analysis of variance (ANOVA) was used for data analysis. The statistical model evaluated the effect of calving season, lactation number, animal age, and herd size on milk yield, milk components, and SCC. Since repeated milk samples were taken randomly on different lactation days, the effect of repeated measurements was included in the error variance. The following statistical model was used:
Yijkl=µ+ ai +bj +ck+dl+eijkl
Where;
µ = Overall Mean.
ai = Effect of ith season at calving (1-4).
bj = Effect of jth lactation number (1-7).
ck = Effect of kth animal age (1-7).
dl = Effect of lth herd size (1-5).
eijkl = Random error.
Duncan’s multiple range test (p<0.05) was used to compare the mean values of groups. Correlations among milk yield and milk components were also calculated with the SPSS program (SPSS 25.0, 2021).
Results
The mean standard deviation and median results of F, P, DM, L, U, SCC, PDMY, LMY, and 305-d MY are provided in Table 1.
Table 1 Descriptive statistics for milk yield, raw milk components, and SCC.
| Parameter | Unit | N | X ± SE | SD | Median |
|---|---|---|---|---|---|
| F | % | 1,490 | 3.74 ± 0.01 | 0.56 | 3.68 |
| P | % | 1,490 | 3.19 ± 0.01 | 0.31 | 3.16 |
| DM | % | 1,490 | 11.36 ± 0.03 | 1.02 | 11.33 |
| L | % | 1,490 | 4.32 ± 0.01 | 0.35 | 4.30 |
| U | mg/dL | 1,133 | 21.57 ± 0.28 | 9.43 | 19.00 |
| PDMY | kg | 5,118 | 33.70 ± 0.14 | 9.64 | 33.00 |
| LMY | kg | 974 | 8,538.33 ± 89.64 | 2,797.43 | 8,526.50 |
| 305-d MY | kg/305 | 974 | 6,479.42 ± 168.96 | 5,273.01 | 7,666.50 |
| SCC | cells/mL | 1,490 | 224,164.34 ± 4,401.80 | 169,911.59 | 174,250.00 |
N: Sample size, X: Least square mean, SE: Standard error, SD: Standard deviation, F: Fat, P: Protein, DM: Dry matter, L: Lactose, U: Urea, PDMY: Peak-day milk yield, LMY: Lactation milk yield, 305-d MY: 305-day milk yield, SCC: Somatic cell count.
Although the effect of calving season on P and DM was not statistically significant (p>0.05), the effect of calving season on L (p<0.05), F (p<0.01), and SCC (p<0.01) was significant. The effect of lactation number on F (p>0.05) was not significant, while its effect on P, DM, L, and SCC was significant (p<0.01) (Table 2). The effect of animal age and herd size on F, P, DM, L, and SCC was significant (p<0.01) (Table 2).
The effect of calving season and herd size on LMY, 305-d MY, Urea, and PDMY was significant (p<0.01). Although the effect of lactation number on LMY and 305-d MY was not significant (p>0.05), the effects on U (p<0.05) and PDMY (p<0.01) were significant. In addition, the effect of animal age on 305-d MY (p<0.05), LMY, U, and PDMY (p<0.01) were significant (Table 3).
Table 2 Least square means of raw milk components according to factors.
| F | P | DM | L | SCC | ||
|---|---|---|---|---|---|---|
| Factors | N | X ± SE | X ± SE | X ± SE | X ± SE | X ± SE |
| Herd size (head) | ** | ** | ** | ** | ** | |
| <51 | 473 | 3.60 ± 0.02ab | 3.13 ± 0.01b | 11.20 ± 0.05b | 4.25 ± 0.02a | 249,611.07 ± 6,940.80bc |
| 51-100 | 254 | 3.69 ± 0.03bc | 3.23 ± 0.02c | 11.25 ± 0.06b | 4.26 ± 0.02a | 275,973.03 ± 9,937.08c |
| 101-500 | 380 | 3.76 ± 0.03c | 3.23 ± 0.01c | 11.75 ± 0.05c | 4.43 ± 0.18a | 225,614.92 ± 8,632.51b |
| 501-1000 | 187 | 3.56 ± 0.05a | 3.40 ± 0.03d | 11.91 ± 0.07c | 4.51 ± 0.03b | 162,564.17 ± 18,677.82a |
| >1000 | 196 | 4.29 ± 0.03d | 2.98 ± 0.01a | 10.64 ± 0.06a | 4.21 ± 0.02c | 151,573.98 ± 2,748.76a |
| Calving season | ** | NS | NS | * | ** | |
| Winter | 286 | 3.76 ± 0.03b | 3.16 ± 0.02a | 11.32 ± 0.06 a | 4.29 ± 0.02a | 239,304.23 ± 9,162.12bc |
| Spring | 233 | 3.58 ± 0.03a | 3.20 ± 0.02 a | 11.48 ± 0.06 a | 4.36 ± 0.02b | 216,238.24 ± 11,072.04ab |
| Summer | 463 | 3.64 ± 0.02a | 3.19 ± 0.01 a | 11.33 ± 0.05 a | 4.31 ± 0.02ab | 245,631.99 ± 9,167.40c |
| Autumn | 508 | 3.89 ± 0.03c | 3.19 ± 0.01 a | 11.37 ± 0.05 a | 4.33 ± 0.02ab | 199,711.00 ± 6,518.58a |
| Lactation number | NS | ** | ** | ** | ** | |
| 1 | 279 | 3.72 ± 0.04 a | 3.31 ± 0.02c | 11.78 ± 0.06c | 4.51 ± 0.02d | 185,468.32 ± 13,235.68a |
| 2 | 367 | 3.69 ± 0.03 a | 3.18 ± 0.02ab | 11.39 ± 0.05b | 4.35 ± 0.02c | 210,707.06 ± 7,898.99ab |
| 3 | 400 | 3.80 ± 0.03 a | 3.17 ± 0.01ab | 11.30 ± 0.05ab | 4.28 ± 0.02abc | 226,615.05 ± 7,546.44abc |
| 4 | 213 | 3.70 ± 0.04 a | 3.10 ± 0.02a | 11.04 ± 0.06a | 4.20 ± 0.02a | 250,654.18 ± 10,716.77bcd |
| 5 | 133 | 3.74 ± 0.05 a | 3.13 ± 0.03a | 11.15 ± 0.09ab | 4.24 ± 0.03ab | 278,076.54 ± 15,401.94d |
| 6 | 55 | 3.88 ± 0.08 a | 3.16 ± 0.04ab | 11.36 ± 0.13b | 4.30 ± 0.04bc | 228,090.91 ± 14,978.54abc |
| 7+ | 43 | 3.77 ± 0.09 a | 3.22 ± 0.04b | 11.29 ± 0.15ab | 4.24 ± 0.05ab | 264,302.33 ± 21,308.18cd |
| Animal age (months) | ** | ** | ** | ** | ** | |
| 24-36 | 31 | 3.76 ± 0.13b | 3.43 ± 0.06c | 12.20 ± 0.17d | 4.64 ± 0.07d | 274,451.61 ± 55,247.65b |
| 37-48 | 277 | 3.60 ± 0.03a | 3.31 ± 0.02b | 11.71 ± 0.06c | 4.49 ± 0.02c | 176,780.36 ± 13,119.01a |
| 49-60 | 229 | 3.70 ± 0.03ab | 3.17 ± 0.02a | 11.49 ± 0.06bc | 4.37 ± 0.02bc | 214,898.38 ± 8,934.86ab |
| 61-72 | 365 | 3.84 ± 0.03b | 3.16 ± 0.02a | 11.30 ± 0.06ab | 4.29 ± 0.02ab | 216,177.26 ± 75,59.11ab |
| 73-84 | 236 | 3.73 ± 0.03ab | 3.14 ± 0.02a | 11.14 ± 0.06a | 4.22 ± 0.02a | 249,793.81 ± 10,483.25bc |
| 85-96 | 163 | 3.73 ± 0.05ab | 3.11 ± 0.02a | 11.10 ± 0.08a | 4.21 ± 0.02a | 247,558.22 ± 11,371.27bc |
| 97≤ | 189 | 3.79 ± 0.05b | 3.16 ± 0.02a | 11.20 ± 0.07a | 4.24 ± 0.02a | 260,049.77 ± 4,404.63bc |
NS: Not significant (p>0.05), *: Significant at the level of p<0.05, **: Significant at the level of p<0.01.
Different superscript letters (a, b, c, d) within the same column indicate significant difference between means.
N: Sample size, SD: Standard deviation, X: Least square mean, SE: Standard error, F: Fat (%), P: Protein (%), DM: Dry matter (%), L: Lactose (%), U: Urea (mg/dL), SCC: Somatic cell count (cells/mL).
Table 3 Least square means for milk yield characteristics and urea according to factors.
| LMY | 305-d MY | U | PDMY | |||||
|---|---|---|---|---|---|---|---|---|
| Factors | N | X ± SE | X ± SE | N | X ± SE | N | X ± SE | |
| Herd size (head) | 974 | ** | ** | 1,133 | ** | 5,118 | ** | |
| <51 | 121 | 7,025.08 ± 189.91b | 6,409.88 ± 400.80a | 387 | 19.28 ± 0.40a | 601 | 28.48 ± 0.29a | |
| 51-100 | 65 | 6,835.49 ± 256.47ab | 5,550.38 ± 507.32a | 206 | 19.74 ± 0.56a | 292 | 29.91 ± 0.38b | |
| 101-500 | 252 | 8,856.00 ± 179.54b | 6,895.01 ± 330.04b | 260 | 18,87 ± 0.49a | 751 | 37.00 ± 0.39d | |
| 501-1000 | 233 | 10,025.80 ± 207.28c | 8,646.33 ± 372.05c | 86 | 23.26 ± 1.60b | 1,291 | 35.91 ± 0.30d | |
| >1000 | 303 | 8,099.88 ± 123.28a | 6,694.55 ± 278.94b | 194 | 30.97 ± 0.42c | 2,183 | 33.21 ± 0.18c | |
| Calving Season | 974 | ** | ** | 1,133 | ** | 5,118 | ** | |
| Winter | 169 | 7,897.63 ± 238.71a | 8,099.88 ± 123.28a | 225 | 20.85 ± 0.55b | 1,392 | 34.72 ± 0.24c | |
| Spring | 89 | 7,958.00 ± 297.82a | 7,805.09 ± 645.36c | 169 | 19.00 ± 0.53a | 990 | 33.76 ± 0.31b | |
| Summer | 258 | 8,288.53 ± 157.59a | 7,051.88 ± 330.45bc | 351 | 20.83 ± 0.52b | 1,246 | 32.03 ± 0.25a | |
| Autumn | 458 | 9,028.22 ± 128.01b | 6,367.45 ± 243.22b | 388 | 23.78 ± 0.52c | 1,490 | 34.11 ± 0.27bc | |
| Lactation Number | 974 | NS | NS | 1,133 | * | 5,106 | ** | |
| 1 | 399 | 8,616.64 ± 116.57 a | 6,818.04 ± 258.74 a | 180 | 18.64 ± 0.47a | 1,843 | 31.73 ± 0.21b | |
| 2 | 212 | 8,372.86 ± 200.14 a | 6,437.45 ± 367.64 a | 259 | 22.76 ± 0.61b | 1,318 | 34.76 ± 0.25cd | |
| 3 | 229 | 8,798.81 ± 225.71 a | 6,221.88 ± 372.27 a | 322 | 22.33 ± 0.56b | 1,078 | 35.95 ± 0.33d | |
| 4 | 84 | 8,346.35 ± 331.50 a | 6,361.38 ± 541.44 a | 175 | 21.41 ± 0.75ab | 499 | 34.79 ± 0.45cd | |
| 5 | 29 | 7,756.93 ± 323.61 a | 5,278.45 ± 840.34 a | 112 | 21.53 ± 0.83ab | 218 | 32.33 ± 0.62b | |
| 6 | 11 | 8,567.55 ± 759.31 a | 5,964.36 ± 1,440.28 a | 45 | 21.98 ± 1.52b | 87 | 32.82 ± 0.89bc | |
| 7≤. | 10 | 6,802.8 ± 412.61 a | 4,796.90 ± 1,336.07 a | 40 | 21.29 ± 1.60ab | 63 | 29.44 ± 0.87a | |
| Animal Age (months) | 974 | ** | * | 1,133 | ** | 5,112 | ** | |
| 24-36 | 54 | 8,653.34 ± 402.36b | 6,534.51 ± 597.89b | 14 | 16.61 ± 1.14a | 593 | 31.67 ± 0.32a | |
| 37-48 | 312 | 8,578.20 ± 124.36b | 6,905.61 ± 389.71b | 151 | 19.00 ± 0.52ab | 1,371 | 33.29 ± 0.25b | |
| 49-60 | 165 | 8,625.95 ± 237.12b | 6,874.28 ± 439.37b | 177 | 20.27 ± 0.63bc | 948 | 33.63 ± 0.32b | |
| 61-72 | 212 | 9,007.64 ± 212.01b | 6,574.12 ± 431.80b | 283 | 23.61 ± 0.61c | 899 | 36.20 ± 0.34c | |
| 73-84 | 120 | 8,599.79 ± 297.49b | 6,220.31 ± 523.49b | 199 | 22.57 ± 0.71bc | 611 | 35.35 ± 0.42c | |
| 85-96 | 60 | 7,065.30 ± 380.29a | 3,832.65 ± 552.25a | 143 | 21.51 ± 0.88bc | 327 | 32.10 ± 0.49a | |
| 97≤ | 51 | 7,497.41 ± 218.68a | 6,054.20 ± 615.96b | 166 | 20.97 ± 0.70bc | 363 | 31.31 ± 0.46a | |
NS: Not significant (p>0.05), *: Significant at the level of p<0.05. **: Significant at the level of p<0.01.
Different superscript letters (a, b, c, d) within the same column indicate significant difference between means.
N: Sample size, X: Least square mean, SE: Standard error, LMY: Lactation milk yield (kg), 305-d MY: 305-day milk yield (kg), PDMY: Peak-day milk yield (kg), U: Urea (mg/dL).
Although the F component had the highest value in the mid-lactation stage (91-180 days), it showed the lowest in the second late lactation stage (270 days≥). Difference between lactation stages in terms of the F component was statistically significant (p<0.01). However, while the P component presented the highest value within the first late lactation stage (181-270 days), it showed the lowest value during mid-lactation (91-180 days). The difference between lactation stages in terms of the P component was significant (p<0.05) (Table 4).
For DM and L components, the highest values were observed within the first stages of late lactation (181-270 days) and the first stages of early lactation (<45 days), respectively. However, the lowest values were determined in the second early lactation (46-90 days) and mid-lactation (91-180 days) stages for the DM component as well as in the second late lactation stage for the L component. Differences between lactation stages were not statistically significant for DM (p=0.065) nor L components (p=0.111) (Table 4).
The U component had the highest value in the middle stage of lactation (91-180 days) although the lowest value was seen in Log10SCC within the same stage. However, during the first late lactation stage (181-270 days), Log10SCC had the highest value, while the U component had the lowest value. Differences between lactation stages for Log10SCC and U components were statistically significant (p<0.01) (Table 4).
Table 4 Least square means of raw milk components according to lactation stage.
| F | P | DM | L | Log10SCC | U | ||
|---|---|---|---|---|---|---|---|
| Parameters | N | X ± SE | X ± SE | X ± SE | X ± SE | X ± SE | X ± SE |
| Lactation Stage | ** | * | NS | NS | ** | ** | |
| 1st Early (≤ 45) | 91 | 3.67 ± 0.06ab | 3.20 ± 0.03b | 11.49 ± 0.11a | 4.37 ± 0.04a | 5.22 ± 0.04a | 21.43 ± 1.32a |
| 2nd Early (46-90) | 188 | 3.76 ± 0.04b | 3.17 ± 0.02ab | 11.29 ± 0.07a | 4.34 ± 0.03a | 5.24 ± 0.02ab | 23.72 ± 0.82b |
| Mid (91-180) | 346 | 3.93 ± 0.03c | 3.13 ± 0.02a | 11.29 ± 0.06a | 4.32 ± 0.02a | 5.18 ± 0.02a | 25.31 ± 0.62b |
| 1st Late (181-270) | 285 | 3.78 ± 0.03b | 3.22 ± 0.02b | 11.50 ± 0.06a | 4.36 ± 0.02a | 5.28 ± 0.02b | 19.27 ± 0.57a |
| 2nd Late (270≥) | 580 | 3.62 ± 0.02a | 3.20 ± 0.01b | 11.35 ± 0.04a | 4.30 ± 0.01a | 5.27 ± 0.01b | 19.67 ± 0.39a |
| Overall | 1,490 | 3.74 ± 0.01 | 3.19 ± 0.01 | 11.36 ± 0.03 | 4.32 ± 0.01 | 5.24 ± 0.01 | 21.57 ± 0.28 |
NS: Not significant (p>0.05), *: Significant at the level of p<0.05, **: Significant at the level of p<0.01.
Different superscript letters (a, b, c, d) within the same column indicate significant difference between means.
N: Sample size, X: Least square mean, SE: Standard error, F: Fat (%), P: Protein (%), DM: Dry matter (%), L: Lactose (%), U: Urea (mg/dL), Log10SCC: Value based on log10 for somatic cell count.
A positive, significant (p<0.01) and strong relationship between DM and L content was observed in the present study. Additionally, there was a positive, significant (p<0.01) and moderate relationship between P and L contents between 305-d-MY and PDMY, and between DM and P contents. However, significant and negative correlations were found between SCC and all the traits, except for the P component. The direction of the relationship between SCC and P was positive, whereas it was negative with the other traits (PDMY, F, DM, L, U) (Table 5).
Table 5 Phenotypic correlations between milk yield, milk components, and SCC.
| Characteristic | PDMY | F | P | DM | L | U | SCC | LMY |
| PDMY | 1 | |||||||
| F | 0.078** | 1 | ||||||
| P | 0.191** | 0.051* | 1 | |||||
| DM | 0.232** | 0.379** | 0.678** | 1 | ||||
| L | 0.301** | 0.182** | 0.585** | 0.841** | 1 | |||
| U | 0.131** | 0.256** | 0.094** | -0.147** | -0.136** | 1 | ||
| SCC | -0.207** | -0.127** | 0.096** | -0.064* | -0.143** | -0.104** | 1 | |
| LMY | 0.340** | -0.063 | 0.110* | 0.084 | 0.149** | 0.050 | 0.046 | 1 |
| 305-d MY | 0.648** | 0.046 | 0.218** | 0.247** | 0.289** | 0.153** | -0.043 | 0.443** |
*: Significant at the level of p<0.05, **: Significant at the level of p<0.01.
F: Fat, P: Protein, DM: Dry matter, L: Lactose, U: Urea, SCC: Somatic cell count, PDMY: Peak-day milk yield, LMY: Lactation milk yield, 305-d MY: 305-day milk yield.
r<0.3 none or very weak, 0.3<r<0.5 weak, 0.5<r<0.7 moderate, and 0.7 < r strong correlations.
Discussion
The mean F was 3.74 ± 0.01% (Table 1). In previous studies, Hanus et al. (2010), Czajkowska et al. (2014), Suàrez et al. (2016), and Kul et al. (2019) found mean F was 4.06, 3.73, 4.17, and 3.39, respectively. Önal et al. (2021) reported that the lowest F by season was 3.44 ± 0.058% in autumn and 3.72 ± 0.048% in summer. Visentin et al. (2018) found that milk yield averaged 22.74 kg/d and mean F was 4.03 ± 0.61%. On the other hand, El-Tarabany et al. (2018) reported that F was 3.44% for Holstein-Friesian cows, while Boujenane (2021) reported that average F was 3.54 ± 0.76%. Marshall et al. (2020) also found that F was 5.12 and 6.52%, in early and late lactation periods, respectively. In addition, while F in raw milk was affected by herd size, calving season, and animal age, it was not affected by lactation number. The F component in raw milk increased for <51, 51-100, and 101-500 herd sizes (3.60 ± 0.02, 3.69 ± 0.03, 3.76 ± 0.03, respectively). A decrease in F was observed for herd sizes of 501-1,000 head (3.56 ± 0.05%). The highest F component was obtained for herd size greater than 1,000 heads (4.29 ± 0.03%).
The lowest F occurred during spring (3.58 ± 0.03%) and increased during summer, autumn, and winter (3.64 ± 0.02, 3.89 ± 0.03, and 3.76 ± 0.03%, respectively). This difference is likely related to sufficiency of roughage stocks in the farms. The values obtained for summer and autumn differ from the results (3.72 ± 0.06, and 3.44 ± 0.06%, respectively) reported by Önal et al. (2021).
The P component was 3.19 ± 0.01% (Table 1). In a similar study, mean P was 3.28%, ranging from 3.19 to 3.33% (Aydin et al., 2010). In other studies, P was 3.43, 3.53, 3.66, and 3.37% (Suàrez et al., 2016; Visentin et al., 2018; El-Tarabany et al., 2018; and Czajkowska et al., 2014; respectively). In addition, Marshall et al. (2020) and Boujenane (2021) reported that mean P was 3.02 ± 0.34%. Sarıalioğlu and Laçin (2021) reported that P in family dairy farms and modern dairy farms was 3.49 ± 0.07 and 3.45 ± 0.01%, respectively. Önal et al. (2021) reported that the highest P for winter was 3.46 ± 0.031.
The P component in raw milk increased as herd size increased to 1,000. For herd sizes greater than 1,000, the P level in milk decreased. Accordingly, P fluctuated depending on lactation number and animal age, rather than steady increasing or decreasing.
Önal et al. (2021) reported that the highest milk DM (13.50% ± 0.103) was observed during spring. Suàrez et al. (2016), El-Tarabany et al. (2018), and Czajkowska et al. (2014) found 13.16, 12.80, and 12.61% DM, respectively. In contrast, Boujenane (2021) reported that mean DM was 8.72 ± 0.36%. Another study found DM in family and modern dairy farms to be 9.64 ± 0.21 and 9.52 ± 0.05%, respectively (Sarialioğlu and Laçin, 2021). Changes in DM in terms of herd size, lactation number, and animal age was consistent with changes in protein rates. Therefore, fluctuations in DM may have been due to differences in feeding levels among farms, which is similar to protein rate.
The mean L component of milk was 4.32 ± 0.01% (Table 1). Ayaşan et al. (2011) found L between 4.15 ± 0.06 and 4.34 ± 0.06%. Flipejova and Kovacik (2009) reported that milk L ranged from 4.02 to 4.99 with a mean value of 4.59, and El-Tarabany et al. (2018) found mean L was 4.94%. In addition, Czajkowska et al. (2014) found it to be 4.89 ± 0.21%, and Boujenane (2021) reported that mean L was 4.89 ± 0.24%. Moreover, Marshall et al. (2020) found L in the early and late lactation periods to be 5.04 and 4.81%, respectively. It is known that L is not markedly affected by feeding. In terms of herd size, the L trend was similar to that of P and DM. The L in milk decreased as animal age increased. In terms of seasons, the lowest (4.29 ± 0.02%) and highest (4.36 ± 0.02%) L percentages were observed in winter and spring, respectively.
The mean SCC value (224,164.32 ± 4,401.80 cells/mL) was lower than that reported by Flipejova and Kovacik (2009), and Suàrez et al. (2016) (1,525,400 and 523,207 cells/mL, respectively), but it was in line with the value observed by Gürbulak et al. (2009) (226,800 ± 4,200 cells/mL).
Eyduran et al. (2005) reported that lactation number and months had an effect on SCC in milk from Holstein-Friesian cows, and mean SCC for August and November was 1,311,761 ± 239,631 and 732,810 ± 146,264 cells/mL, respectively.
Böcekli (2015) assessed the effect of SCC on milk yield, reporting that <200,000, 201,000-500,000, and >501,000 cells/mL had a significant effect on milk yield, with 28.75, 27.48, and 26.78 kg, respectively.
In a similar study, the highest SCC values occurred during the summer months (Aytekin and Boztepe, 2014). In a study conducted by Önal et al. (2021), it was shown that lactation number and season affected SCC. The authors found that the highest SCC occurred during the 4th lactation (928.30 ± 117.93 x10³ cell/mL) and milk with the lowest SCC occurred during the 1st lactation (356.47 ± 50.55 x10³ cell/mL). They also showed that SCC values descended from 1,003.88 ± 83.53, 877.63 ± 97.43, 575.81 ± 63.97, and 212.36 ± 17.94 x10³ cell/mL for winter, spring, autumn, and summer, respectively (Önal et al., 2021). Sarialioğlu and Laçin (2021) also reported that mean SCC in milk samples were 4.23±0.19 and 3.79±0.16 Log10 for family and modern dairy farms, respectively.
The SCC decreased with increasing herd size. This result is thought to be related to investments in modernization and automation. The highest seasonal SCC values were observed in the summer and winter seasons, respectively. This result might be caused by high temperatures during the summer and high humidity in winter, related with unfavorable barn conditions.
When examining herd records and feed profile of dairy farms, the nitrogen value of milk (U) is used as the standard method since it provides a practical approach for measurement and evaluation (Roy et al., 2011). In the present study, the U value was 21.57±0.28 mg/dL. In addition, U was significantly affected by lactation stage (Table 4), calving season, and lactation number (p<0.01), but it was not affected by animal age (Table 3).
Milk urea nitrogen varies according to several factors. If milk protein is 3.0 and 3.2%, then milk urea nitrogen varies between 12 and 16 mg/dL; since as P increases, urea nitrogen decreases. This is because more nitrogen consumption is used for milk protein (Abdouli et al. 2008).
Depatie (2000) reported that SCC did not affect milk urea nitrogen. On the other hand, Kwai-Hang et al. (1985) stated that increased SCC increased milk urea nitrogen. Other studies have reported that milk urea nitrogen is low in milk with excess SCC. In those studies, milk urea concentration had a positive relationship with milk yield and a negative relationship with milk F levels (Faust et al., 1997).
Abdouli et al. (2008) reported that milk urea nitrogen of cows bred under Mediterranean conditions was 30.39 mg/dL, while this value was 20.43-32.49, 11.15, 12.7-13.9, 20.64, and 11.75 mg/dL (Frank and Swensson, 2002; Arunvipas et al., 2008; Meeske et al., 2009; Czajkowska et al., 2014; and Zhang et al., 2018; respectively).Marshall et al. (2020) also found that U during the early and late lactation periods was 18.60 and 16.10 mg/dL, respectively. In contrast, Boujenane (2021) found mean U was 17.6 ± 8.17 mg/dL.
The overall mean value (21.57 ± 0.28 mg/dL) obtained in the present study was above the accepted upper limit for milk urea nitrogen (14 mg/dL). The mean U values were high for herds with 501-1,000 and >1,000 heads (23.26 ± 1.60 and 30.97 ± 0.42 mg/dL, respectively). This might be due to the use of high protein mixed feeds for obtaining high milk yields per cow.
Mean PDMY, LMY, and 305-day MY values in the present study were 33.70 ± 0.14, 8,538.33 ± 89.64, and 6,479.42 ± 168.96 kg, respectively. The effects of calving season on PDMY, LMY, and 305-day MY were significant (p<0.01; Table 3). The effect of lactation number on PDMY was not significant, while its effect on LMY and 305-day MY was significant (p<0.01; Table 3). The effect of cow age on PDMY and LMY was also significant (p<0.01; Table 3).
In the present study, LMY was 8,538.33 ± 89.64 kg. In previous studies, LMY means were 5,929 ± 23, 7,700.02 ± 99.17, 4,716.1 ± 243, 3,032.41 ± 66.78, 5,720.00 ± 43.6, and 4,726.12 kg (Bakır and Kaygısız, 2013; Yıldırım et al., 2018; Gamaniel et al., 2019; Kidane et al., 2019; McClearn et al., 2020; and Sanad et al., 2021; respectively). Thus, the present study found higher LMY compared to all the mentioned studies.
In the present study, the 305-day MY value was 6,479.42 ± 168.96 kg. In similar studies conducted in Holstein-Friesian cows this value was 5,523 ± 27, 8,246 ± 1,194.6, 9,435 ± 156.12, 7,923.28 ± 80.92, 6,197.88 ± 1,681.35, and 8,369.72 kg (Bakır and Kaygısız, 2013; Van Eetvelde et al., 2017; Duru, 2018; Yıldırım et al., 2018; Tutkun and Yener, 2018; and Habib et al., 2020; respectively). Although LMY in the present study was higher than values reported by Bakır and Kaygısız (2013) and Tutkun and Yener (2018), it was lower than the values found by Van Eetvelde et al. (2017), Duru (2018) and Yıldırım et al. (2018). Since the mean of the lactation period is different for each herd, the 305-day MY is used instead of LMY to compare milk yield among herds. Accordingly, the differences observed for 305-day MY are thought to be due to herd genetics, environment in which they were raised, and different feeding plans.
In the present study, mean PDMY (33.70 ± 0.14 kg in Holstein-Friesian cows) was lower than those found by Sönmez et al. (2018; 35.00 ± 0.50) and Castaño et al. (2020; 39.77), but higher than values reported by Serkan et al. (2013; 30.81 ± 0.83), Yılmaz and Kaygısız (2000; 21.5 ± 0.60), Abosaq et al. (2017; 22.79) and Ghavi and Zadeh (2019; 31.31). In terms of milk yield, the 305-d MY was used as a basis for comparison since lactation periods showed variation among cows. Accordingly, milk yield in herd size between 101 and 1,000 heads was higher than in herds below 100 heads and above 1,000 heads. In terms of season, the lowest 305-d MY was found throughout autumn, and the highest during winter. This situation is associated with increase in winter and spring calving and increased roughage and concentrate feed based on Türkiye climate. Although there were fluctuations in the 305-d MY values of lactation number and age groups, a decreasing trend was observed in the 305-d MY due to increased lactation number and age.
While F and U ratios increased during early lactation (1-90 days), the P ratio decreased. During mid-lactation (days 91-180) F and U ratios reached their highest values, while the P ratio saw its lowest levels. For late lactation (>181 days) the F and U ratios decreased, while the P ratio increased. Due to the use of body fat reserves throughout the early lactation period and the increase in the amount of feed according to increased milk yield, the fat rate increased until the end of the mid-lactation period.
Unlike fat, protein is not markedly affected by feeding, but has a negative relationship with milk yield. For this reason, protein is at the lowest level during mid-lactation when milk yield is at the highest. However, protein in early and late lactation stages is higher than in the mid-lactation period.
Although SCC decreased during mid-lactation, it increased in early and late lactation. This might result from the increase in epithelial cell loss of with as lactation period progresses and mastitis during the dry period before early lactation.
The U component in milk was at the highest level in mid-lactation and it was lower during the early and late lactation periods. This is due to increased offer of concentrated feed as milk yield increases, as well as change in protein and energy content of the feed. The U levels were very high during all lactation stages considering that accepted U in raw milk is 10-14 mg/dL.
In conclusion, the effects of calving season on 305-day MY, LMY, PDMY, U, L, F, and SCC; the effect of lactation number on PDMY, P, DM, L, and SCC; and the effect of animal age and herd size on LMY, 305-day-old MY, PDMY, and all milk components were statistically significant.
Although dairy farmers in this study are conscious of milk yield and milk quality, they nevertheless need to take measures to improve P, DM, and U components of milk. In addition, based on these results, detailed research should be conducted on subclinical mastitis as well as the relationship between MUN and reproduction in dairy farms in Türkiye.

