


Services on Demand
Journal
Article
 text in
  Spanish (pdf)
 Article in xml format
 Article references
 Send this article by e-mail
Indicators
-
 Cited by SciELO
 -
 Access statistics
Related links
-
 Cited by Google
 -
 Similars in
SciELO
Similars in
SciELO -
 Similars in Google
Share

 Permalink
Ingeniería e Investigación
Print version ISSN 0120-5609
Ing. Investig. vol.30 no.2 Bogotá May/Aug. 2010
The consequences of heavy-tailed service time distribution on a basic queuing model and its performance indicators
Lina Rangel Martínez1 and Jorge A. Alvarado valencia2
1 Industrial Engineer. Professor, School of engineering, Departament of industrial engineering, Pontificia Universidad Javeriana, Bogotá, Colombia. lrangel@javeriana.edu.co 2 Industrial Engineer. M. Sc., en Analytics. Assistant Professor, Departament of industrial engineering, Departament of industrial engineering, Pontificia Universidad Javeriana, Bogotá, Colombia. jorge.alvarado@javeriana.edu.co
Abstract:
Recent research showing theoretical generative models for heavy-tailed service time queues and its empirical validation implies the need for a better knowledge of the key performance indicators' behaviour under such assumption. The behaviour of the average length of the queue (Lp) and the average waiting-time (Wp)were analysed through simulation, varying system capacity, average service utilisation factor (r) and the number of servers in the systems as parameters. Comparisons were also made with service times based on Poisson processes. The results showed more sensitive variations Lqand Wq heavy-tailed service times than for Poisson-based service times. Systems having a capacity of over 1,000 entities might be considered as being systems having infinity capacity and the number of servers has a greater importance in heavy-tailed ruled processes than in Poisson processes. There was a lack adequacy Lqand Wq as key performance indicators for heavy-tailed service times, leading to unexpected and unstable results.
Key words: queuing system, heavy-tailed distribution, service time, Pareto distribution, generative model.
Received: jun 26th 2009
Accepted: jun 10th 2010
Introduction
Recent empirical evidence has suggested that some of the probability distributions in service time queues do not exhibit exponential tails; therefore, attaining extreme values for service times ceases to be unlikely (Stidham, 2002).
Some empirical examples of the appearance of this type of distribution are processing of and replying to e-mails (Barabási, 2005), waiting time at an automotive repair shop (Alvarado et al., 2008) and the transmittal time of a file in telecommunications (Mitzenmacher, 2004).
Two theoretical models have been proposed for explaining this case. The first has suggested that the size of the job in the queue to be processed is a random variable with no exponential tail (such is the case of telecommunication files), the processing time of this job will consequently have no exponential tails (Willinger,1995). The second proposes that a phenomenon called perceived priorities is created when the server is a human being using his/her personal criteria to select the order of job completion (and there are no human beings physically in queue). This leads to the lengthy postponement of the processing time of a job which has already reached the server and, consequently, services times will have no exponential tails (Barabási, 2005; Alvarado et al., 2008). Deduced from the foregoing is the existence of an important set of phenomena which could be more accurately modelled by distributions having non-exponential tails.
Distributions having non-exponential tails
are often called heavy-tailed, though the term has been somewhat confused in the literature (Embrechts et al., 1997; Mitzenmacher, 2004). This article will adhere to the following definition which clearly expresses the non-exponential nature of the tail. Given a non-negative, random variable X and its cumulative distribution function  and its cumulative complimentary function, or tail,
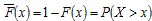 ,
, a distribution function for random variable X is called heavy-tailed if
,
, a distribution function for random variable X is called heavy-tailed if , and
, and 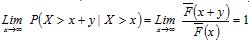 for y≥0 (Sigman, 1999, pp. 261-262). In dissimilarity, the exponential tail's behaviour is lim
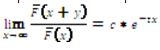 and t being constants.
Weibull distributions (in reliability engineering) and Pareto (in financial analysis) are extensively recognised in heavy-tailed distribution sets.
One of the major challenges for most heavy-tailed distributions in queuing analysis is the non convergence of the medianvariance framework. Without the fulfilling the median values and finite variance assumptions, the standard tail theory results for Cohen's M/G/1/FIFO/ ∝ /∝ model (Cohen, 1973, pp. 343-353) and Pakes (Pakes, 1975, pp. 555-564) are not valid. Given the mathematical difficulty of heavy-tailed distributions, there are no known closed-form solutions for queuing models having heavy-tailed service times. Not until recent years did Whitt (Whitt, 2000, pp. 71-87) demonstrate that if a service time has a heavy-tailed distribution probability, then the length of the queue and waiting time will also have a heavy-tailed distribution, with higher or lower datum for these values under certain parameters. The result is only valid for M/G/1/FIFO/ ∝ /∝ systems. Based on this case history, this research was aimed at numerically simulating the behaviour of a queuing model where service time is controlled by heavy-tailed distribution in diverse system capacity conditions, use and number of servers to examine the variation of the values of its performance indicators and the viability of these measurements (average length of the queue and average length of the queue Lqand average waiting-time Wq ).
To facilitate this, the results were evaluated against those obtained for the classic queuing model with service times based on Poisson processes.
Experimental development
This experiment simulated discreet events, which is a viable alternative when an exploratory analysis of the model is desired in the absence of approximations or closed results for a queuing system (Neuts, 1998; Stewart, 1994; Gross, 2009). The systematic evaluation of factor variations influencing a phenomenon, evaluated in a controlled experiment (i.e. simulation), is efficiently completed through a statistical experimental design (Kuehl, 2001).
Experimental design
Among the analysis factors which traditional queuing theories consider fundamental, the distribution of service-times, system capabilities, utilisation level and server quantity were selected for this study. The queuing discipline was not considered since it was deemed implicit in the model of perceived priorities explained in the introduction regarding heavy-tailed service times. The number of potential clients the system might have was left as an infinite value since making it finite would only limit and mask the effect that heavy-tailed distribution would have on the length of the queue and waiting time. Regarding arrival time probability distribution, a Poisson process was used to increase the comparability of the results with the closed equations of traditional queuing theories. The factors and levels defined generated a mixed model containing three permanent, constant factors and one random one (the distribution parameters); this combination allowed for 1,575 possible treatments. Given that computational capabilities were not a limitation, a complete factorial experiment was performed; this allowed for the broadest possible exploratory analysis.
Service-time probability distribution parameters
Because it is most often used and is the most popular of distributions, and because its mean and its variance may or may not converge depending on the values of its parameters, the Pareto distribution was selected as exemplary of heavy-tailed distributions. This very important property allowed for a broader exploration of the effects of heavy-tailed distributions (Andriani and McKelvey, 2005, pp. 219-223). The Pareto distribution has the following probability distribution:
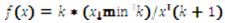 being
being
Xmin being a location parameter (minimum to the function) and k the shape parameter. Its value determines whether both the median and the variance converge; within the (0,1]range both the median and the variance diverge, in the(1,2] the median diverges but not the variance and in the(2,∝) both values converge (Mitzenmacher, 2004, pp. 228).
Equally, the higher the value of k, the higher the Pareto densities will be around the minimum, that is, less disperse densities (Newman, 2005, pp. 325-327). The probability function fulfils the non-exponential tail condition, since its tail is regimented by the following expression
Pr (X>x)=(x/xm)x
The focus was centred on determining whether important Lq and Wq variations existed which were associated with median and variance conversions of a heavy-tailed distribution. Three interested intervals were generated in the Pareto distribution; from each, a point representative of each of the investigation's levels of interest was randomly selected, as explained below.
A relationship was established between exponential distribution (Poisson process) and the Pareto distribution so that one of its main trend measurements (other than the median) was equal. The mean was used as it is a strong main trend measurement. Exponential distribution mean being b*lim(2) (Ross, 2006, pp. 419) and Pareto distribution mean Xminx√2 (Janicki and Simpson, 2005, pp. 294), the following comparison was made:
b*lim(2)-Xminx√2
From where the following comparison equation was obtained:
k=ln (2*Xmin/ b*ln (2))
Secondly, a fixed average service rate having unitary value µ was established for the entire system, therefore b=1/µ = 1. Thirdly, parameters were established from Pareto distribution convergence ranges and the comparison equation convergence ranges based on Xmin.
Lastly, a random number was created within eachX min convergence range and these three values were set as random levels for the parameter factor of service time distribution, obtaining values for k based on the comparison equation.
Number of servers
Variations ranging from 1 to 15 servers were performed, using the assumption presented in Hillier and Lieberman regarding models having no Poisson input (Hillier and Lieberman, 2005. pp. 802). Based on these, the levels selected were 1,2,3,5,7,10 and 15 servers.
System capacity
The system's capacity may be considered as finite or infinite. Methodologies were transferred from other sciences like neuroscience and physics to determine factor levels, their range domain and observation scales varying by powers of 10. Based on this, the levels of finite capacity varied from 10 entities (101) for a small system, up to 10,000 entities (104). All powers over five were considered, for practical purposes, included within the category of services without limited capacity.
Average service use ( ρ factor)
The values of this factor were altered within a range of (0, 1) to unlock the possibility of reaching the rate stability state.
A steady jump of 0.2 in the determined range was recognised, obtaining five levels for this factor.
Simulation
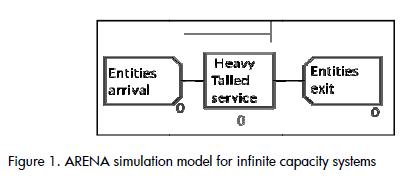
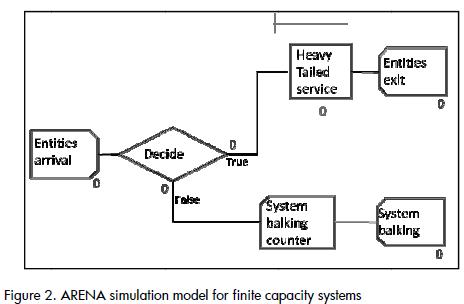
Every queuing model is represend through three basic scenarios: an entity generating source which represents input into the system, a group of servers which service the entities forming the queues and an output to dismiss the entities once they have been serviced. The simulation models were created bearing in mind this structure ((Figure 1) . A validation mechanism was added to this structure which was related to the system's capacity to restrict the entrance to additional entities once it had filled (Figure 2).
No literature was available for estimating the minimum sample size required for an experiment having three constant factors, each having a different number of levels and one random factor. The complexity of determining a suitable sample size when random factors are present is well known (Montgomery, 2008). It was determined that the highest number of replications allowed by time and computational capacity would be carried out. It was assumed that ten thousand replications for each of the 1,575 treatments would provide results having an adequate safety margin because sample sizes for designs with four constant factors do not exceed a thousand units in asymptotical cases (Kuehl, 2001).
The duration of each replication represented a month of continuous work in a factory setting, meaning 30, 24 hour days, a total of 720 hours/month. This value was rounded up to 1,000 hours/replication seeking more precision in the experiment.
Results
Evaluating the results produced by variance analysis ascertained the existence of differences between factor medians.
Significant interactions were established (p<0.001) between the factors listed below. Secondary interactions were found between capacity and number of servers, capacity and utilisation level and the number of servers and utilisation level. The interaction of a third level was found between capacity, servers, utilisation level and Pareto distribution parameters.
The investigation for identifying the sense of the interactions was descriptive, provided the interaction was significant from a statistical point of view.
General variations in performance indicator
The assumption of service-time exponential distributions led to underestimating the true value of Lq and Wq if in fact the process presented heavy-tailed service-times. For example, for a finite capacity queuing system, the maximum average value reached for Lq system (a 345% increase).
The maximum average value reached with finite capacity was 99 hours in the case of Wq whilst this value ascended to 273 hours with a heavy-tailed distribution in the same system conditions ( an175% increase).
Effects due to system capacity
When altering the available server quantities in a system and/or in its utilisation level, it was evident that the values of Lq did not vary in systems having capacities exceeding 100 entities when heavy-tailed service-times existed (i.e. systems having capabilities exceeding this value, with this distribution, may be considered to have infinite capacity, Figure 3).
This state also occurred with Wq but only when the utilisation factor was under 0.6. A lack of stability resulted above this value.
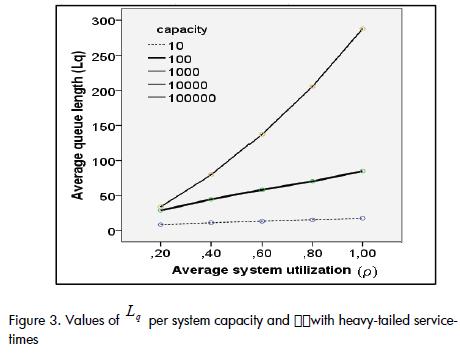
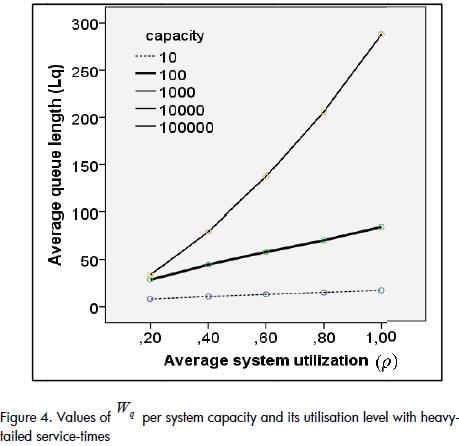
Figure 4 illustrates an almost linear growth tendency for Wq.
The change in Wq going from a ρ=0.2 system to one with a utilisation level very close to 1 was 22% for a capacity of 10 entities, while for an infinite capacity system this percentage was 194%.
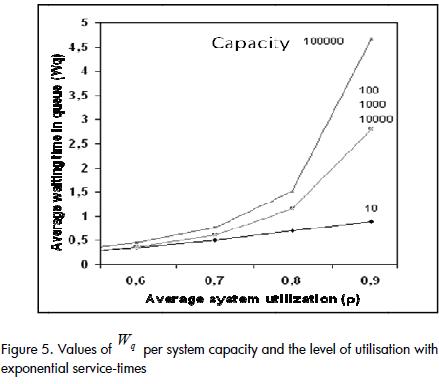
A contrary case occurred in systems having exponential service-times where a system with capacity for 10,000 entities could not be considered infinite, since Lq and Wq took on different values when faced with a system with 100,000 entities (Figure 5). The growth rate of Wq was greater than in heavy-tailed systems (compare Figures 4 and 5). However, the values for Lq and Wq in exponential systems were lower than in heavy-tailed systems.
Effects due to number of servers
When the number of servers in the system was increased using exponential distribution in service-times, the values of Lq were reduced except during high utilisation levels, where stability was lost. According to the theory, these were the expected results.
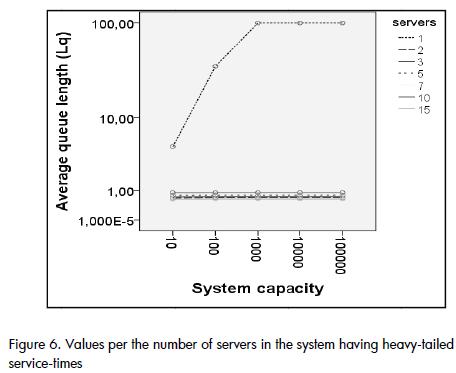
Atypical behaviour was observed in heavy-tailed distributions when there was only one server in the system (Figure 6); by simply increasing the number of servers to two, the value of Lq was greatly reduced and it did not vary when the utilisation level was increased. This would imply that the level of utilisation of the system is not as important as the number of servers available on it regarding heavy-tailed distributions.
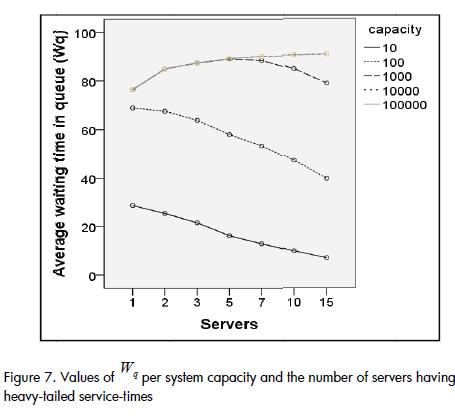
When capacities exceeded 1,000 entities in systems having heavy-tailed service-times, contrary to expectations, Wq did not consistently decrease with the increase of server quantity; instead it presented a counterintuitive pattern. As illustrated by Figure 7 the value of Wq became increased between one and five servers. Wq began to decrease with a capacity for 1,000 entities, and from five servers; the atypical increase of Wq continued for more than 1,000 entities. This atypical behaviour in heavy-tailed distributions may have been the consequence of the non-convergence of its median and/or variance for certain values.
Effects due to utilisation factor ρ
As the level of system utilisation increased, the increase of Lq and Wq accelerated, independently from service-time distribution, as anticipated. Variations in Lq and Wq became more apparent As ρ grew for greater capacities.
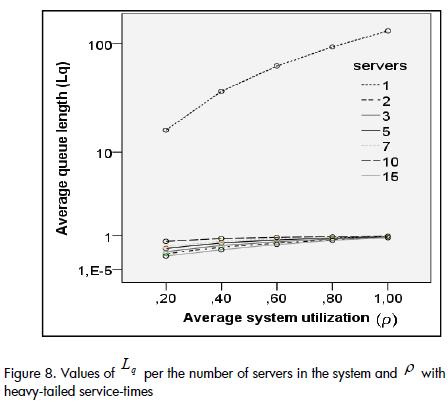
The values of lq became truly representative in systems having exponential service-times (i.e. greater than one entity, for levels exceeding 0.7, independently of the number of servers in the system and their capacity). Indicator variations were representative for heavy-tailed distribution systems and were greater than those obtained with exponential service-times, from a 0.2 utilisation level only when the system had only one server (Figure 8), similar to that presented in the previous section, which represented an atypical behaviour. The values and the variations of Lq were minimal from two servers and on, and were not significant.
It was established that as system capacity and utilisation levels increased, the system was not destabilised around a ρ=1 level for exponential service-time distributions, while this destabilization was still perceptible with heavy-tailed service-times. This confirmed that systems having exponential distributions were more predictable and yielded more reliable results with high levels of utilisation and capacities.
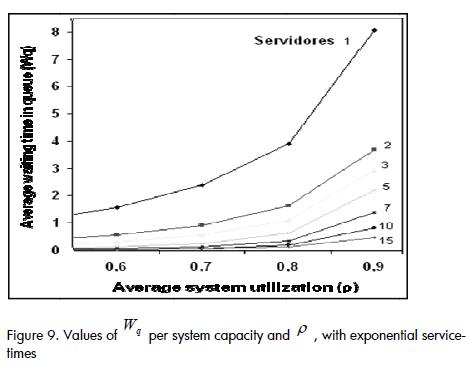
Variations of Wq as the level of system utilisation was increased from 0.2 to 1 decreased as the number of available servers in the system was increased, before becoming cancelled out at 15 servers (Figure 9).
This behaviour provided evidence that in systems having small capacities the entity's average waiting-time in queue before being served did not seem to depend on either the rate of entity arrivals into the system or service rate.
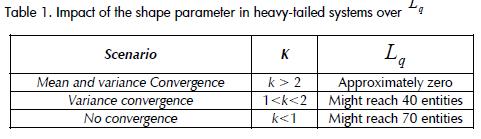
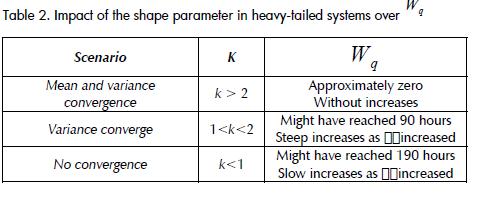
Effects due to distribution parameters
The greatest variation of and depended on the level of system utilisation of exponential service-times, more than the system capacity and the number of servers; meanwhile, for systems having heavy-tailed service-times, it was the (k) parameter which determined the magnitude of the variation (i.e. convergence of the median and/or variance) (Tables 1 and 2)
Conclusions
The investigation demonstrated that traditional queuing system performance indicators presented atypical and unstable behaviour when the distributions of service-times had a heavy-tailed behaviour. This may have been due to both the tendency of heavy-tailed distributions towards more frequently generate extreme values and the non-convergence of the median and/or the variance of the heavy-tailed distribution. It was thus concluded that the indicators based on averages, such as Lq> and Wq were not the most appropriate for measuring the performance of a queuing system when the distribution of service-times was heavy-tailed. Because theoretic generative models of heavy-tailed distributions in the introduction cover a broad range of real life situations, it is necessary for researchers to consider the possibility of the presence of heavy-tailed models when extreme values appear in samples, instead of simply finding an explanation for them and subsequently discarding them.
Future studies may explore new and stronger indicators for queuing systems and their service-times may be modelled with heavy-tailed variables.
Another key result of the investigation was the greater susceptibility of heavy-tailed distributions to parameter changes such as system capacity and the number of servers; this must be considered when making decisions regarding queuing systems having heavy-tailed service-times. The completion of a risk analysis during the decision-making process in these conditions is another means of investigation.
Appendix: nomenclature
Lq : Average length of the queue
Wq : Average in queue waiting time
ρ : Average utilisation level
Xmin : Pareto distribution position parameter
k: Pareto distribution shape parameter
β : Exponential distribution parameter
Alvarado, J. A., Montoya, J. R., Rangel, L. M., Analyse par simulation de l'impact de la modélisation du temps de service avec une distribution heavy-tailed: étude de Cas d'un atelier de maintenance automobile., Mosim 2008, Proceedings of the 7eme conference international de modelisation et Simulation, Paris, 2008. [ Links ]
Andriani, P., McKelvey, B., Why Gaussian statistics are mostly wrong for strategic organization., Strategic Organization, Vol. 3, 2005, pp. 219–223. [ Links ]
Barabási, A. L., The origin of bursts and heavy-tailed in human dynamics., Nature, Vol. 435, 2005, pp. 435–439. [ Links ]
Cohen, J. W., Some results on regular variation for distributions in queuing and fluctuations theory., Journal of Applied Probability, Vol. 10, 1973, pp. 343–353. [ Links ]
Embrechts, P., Kluppelberg, C.,Mikosch, T., Modeling extremal events for Insurance and finance., New York, Springer-Verlag, 1997. [ Links ]
Gross, D., Fundamentals of queuing theory., 4th ed., New York, John Wiley & Sons, 2009. [ Links ]
Hillier, F., Lieberman, G. J., Operations Research., 8th ed., México, McGraw-Hill. 2005. [ Links ]
Janicki, H. P., Simpson, E., Changes in the size distribution of US Banks: 1960–2005., Economic Quarterly - Federal Reserve Bank of Richmond, Vol. 92, No. 4, 2005, pp. 291-316. [ Links ]
Kuehl, R., Diseño de experimentos: Principios estadísticos de diseño y análisis de investigación., México, International Thomson Editores, 2001. [ Links ]
Mitzenmacher, M., A brief history of generative models for power law and lognormal distributions., Internet Algorithms, Vol. 1, No. 2, 2004, pp. 226–251. [ Links ]
Montgomery, D., Design and analysis of experiments., 7th edition, 2008, Wiley. [ Links ]
Neuts, M. F., Computer experimentation in applied probability., Journal of applied probability, Vol. 25A,1988, pp. 31-43 [ Links ]
Newman, M., Power laws, Pareto distributions and Zipf's law., Contemporary Physics, Vol. 46, 2005, pp. 323-351. [ Links ]
Pakes, A. G., On the tails of waiting-time distributions., Journal of Applied Probability, Vol. 12, 1975, pp. 555–564. [ Links ]
Ross, S., A first course in probability., 7th ed., New Jersey, Pearson Prentice Hall, 2006. [ Links ]
Sigman, K., Apendix: A primer on heavy-tailed distributions., Queuing Systems, Vol. 33, No. 1-3, Dic., 1999, pp. 261–275. [ Links ]
Stidham, S., Analysis, Design, and Control of Queuing Systems., Operation research, Vol. 50, 2002, pp. 197-216. [ Links ]
Stewart, W. J., Introduction to the numerical solution of Markov chains, New Jersey, Princeton University Press, 1994. [ Links ]
Whitt, W., The impact of a heavy-tailed service-time distribution upon the M/GI/s waiting time distribution., Queuing Systems, Vol. 36, 2000, pp. 71-87. [ Links ]
Willinger, W., Traffic modelling for high-speed networks: theory versus practice., Stochastic Networks, IMA Volumes in Mathematics and its applications 71, Springer-Verlag, New York, 1995, pp.169-181. [ Links ]

