




 English (pdf)
 Article in xml format
 Article references

 Automatic translation
 Send this article by e-mail
 Cited by SciELO
 Cited by Google
 Similars in
SciELO
 Similars in Google

 Permalink

Introduction
Harmonic distortion is a power quality concern that can affect the electromagnetic compatibility of the electric power system. Such perturbation is mainly emitted by nonlinear loads, which drew non-sinusoidal currents that distort the voltage waveform. Harmonic distortion can cause malfunction and losses in equipment and lines of the electric power system, resonances with capacitor banks, interference with communication systems, etc. (Das, 2015).
In the early years, research on harmonic distortion was focused on large nonlinear loads due to their noticeable impact on power quality. However, the increasing use of residential electronic devices is causing a significant collective impact on distribution networks (Wang et al., 2016). In fact, some studies have demonstrated substantial economic losses due to electrical losses (Duarte & Schaeffer, 2010; Santiago et al., 2013) energy losses and the economic consequences of the use of small appliances containing power electronics (PE, and interference with telephone signals due to zero sequence harmonics (Bagheri & Xu, 2014; Jewel et al. , 2000).
The main challenges related to the analysis of small distributed harmonic sources are the difficulty in modeling their uncertain nature and time variability (Barros et al., 2013; Romero et al., 2011a) harmonic distortion in PS is a timevarying phenomenon because both linear loads (LL, the propagation and partial cancellation of harmonics due to phase angle diversity (Gil-De-Castro et al., 2015), as well as the interaction between these nonlinear loads and the system (Mansoor et al., 1995). Furthermore, the design of mitigation measures is more complex for distributed harmonic sources (Munir et al., 2016), and the optimal location of capacitors for power factor correction also becomes more challenging due to possible resonances (Masoum & Fuchs, 2015). The complexity in modeling low-voltage networks is another challenge because of their topological characteristics, including: large number of buses and branches, unbalanced loads, multiphase operation and wide range of values of resistance and reactance (Teng et al., 2014).
In forthcoming years, an increase of harmonic distortion in distribution networks is expected due to the connection of modern nonlinear loads such as Plug-in Electric Vehicles (PEVs) (International Energy Agency, 2017), and energy efficient lightning, including Compact Fluorescent Lamps (CFLs), and Light-Emitting Diode (LED) lamps (Blanco & Parra, 2011). Regarding PEVs, their charging would occur mainly at homes (Speidel & Bräunl, 2014) Hence, the analysis of PEVs impact on harmonic distortion should consider the aforementioned challenges related to distributed nonlinear loads, besides the aggravating fact that PEVs demand more power than typical residential loads.
In this context, this paper presents a literature review on the assessment of the harmonic distortion in residential distribution networks. The literature review is based on a novel method to construct bibliographic citation networks. Such proposed method is also presented in this work. The paper has been organized as follows: section 2 presents the method to structure the literature review. In section 3, the review is described. Sections 4 and 5 analyze and discuss the most important findings. Finally, section 6 remarks the conclusions.
Method to structure the literature review
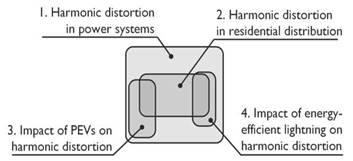
The main areas of knowledge related to the topic were identified: 1) harmonic distortion in power systems; and 2) harmonic distortion in residential distribution networks. Also, other areas such as the impact of some loads are identified: 3) impact of PEVs on harmonic distortion, and 4) impact of energy efficient lighting on harmonic distortion.
These areas are related according to their hierarchy and size as is shown in Figure 1. For instance, the area '1' contains the areas '2', '3' and '4'.
Afterwards, similarly as it was done in a previous work by the authors (Caicedo et al. , 2014), the most important bibliography on each subject was identified by using the following set of search rules in titles, abstracts and keywords stored at the extensive catalog of citations, Scopus of the editorial Elsevier:
Harmonic distortion in power systems = Harmonic distortion AND Power system
Harmonic distortion in residential distribution networks = Harmonic distortion AND Power system AND Residential
Impact of PEVs on harmonic distortion = Electric vehicle AND Harmonic distortion AND Power system
Impact of energy-efficient lightning on harmonic distortion = Lightning AND Harmonic distortion AND Power system
To apply the aforementioned search rules, each term was defined by a set of synonyms and related concepts, as follows:
Electric vehicle: "electric vehicle" OR "electrical vehicle" OR "electric car" OR "electrical car" OR "electric drive vehicle" OR "electrical drive vehicle"
Harmonic distortion: harmonic OR "voltage distortion" OR "current distortion" OR "waveform distortion" OR "non-sinusoidal waveform" OR "nonsinusoidal waveform"
Lightning: "energy efficient lighting" OR "energy efficient lamp" OR "compact fluorescent lamp" OR "LED lamp"
Power system: "power system" OR "power network" OR "power grid" OR "electricity system" OR "electricity network" OR "electricity grid" OR "distribution system" OR "distribution network" OR "distribution grid" OR "voltage system" OR "voltage network" OR "voltage grid" OR "power transmission" OR "power transformer" OR "distribution transformer"
Residential: residential OR domestic OR house OR home OR residence OR urban OR public
The number of references obtained by searching with each rule is reported in Table 1. For the topic harmonic distortion in power systems, 20 561 results were found. This indicates an extensive base of knowledge. However, only 836 documents are related to harmonic distortion in residential distribution networks, which is the specific topic that is dealt within this paper.
Table 1 Number of references obtained with the search rules
| Search rule | Type of document | Total | |||
|---|---|---|---|---|---|
| Journal article | |||||
| Book | Conference | Other* | |||
| Harmonic distortion in power systems | 28 | 9 160 | 10 779 | 594 | 20 561 |
| Harmonic distortion | 0 | 281 | 501 | 54 | 836 |
| in residential distribution | |||||
| Impact of PEVs on harmonic | 0 | 114 | 238 | 36 | 388 |
| distortion | |||||
| Impact of lightning | 0 | 30 | 75 | 3 | 108 |
| on harmonic distortion | |||||
Date of survey: 29/08/2017
*Other: Abstract report, book chapter, business article, conference review, editorial, erratum, note, report, review, short survey, letter
Source: Authors
The orientation of the literature review was based on a citation analysis. The theory of citation analysis provides tools for identifying patterns based on bibliographic data of scientific documents, in order to establish the evolution of research over time (Hicks & Melkers, 2013). Citation counts and citation networks are among these tools. Citation counts represent the impact of a document, whereas a citation network is a useful tool to establish relationships between research works (Persson, 2010).
The literature review was performed based on a citation network on the topic: harmonic distortion in residential distribution networks. To create the citation network, bibliographic data of journal articles for the topic were downloaded from Scopus. Also, bibliographic data obtained with the search rules for the impact of PEVs and efficient lightning on harmonic distortion were taken into account. Only journal articles were considered in the first search, because publishing in a journal implies a rigorous peer review process which usually ensures a high quality in content. The articles were analyzed briefly, reading all the abstracts and conclusions, thus the most related articles to the topic were identified as Main (M). Afterwards, the extension method proposed by Lindahl (2012) was applied with some modifications. The objective of the extension method was to identify and include the articles that were omitted by the search rules.
The extension method consists in identifying Citing journal articles (C), which cite two or more main articles (M), and Referred journal articles (R) which were cited by two or more main articles (M). Hence, this method is based on the concepts of co-citation and bibliographic coupling as a measure of similarity in content (Persson, 2010). After applying the extension method, C and R articles were briefly analyzed to identify those strongly related to the topics. Finally, the citation network was built by using M, and the journal articles selected from C and R.
In the resulting citation network, each article is represented by a circle whose size is proportional to the number of times it is cited by other articles in the network. Links are represented by directed arcs from the article that cites to the cited one. However, as citation networks are usually difficult to interpret because of the large number of links, then, the 'Weighted Direct Citation Index' (WDC) (Persson, 2010) was used to weight the links. Once a weighted citation network (i.e. a citation network with links strengthen by WDC values) was created, only the citation with the highest WDC value was considered for each article, to eliminate several links and simplify the network, allowing to identify lines of research. Links with a WDC with value of one were also eliminated. Afterwards, the network was organized chronologically to observe the evolution of lines of research.
In the following section, the citation network is presented and some of the observed research lines are analyzed, highlighting performed contributions and proposed methodologies.
Harmonic distortion in residential distribution networks: literature review
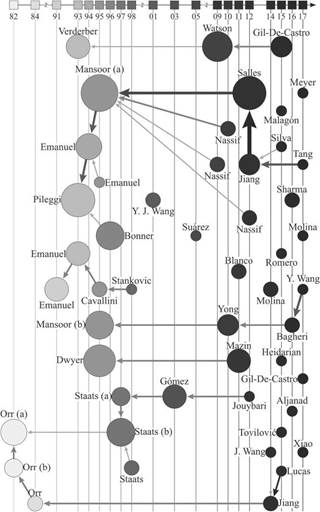
Figure 2 shows the citation network for the issue harmonic distortion in residential distribution networks. For the sake of space, only some lines of research are described. However, most of the articles of the network are considered in the analysis and discussion, including the isolated ones.
Source: Authors
Figure 2 Chronological citation network related to harmonic distortion in residential distribution networks.
Several investigations on harmonic distortion in residential distribution networks were performed in the 1990s as is shown in Figure 2. The main reason was the incorporation of a new nonlinear load: CFLs. For instance, in the work by Pileggi et al. (1993), residential feeders were simulated with CFLs. That study demonstrates the inverse linear relationship between linear load connected to the network and measured THDV (Total Harmonic Distortion in Voltage). This effect is due to damping of harmonic distortion caused by shunt linear loads. According to Figure 2, the research by Pileggi et al. (1993) led to the work by Emanuel et al. (1994, 1995)battery chargers, PC's, TV's and electronically ballasted lights. The analysis is based on the determination of the most harmonic susceptible busses and their response to each harmonic frequency. A new expeditive method that takes into account the background harmonic voltage phasor, and an equivalent bus impedance was developed and used to compute the maximum non-linear loads that yields VTHD = 5%, (Voltage Total Harmonic Distortion.
The evolution of a line of research is remarkable, since the same authors reported progress in their work. At first, the distortion caused by CFLs was studied (Pileggi et al., 1993). Afterwards, the distortion caused by a variety of nonlinear loads was analyzed (Emanuel et al., 1994)battery chargers, PC's, TV's and electronically ballasted lights. The analysis is based on the determination of the most harmonic susceptible busses and their response to each harmonic frequency. A new expeditive method that takes into account the background harmonic voltage phasor, and an equivalent bus impedance was developed and used to compute the maximum non-linear loads that yields VTHD = 5%, (Voltage Total Harmonic Distortion. Finally, a forecast of THDV in the previously studied networks was estimated, for the next two decades (Emanuel et al. , 1995).
Figure 2 shows that research conducted by Emanuel et al. (1994), led to the work by Mansoor et al. (1995a), where the harmonic interaction and diversity effect in harmonics produced by a large number of single-phase electronic loads were investigated. An analytic model was developed for a single-phase full-wave rectifier, typically utilized in residential loads. From several case studies, the authors concluded that the constant harmonic current source model leads to overestimation of distortion, since the effect of harmonic interaction (which leads to attenuation or amplification) is omitted. This finding is of paramount importance in the analysis of harmonics in residential distribution networks. However, the model complexity hinders the application to scenarios of mass penetration of nonlinear loads. On this basis, several works investigated the harmonic interaction. For in-stance, Nassif et. al. (2009, 2012) proposed the equivalent lamp index to characterize the harmonic attenuation on CFLs. Further developments were achieved by Nassif et al. (2010) proposing a method for obtaining suitable nonlinear load models for harmonic load-flow calculations based on extensive field measurements.
Following the line of research derived from Mansoor et al. (1995a), Salles et al. (2012) proposed a probabilistic bottom-up approach based on Monte Carlo simulation to assess the collective impact of residential nonlinear loads. Residence models were constructed by using probable operating states (on/off) of typical home appliances. Thereby, the impact on harmonic distortion in the secondary distribution network was assessed. Afterwards, aggregated models were obtained to assess the impact on the primary distribution network. The methodology takes into ac-count variability over time of harmonics and the bottom-up approach facilitates the investigation on the influence of market trends and regulations. Nonetheless, the harmonic interaction was not taken into account and extensive input data are required. Jiang et al. (2012) presented applications of the described methodology. For instance, the effect of CFLs on a distribution network was forecasted, according to market trends. Results revealed a 10% growth rate in THDV for the following two years after the study.
Bearing in mind the same line of research, Silva et al. (2015) presented a methodology to assess unbalanced distribution networks, considering load variation. Despite the simple application and the accounting of cancellation without diversity factors; it provides little understanding of the diversity effect and the harmonic interaction. Concluding this line of research, according to Figure 2, appeared Tang et al. (2017) with a method to establish harmonic current responsibilities at the PCC of residential networks.
In other line of research, the data collected by Emanuel et al. (1991, 1993) in extensive surveys, was used by Cavallini et al. (1995) to propose a deterministic-stochastic approach to calculate the Probability Density Function (PDF) resulting from the sum of harmonic currents in distribution network buses. The novelty of this work lies in considering the variation patterns of harmonics over time from a deterministic component, coupled to a component which takes into account the randomness of distortion. A similar approach was proposed by Stankovic & Marengo (1998), using Markov chains to model the stochastic component.
According to Figure 2, a line of research was initiated by Dwyer et al. (1995). In that work, the impact of CFLs on harmonic distortion was studied through simulations in time domain to analyze the effect of partial cancellation caused by diversity. Furthermore, simulations in frequency domain were carried out to investigate the propagation of harmonic currents. The authors concluded that a massive penetration of CFLs may cause the violation of harmonic distortion limits allowed by the standards. Afterwards, Mazin et al. (2011) presented a method to determine the contribution of a residence to harmonic distortion, by using measurements. Findings from this study show that voltage distortion at the Point of Common Coupling (PCC) was mainly due to the system contribution.
In the early 1980s, one of the first concerns regarding the impact of PEVs on power quality of the electric utility appeared, in effect, harmonics generated by PEV battery chargers. In the work by Orr et al. (1982a), an analysis of harmonic currents generated by a cluster of PEV battery chargers was carried out. Chargers with a very simple topology consisting of a step-down transformer and a full-wave rectifier were assessed. A Monte Carlo simulation method was proposed, considering battery and charger parameters; start time of charging; initial SOC of batteries; and the number of connected PEVs to a single bus. Results demonstrate that harmonic amplitudes are highly dependent on the start time and the number of PEVs. Orr et al. (1982b, 1984) complemented their work, firstly, by studying the harmonic currents of different types of PEVs, and secondly, with an im-proved approach to predict the harmonic currents affecting the substation transformer, considering the random distribution of PEVs along low voltage feeders. On the basis of these works, Jiang et al. (2014) introduced more detail in modeling the probabilistic aspects related to PEVs. Moreover, other works analyzed the effect of charging stations (J. Wang et al., 2014), and fast charging of PEVs on harmonic distortion (Lucas et al., 2015).
According to Figure 2, other line of research derived from the work by Orr et al. (1982a), led to the research by Staats et al. (1997b). In that work, an analytic method to predict the injected harmonic currents by a concentration of PEV battery chargers was proposed. Such method is quite similar to the one presented by Orr et al. (1982a) in the initial considerations, therefore, it has similar drawbacks such as assuming all PEVs connected to a single bus. Besides, the method was based on a single type of battery charger. Despite these disadvantages, the method was very detailed in the modeling of start time of charging and initial SOC as PDFs. Thus, partial harmonic cancellation due to diversity in phase angles is taken into account. In addition, theoretical calculations without iterations can be achieved, reducing computation time drastically. Based on the same method, besides Monte Carlo simulation, further developments were achieved by Staats et al. (1998) by computing the statistics of harmonic voltages at each bus in a residential network. From the results, the probability that THDV will not exceed the limit established by standards was evaluated.
Based on previous works, some researches focused on the investigation of the impact of PEVs on distribution transformers. For instance, Staats et al. (1997a) determined the relation between PEVs penetration and substation transformer derating, based on the transformer hot-spot temperature and life expectancy, while also considering the effect of harmonic currents. Following this line of research, Gómez & Morcos (2003) developed a computer tool to determine the life consumption of distribution trans-formers based on the thermal-aging rate and loss-of-life of the transformer, and the characteristics of connected PEV battery chargers. The impact of PEV chargers on the increase in load on transformers, cables, circuit breakers and fuses was also investigated. On a similar basis, Jouybari et al. (2012) studied the effect of PEV battery charging on transformer derating. To that end, the authors utilized the statistical models and battery charging characteristics investigated by Staats et al. (1997b) to represent randomness in input parameters. Then, a harmonic load-flow was carried out, using a backward/forward sweep-based method. Finally, the effects of harmonics on transformer K-factor and life-span were analyzed.
Analysis of the literature review
From the literature review, the stages to carry out the assessment of harmonic distortion in distribution networks by modeling and simulation were identified. The impact of multiple distributed small harmonic sources was emphasized. In the following sections, stages, models and methods for harmonic propagation analysis are described.
Harmonic source modeling
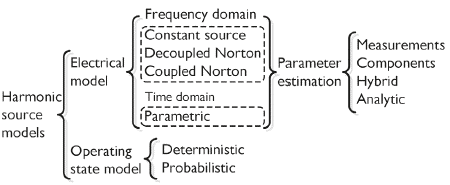
The electrical model, as well as the operating state model, should be defined to adequately represent harmonic sources Salles et al. (2012). Magnitude and phase angle of harmonic currents drawn by a nonlinear load depend on the electrical model. The operating state model represents time variation of harmonic sources, allowing for modeling uncertainty. Figure 3 shows a classification of harmonic source models.
Electrical model
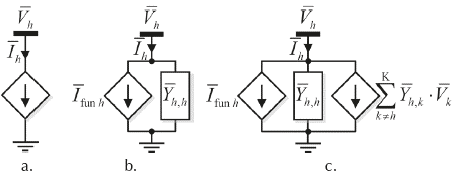
In Figure 4, the models of harmonic sources in frequency domain are depicted. The constant source model (see Figure 4(a)) is represented as a complex current with fixed magnitude and phase angle obtained from the typical harmonic spectrum of the nonlinear load (Bonner et al., 1996). Moreover, the decoupled Norton equivalent is formed with a constant current source, connected in parallel to an admittance, as is shown in Figure 4(b). The constant current source represents harmonics due to the fundamental component of voltage. The admittance allows to consider the attenuation/ amplification, but only for voltages and currents of the same harmonic order (Nassif et al., 2010). The coupled Norton equivalent is shown in Figure 4(c), where the connection of a constant current source and an admittance is depicted, similarly as the decoupled Norton equivalent. In addition, a voltage dependent current source in parallel, represents the deviations caused by the interaction of harmonic currents and voltages of different order (Yong et al. 2010). Finally, in the parametric model, components of the nonlinear load (semiconductors, resistors, capacitors, inductors, etc.) are characterized. Hence, detailed knowledge of the load is required (Mansoor et al., 1995a).
Source: Authors
Figure 4 Models for harmonic sources in frequency domain: (a) constant current source; (b) decoupled Norton; and (c) coupled Norton.
Modeling of nonlinear loads may also be classified by the way for estimating the model parameters. For instance, the modeling based on measurements (top-down) yields nonlinear load parameters from extensive measurements (Nassif et al., 2010). Moreover, the approach base on components (bottom-up) al-lows to obtain aggregate models, from individual components (Salles et al., 2012). On the other hand, the analytic approach yields expressions from the theoretical examination of the non-linear load operation (Mansoor et al., 1995a). Finally, there are hybrid approaches which combines various types of modeling. For instance, Yong et al. (2010) combine measurements and analytic examination to obtain the model for full-wave rectifier-based loads.
Operating state model
The operating state may be deterministic when the nonlinear load is considered a source of constant parameters, which represents the steady-state performance. On the other hand, the probabilistic approach models the variation over time of harmonic currents. Thus, the uncertainty in the operation of a nonlinear load may be modeled as a PDF.
Distribution network modeling
The scope of the distribution network model depends on the target of the harmonic analysis and the availability of network data. In the literature, four main aspects have been taken into account. The first one is the unbalance. In this regard, considering unbalance implies modeling of multiphase networks, including impedances of each phase and the neutral conductor. Otherwise, only the single-phase representation of the network is modeled. The second main aspect is the model of primary and secondary distribution. The target of the harmonic analysis defines whether both, the primary distribution network (between ~ 1 kV and ~ 69 kV), and the secondary distribution network (less than ~ 1 kV), should be modeled. The third aspect is the distribution transformer model, given the fact that several harmonic studies focus on assessing the impact on distribution transformers. Therefore, specific models for transformers are developed to represent suitably their frequency response. The last aspect is the linear load models, which may be aggregated or detailed, and they should properly represent the effect on the network frequency response.
Harmonic sources penetration modeling
The level of penetration of harmonic sources may be deterministic, when it is approximately estimated, based on knowledge of the specific network. In the case of new nonlinear loads, certain levels of penetration, which are of particular interest, can be defined. For instance, the scenario in which the THDV limit (usually 5%) is exceeded in one or more buses is of particular interest. Moreover, probabilistic approaches model the level of penetration based on statistics from trends in the use of specific nonlinear loads, in a particular place. For future scenarios, these probabilistic models are used to forecast the level of penetration, based on market trends of the new nonlinear load to be studied.
Analysis and simulation of the harmonic propagation
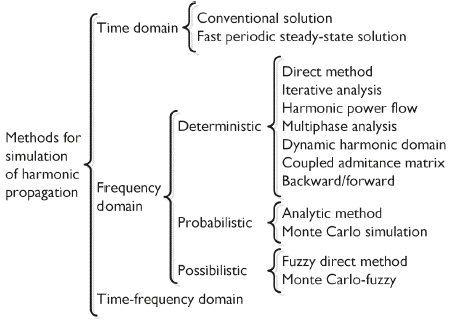
Figure 5 presents a classification of methods for analysis and simulation of harmonic propagation in power systems. In this section, a brief description of each method of Figure 5 is presented.
Time domain methods
In time domain, the conventional solution (brute force) and the fast periodic steady-state solution are distinguished (Medina et al., 2013). In these methods, voltage and current waveforms are obtained by integrating the differential equations that describe the steady-state of the system. Then, harmonic components of the waveforms are computed, by using Fourier analysis.
The computational effort in the conventional solution increases exponentially with the size of the system. In the fast periodic steady-state approach, the convergence of the solution is accelerated, by applying the Newton-Raphson method to obtain the steady-state.
Frequency domain deterministic methods
In the direct method, the harmonic currents are calculated at each bus, from the fundamental voltage and the characteristics of nonlinear loads. Then, bus harmonic voltages are computed, from the system admittance matrix, and the harmonic currents. For the iterative harmonic analysis, nonlinear loads are modeled as voltage dependent current sources. Harmonic voltages at buses are calculated in each iteration. Then, new harmonic cur-rents are computed with the obtained harmonic voltages. The process is repeated until the solution converges (Medina et al., 2013).
The complete harmonic load flow was introduced by Xia & Heydt (1982), based on the Newton-Raphson algorithm. The solution is obtained by using the set of nonlinear equations of the conventional load-flow, together with the equations related to nonlinear loads. In a further improvement, namely, the multi-phase harmonic analysis, the three phases and neutral conductors of the network are modeled. Hence, uncharacteristic harmonics caused by unbalance are considered. The dynamic harmonic domain is another derivation of the harmonic load-flow, which includes interharmonics and unbalanced networks (Medina et al., 2013).
The coupled admittance matrix is a non-iterative approach that takes advantages of the coupled admittance model of electronic devices (Sun et al., 2007). Being this model linear, the equations of harmonic voltages and currents, associated with nonlinear loads and with the network are solved simultaneously. On the other hand, the backward/ forward sweep, proposed by Teng & Chang (2007), is applied in two steps. Firstly, a backward sweep allows to calculate branch harmonic currents in a radial network. Then, a forward sweep is used to compute harmonic voltages at buses, from previously obtained harmonic currents.
Frequency domain probabilistic methods
Probabilistic methods can be classified as analytic or based on Monte Carlo simulation. In analytic methods based on the deterministic direct approach, magnitude and phase angles of harmonic currents are represented with Joint Probability Density Functions (JPDFs). Afterwards, JPDFs of harmonic voltages are computed (Carpinelli et al., 2001). Other analytic methods are achieved by linearizing the complete harmonic load-flow around mean values of harmonic voltages and currents. On the other hand, the Monte Carlo-based approaches involve the simulation of multiple scenarios of harmonic penetration (Caramia et al., 1994). In these methods, values of random variables are generated from PDFs. Then, a deterministic harmonic load-flow is run and the results are stored. The procedure is repeated until accurate results are obtained. Finally, the statistics of the output variables are computed.
Frequency domain possibilistic methods
A direct method of possibilistic harmonic load-flow was pro-posed by Romero et. al. (2011b, 2012). The method uses possibility functions to represent input variables, and results are re-ported as possibility functions of harmonic voltage magnitudes. Another possibilistic method was presented by Dobrc et al. (2015). This hybrid approach is based on fuzzy logic and Monte Carlo simulation. Its application is focused on distribution net-works.
Hybrid methods (time-frequency)
In hybrid methods, network impedances and invariant linear loads are modeled in frequency domain, whereas nonlinear and variant loads are modeled in time domain. Harmonic voltage at buses is calculated by using an iterative procedure (Medina et al., 2013).
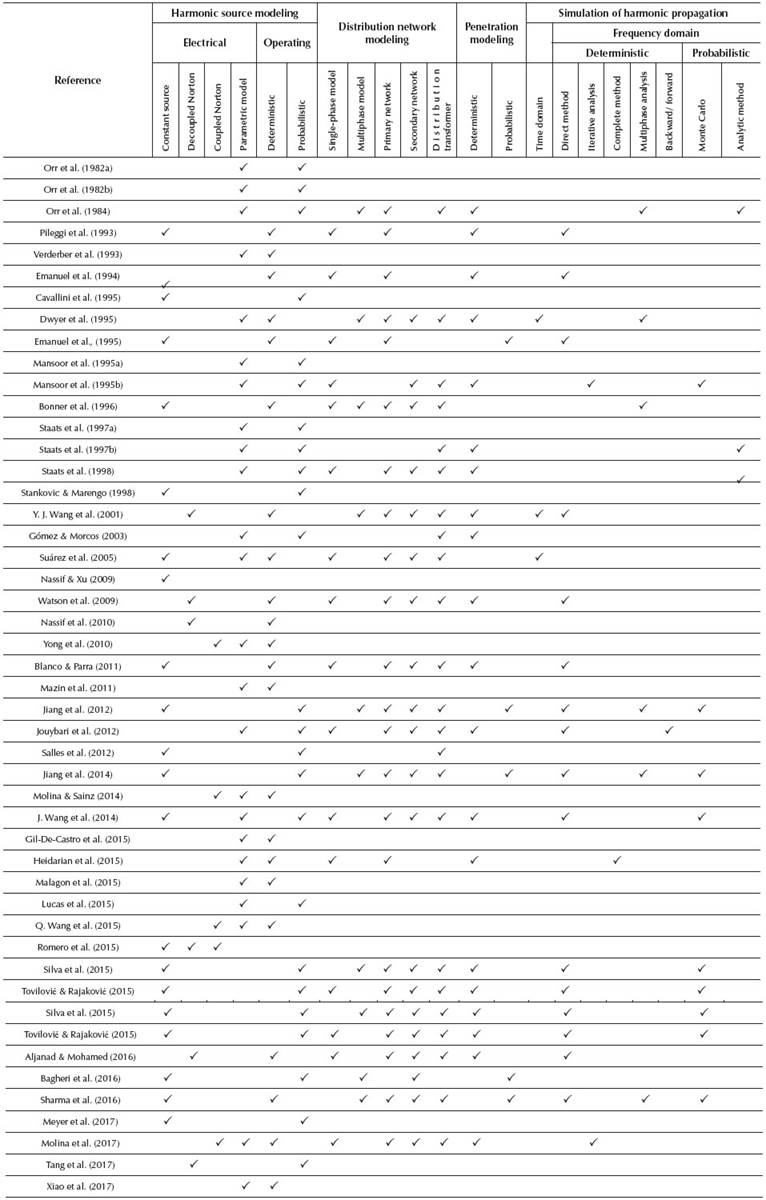
Table 2 shows the characteristics of each methodological contribution to the assessment of harmonic distortion in residential distribution networks and to PEVs harmonic impact assessment.
Discussion
The analysis of the literature review allowed the main issues to be identified with respect to the modeling and simulation of harmonic distortion in distribution networks.
These issues should be considered to obtain an accurate assessment in scenarios of large-scale penetration of multiple nonlinear loads:
Harmonic interaction between nonlinear loads and impedances of the network, i.e., the interaction between harmonic voltages and currents of different orders drawn by nonlinear loads. This phenomenon causes that magnitude of harmonic currents are attenuated or amplified, mainly depending on magnitude and phase angle of voltage harmonics
Diversity on phase angles of harmonic currents drawn by different nonlinear loads, mainly depending on the type of load, rated power, line impedance (between the nonlinear load and the PCC), and its X/R ratio. Diversity on phase angles leads to partial cancellation of harmonic currents
Unbalance in the operation of distribution networks, which causes the propagation of uncharacteristic harmonics
Uncertainty in operation and composition of loads, due to diverse operating states of devices, different usage habits by end-users, as well as the lack of information of loads connected to the network. Uncertainty causes that harmonic distortion can be only estimated with a certain probability.
The higher the harmonic penetration level of harmonic sources in the network, the greater the influence of the aforementioned issues on results. Table 3 reports the general methods for simulating the propagation of harmonics, as described in previous sections. Aspects that can be straightforwardly modeled in each general method are indicated. Moreover, there are approaches that combine two or more methods of Table 3, thus, various aspects can be taken into account simultaneously. For instance, methods based on Monte Carlo simulation and the direct method have been developed, hence, these allow the diversity effect and uncertainties to be considered.
Table 3 Main aspects considered by general methods for simulation
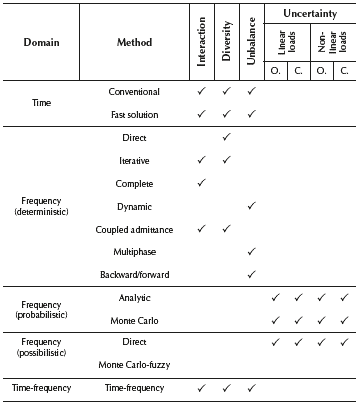
O: Operation. C: Composition.
Source: Authors
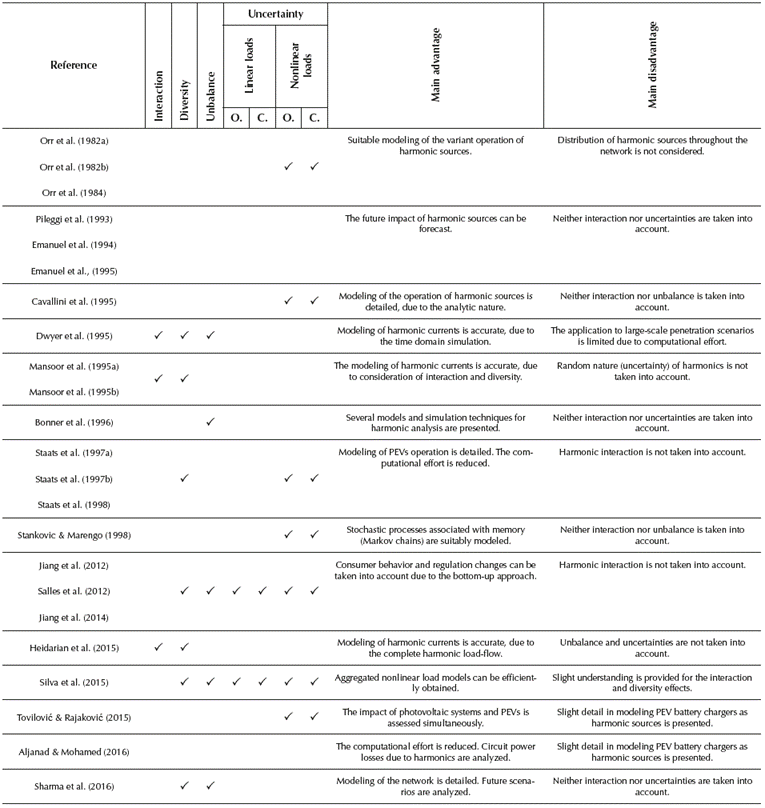
Table 4 presents the main methodologies for assessing harmonic distortion in residential distribution networks, which were previously described in the literature review. indicated. Only complete methodologies are listed, i.e., Aspects into consideration, i.e., interaction, diversity, those including the four stages described in previous unbalance, and uncertainty, in each approach are sections.
Conclusions
Harmonic distortion caused by multiple low-power nonlinear loads has mainly negative impacts, such as reducing the life-span of various assets of the distribution network (transformers, conductors, protective systems, etc.), according to the literature review. The increase in these negative effects is expected, since new nonlinear loads, such as PEVs, CFLs and LED lamps, will be progressively incorporated to power networks. Thus, the importance of analyzing the impact of modern nonlinear loads on harmonic distortion is apparent. Moreover, the random nature of residential nonlinear loads introduces complexity in predicting their collective impact, hence, further research in this issue is required.
According to the literature review, the harmonic interaction effect is important and should be taken into account, especially in scenarios of large-scale penetration of distributed nonlinear loads. These nonlinear loads would interact differently with the network depending upon their front-end topology (e.g., without power factor correction, with passive power factor correction, or with active power factor correction).
The detailed modeling of the effect of harmonic interaction in frequency domain requires iterative methods that need significant computational effort. This effort increases if uncertainties are analyzed by Monte Carlo simulations. Simplified models have been developed (Norton coupled type) for some distorting loads, which accurately represent the harmonic interaction in frequency domain. Nonetheless, the integration of these type of models into the Monte Carlo simulation method should be further studied.
Aspects analyzed in Table 4, which are required for an adequate assessment of harmonic distortion in scenarios with multiple harmonic sources, have not been considered simultaneously by current methodologies. These aspects refer to: harmonic interaction, diversity effect, unbalanced operation, and uncertainty in operation and composition of linear and nonlinear loads. Therefore, future research can be conducted in the formulation of an integral method to analyze the complex but interacting issues.

