


 English (pdf)
 Article in xml format
 Article references
 Send this article by e-mail
 Cited by SciELO
  Cited by Google
  Similars in
SciELO
Similars in
SciELO  Similars in Google
 Permalink
1. Introduction
The generation of solid waste (SW) is an issue of great importance for the different economies of the world. China, for example, has grown significantly over recent years, which has forced the country to include waste generation measurement and control in its policies [1]. The identification and classification of SW by region throughout the world has shown the wastes solutions are closely related to the waste composition; thus, a further understanding of this is required in order to take action against these impacts, with different strategies that include recycling, reusing, or finding new uses for a particular waste material [2]. There is a significant pressure worldwide towards the industry and goverments for the implementation of strategies contributing to reduce the volume and composition of SW by the year 2025, particularly in countries where the companies are growing at a rate higher than their country’s GDP such as in China, East Asia, Eastern Europe, and in the Middle East [3].
One of the most significant indicators for a country economy is the gross domestic product (GDP), which is a monetary measure of the goods and services of the country in a specific period of time [4]. The GDP derived growth directly affects the generation of SW, therefore indicating and requiring that countries and municipalities make immediate changes in to take responsibility in managing the waste issues [5]. In Latin America and the Caribbean (LAC), the GDPs subsectors of mining and quarrying, construction. and transportation, are very significant in the economy, and thus serve as information for analyzing the overall behavior of the region, and understanding the diverse challenges LAC have had to face in terms of sustainable development, [6].
These challenges are the result of the natural effects that growth rates have had in recent years, which ultimately have been a determining factor in the urbanization. As UN-HABITAT states, “The urbanization experience of the LAC has been very fast and difficult to manage, due to both the speed with which it occurred and the general economic and institutional weaknesses of the countries of the region; as a result, these problems have manifested themselves with their full force” [7]. How Colombia’s GDP has performed in the subsectors of mining and quarrying, construction and ground transportation is not very different from how the GDP of LAC has performed in these areas. This is reflected in the data on Colombia’s national accounts published in the periodic reports of the National Department of Statistics (DANE, Spanish acronym), which shows that the performance of these subsectors is very influential of the overall GDP [8].
The SW generation in LAC and its management has become a priority for most of the governments [7]. The projected population growth and its effects on the GDP, as well as the waste generation per capita, are now subjects of constant analysis [2]. LAC and other developed countries with the support of international organizations have been working in collecting waste generation data and in its analysis in order to understand the implications of this issue for the region and then for creating proposals and solutions to mitigate the adverse environmental effects [8]. These solutions do not only have a positive impact in the environment, but also can be a solution for improving the local economy [9].
The SW generation in Colombia reflects the situation at a LAC and other countries worldwide as well: continuous growth in recent years has brought economic, legal and technological advantages but also new challenges to meet the needs of the population growth, which has had an adverse impact in the environment and therefore in new health risks, employment, and in the economics as well [10]. Coming back to the GDP and given the dynamics of this situation, the employment is a critical point of analysis as a vital part of the subsectors of mining and quarrying, construction and ground transportation, due to how these activities influence the country’s total GDP and because of the nature of their relationship to the specific activities of mining, construction, and ground transportation sectors in the nation [11]. From an economic point of view, development and growth are inevitable aspects of the global economy. This means that countries must find clear alternatives and models for better and more productive processes, and thus, must make great efforts to develop its own economic model that maintain the wellbeing of a country’s society. One of these alternative models is the Circular Economy, a sustainable approach which features valuable aspects for managing and reducing waste, both from the point at which it is produced, through its final consumption.
The main goal in this research is to study the Colombia’s SW in relation to the economy of the country, mainly because the information and current state of the art has poor analysis and has a lack in data as the country is just entering in giving solutions to the waste generation, managements, recycling, valorization and exploitation. The data presented in this investigation has been collected from several important sources, including official data for the country, but processed with other data and generating new data, all analyzed inside Colombia and analyzed at least in the general trends with respect to LAC and to some of the world leading economies as well. The method included the analysis of data from different sources and the comparison among them with technical criteria, mostly based on the materials composition and in the macro industrial sector.
The investigation has been focused on the sectors that are closely related to the SW generation, particularly to the SW related with complex wastes such as the construction and demolition, and mining wastes, which are of great interest in Colombia due to their impact in the economy. In addition, this type of waste is not only more difficult to process, and therefore less technology and industry is willing to give solutions on it, but also, can be more environmentally adverse. Also, less research and development is found in these areas. Thus, data regarding the composition of waste by regions, GDPs information with respect to the population, and some information regarding the current state of the waste treatment model has been included in this investigation.
2. Methodology
This article is based on the processing, consolidation, and evaluation of available and new data from different sources regarding the main SW from Colombia, and in a more general overview to other LAC countries as well. This project is part of an investigation that focuses on the solid waste situation coming from construction and demolition industry, and therefore involves directly its transportation, and mining of the raw materials. Besides the interest in giving solution to the wastes of these areas for the goverment and academia from Colombia, is the problem that the information regarding the solid waste has not been accurately investigated, and thus not properly analyzed. Therefore, the method mainly was the investigation of the most important data bases, then the processing and organization of the data regarding the solid waste generation numbers, the elaboration of graphs, and their analysis with respect to variables such as GDP, population, and other indicators elated to the waste generation issue. Most of the used information corresponds to official data from Colombia´s agencies.
The main investigated data source of information was Cepalestat [12], which includes databases and statistical publications from the United Nations Economic Commission for Latin America and the Caribbean (ECLAC). From the Cepalestat’s source, the statistical information on each country in LAC related to the GDP for mining and quarrying, construction, transportation, storage and communications was used. The second main source was the Observatorio Económico Latinoamericano (OBELA, Latin American Economic Observatory)[13]. This database contains information about the urban population employed by the mining, construction and transportation sectors. The data was used to determine the relationship between the urban population and the three economic activities that are analyzed. The third source was the database from the statistical office of the European Union (Eurostat) [14], which collects information on the composition of SW worldwide [14]. The fourth database came from DANE, which is primary source of official data for Colombia. This information was categorized by branch of economic activity [15], and used to determine Colombia’s GDPs for mining and quarrying, construction, transportation, storage and communications. This information was discussed with respect to the GDPs for oil drilling, the mining of non-metallic materials and ground transportation. Most data were further treated with MS Excell software and results were compared not only among official databases, but also international sources. Discussion with the industrial sectors was also conducted in order to validate the numbers presented here. The situation of different wastes in Colombia and its potential use has been further investigated before in CCComposites group as later presented, which was also confronted with some data from the industrial sector.
All these numbers are also contrasted with the following information: academic research on SW, the GDP of sectors of interest to the IDB, DANE reports, mining and energy statistics, and What a Waste (Urban Development Series - Knowledge Papers). Lastly, despite some of this data are not being well established for Colombia, the summary and analysis in this investigation is a contribution towards the development and implementation of a better economic model [16].
3. Gross domestic product and primary solid waste (SW) in numbers
Figure 1 shows three common examples of the poorly managed SW, found in public spaces in Colombia. These materials are composed of construction and demolition waste (C&D) produced from the construction of the Colombia’s infracstructure, mixed with ordinary waste [17]. The reasons to have this bad waste disposal practices are multiple: the long gap between the time in which the user lets the waste in the indicated zone and the time it is collected by the waste collection company; the wrong type of waste that the user lets in the collection point later not collected the collection company; and a poor legislation, and more importantly, a poor law enforcement by the city authorities. These are typical domestic waste collection issues, mostly solved in many developed countries.
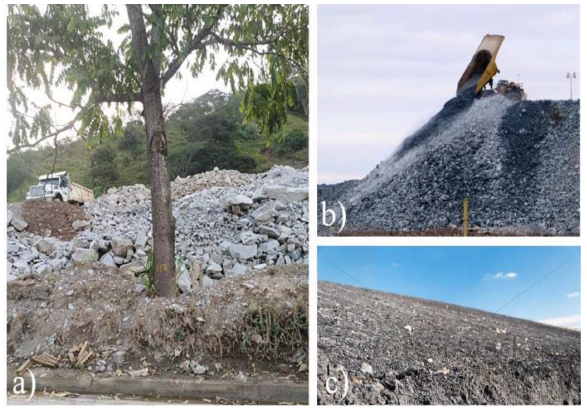
Figure 1 Different examples of poorly disposed waste in Colombia. Source: Echeverri, Colorado (2018)
Figure 2 shows the composition of SW for different regions and countries throughout the world, which have in common the general areas of organic material, paper and cardboard, plastic, glass, metal and other materials. This representation reveals that there are two additional categories for Colombia with respect to the other economies: textiles and wood. The pie charts demonstrate the following: a) the composition of global SW by region (7 regions are analyzed), b) the composition of SW in China [1], c) the composition of SW in the EU, d) the composition of SW determined by the OECD and e) the composition of SW for Colombia (which includes wood and textile waste). Figure 2a for all regions and 2c for USA are similar when the area size is considered. Figure 2d is significantly different than the others, the OECD summarizes the richiest economies of the world, and thus, their waste must be different. Figure 2b fro China and Figure 2d for Colombia have similar organic waste amounts.
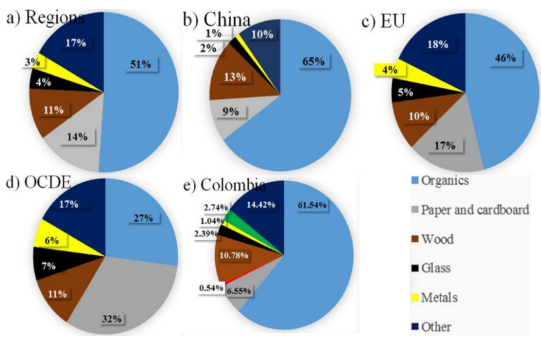
Figure 3a shows the GDP mining and quarrying, and construction and transportation, both for the period between 2010 and 2016. In the beginning in 2010, the GDP of mining and quarrying grew until its lowest point in 2016. The GDP of construction grew in 2010 and remained steady until it reached a maximum in 2014, followed by its lowest point in 2016. The GDP of transportation reached its highest point in 2014, then going to its lowest point in 2016. Figure 3b shows the rates for the GDP of crude oil and natural gas extractions, as well as the GDP for the mineral extraction of uranium and thorium, which is an important component of the GDP of mining and quarrying in Colombia, where its extraction increased slightly from 16.76% to 17.78% between 2010 and 2011, respectively. After 2011, this rate drops significantly and also experiences negative growth, which in 2016 reaches -11.08%. As the graph shows, results may have had a direct effect on the decline of the GDP for mining and quarrying.
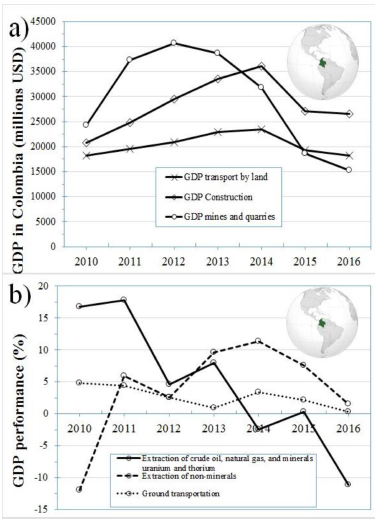
Figure 3 a) GDP of mining and quarrying and GDP of construction in Colombia; b) performance of GDP for oil drilling, extraction of non-metallic materials and ground transportation (%). Source: Cepalestat (2018)
The second variable measured was the GDP of non-metallic materials, which is included as a component of the GDP of construction. This variable experienced a significant increase in 2010 with a negative extraction rate of -11.96%, until it reached its highest point in 2014 at 11.35%, corresponding to a 200% recovery rate compared to the year 2010. Between 2015 and 2016, however, these materials begin to fall again until a low point of 1.58%. This fall could be explained by the performance of the GDP in construction, as the graph shows. Last, the third variable represents the GDP of ground transportation, which is a subsector of the GDP of transportation, storage, and communications. This area experiences a fall between 2010 and 2014 until it reaches 0.90%, then recovering up to a maximum growth in 2014 at 3.40%. After this period, it falls again and in 2016 it reaches its lowest point with 0.28%.
Figure 4 shows the performance of the GDP for LAC. The GDP of mining and quarrying reaches a maximum amount of $349,345,700 USD in 2011, but begins to fall until it reaches its lowest point in 2016 at $142,006,800 USD in 2016, the equivalent of a 59.35% decrease between 2011 and 2016. The second variable represents LAC’s GDP of construction, which experienced growth between 2010 and 2013 until it reached a maximum of $367,896,300 USD. It then experiences a very slight fall until 2014, when it reaches $365,876,700 USD, and then falls significantly in 2016 until it reaches 283,692,700 USD, a 9.33% decrease compared to the GDP of construction in 2010. The graph’s third variable shows the performance of the GDP of transportation, storage and communications for LAC. This variable reaches its highest point in 2014 with $409,771,900 USD and reaches its lowest point in 2016 with $323,684,100 USD, a decrease of 10.84% compared to 2010.
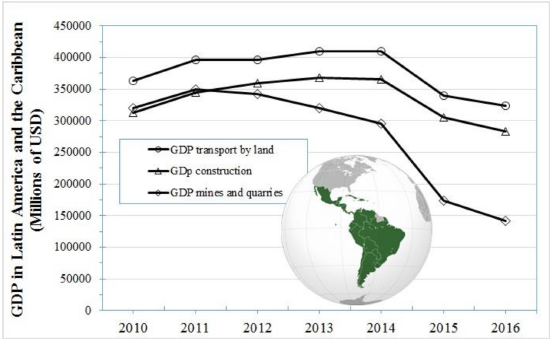
Figure 4 GDP of Latin America and the Caribbean: transportation, storage and communications; construction; and mining and quarrying. Source: Cepalestat (2018)
The information included in Figure 5 shows the relationship between the generation of SW and the GDP of different countries in Latin America (including Brazil, Argentina, Colombia, Venezuela, Peru, Chile, Ecuador, Guatemala and Bolivia). From the countries analyzed, Brazil had the highest GDP for 2010 with $2,212,230,600 USD, which generated 62,730,096 tons of SW for that year. This is the equivalent of 28.25 tons of SW per million USD of the GDP. In Colombia, the GDP for this year was $287,525,400 USD, and its SW generation was 11,300,000 tons, the equivalent of 39.30 tons of SW per million USD of the GDP. Bolivia is also noteworthy, where the GDP was $19,507,700 USD for a SW generation of 1,804,258 tons per year, the equivalent of 92.48 tons of SW per million USD of the GDP.
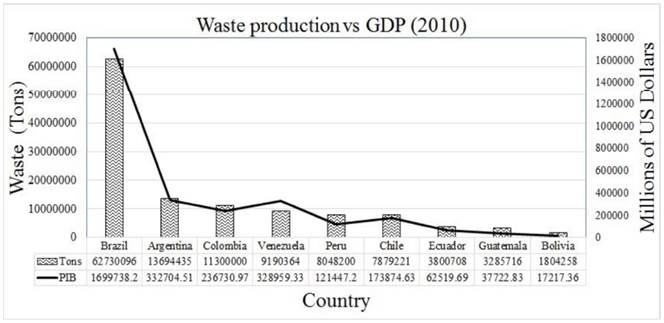
Figure 5 Solid waste production vs. GDP for countries in South America in 2010. Source: Inter-American Development Bank (IDB)
Figure 6 shows the generation of SW for Latin America countries and their GDP. With Brazil, the production of waste per unit of GDP is lower when compared to other countries, despite its GDP for Brazil is the highest in Latin America. Bolivia’s SW generation is also interesting to observe, as it is higher than other countries despite having the lowest GDP. This is indicative of a very inefficient production process in comparison to the other countries analyzed. Figure 6 also shows there is an inverse relationship of the GDP to the generation of waste: while Bolivia generates 92 tons per million dollars of the GDP, Brazil generates 29 tons per million dollars of the GDP.
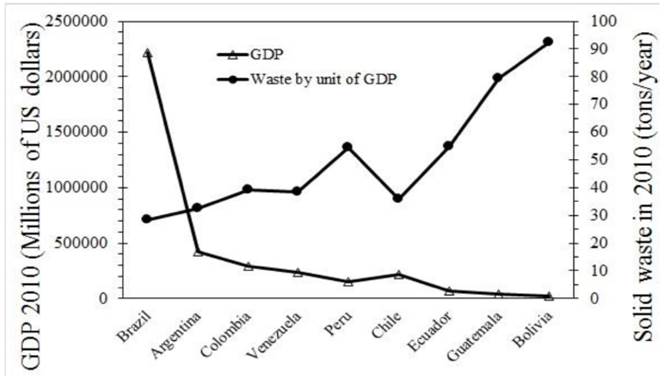
Figure 7 is a summary of the SW generated by Latin American countries compared to their GDP. It also categorizes SW by type and shows its relationship to the GDP, where the generation of organic waste in Brazil, for example, is the highest type of SW, followed by the generation of plastic, paper and cardboard, [18]. This means that for each unit of GDP the country produces, a significant amount of organic waste is generated, followed by plastic, paper and cardboard. It is important to note that plastic material is a large component of the waste generated in each country, which indicates the important role this material plays in the production of modern manufacturing.
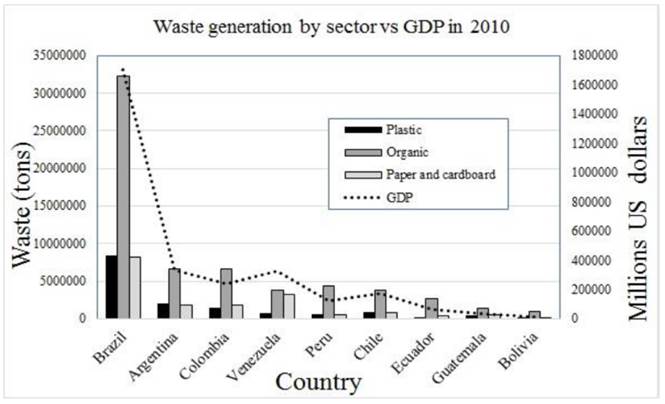
Figure 7 Solid waste by sector vs. GDP for certain countries in South America in 2010. Source: Inter-American Development Bank (IDB)
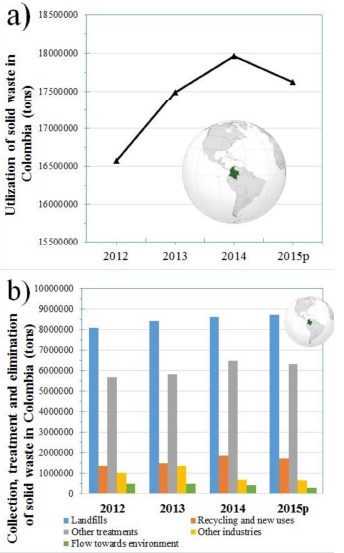
Figure 8a shows the total generation of waste in Colombia between 2012 and 2015. According to the classifications provided by Colombia’s National Department of Statistics (DANE), total waste in Colombia consists of SW and residual waste products. DANE applies this data to Colombia’s national accounts. Figure 8b shows Colombia’s population curve from 2012 to 2015. This figure takes the total amount of SW generated for each of the years analyzed and calculates the per capita rate of SW generated in the country per year. The graph shows how the total population curve grows in Colombia between 2012 and 2015 until the year in which it reaches 48,203,405 tons and the total generation of SW is 19,928,644 tons. With these results, it can be determined that the SW per capita for the year 2015 is 0.413Kg, which is less than it was for 2014, when it was 0.423Kg.
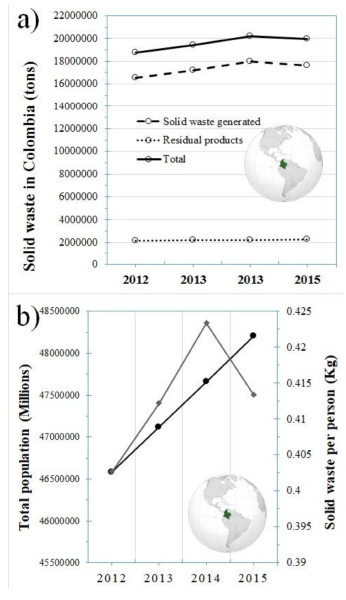
Figure 8 a) Total generation of waste in Colombia, b) Population and waste per capita. Source: Eurostat [14] (2018)
Figure 9 shows population curves of the urban Colombia by sector reflected in the GDP of mining, construction and transportation, between 2000 and 2014. According to the information analyzed, the urban population that works in mining and quarrying is lower than the population that works in construction and transportation. The highest employment rate for this subsector was reached in 2002 when it peaked at 0.9%. The lowest employment rate occurred between 2000 and 2001, when it was 0.4% at the end of 2001. However, considering that the employment rate for 2014 was 0.7%, it can be concluded that the growth rate was 3 points higher than it was in 2000 (the equivalent of 75%). The employment rate of the population that works in construction is six times higher than it is for the mining and quarrying sector. This can be seen in the data for 2012 which shows an employment rate of 6.9% for this subsector; this is the highest rate considering that the rate for 2000 was 5.1%, a growth of 1.8%. Last, the urban population that works in the transportation subsector has higher rates than the mining and construction rates; its highest employment rates occurred between 2009 and 2010, when they reached 9.9%.
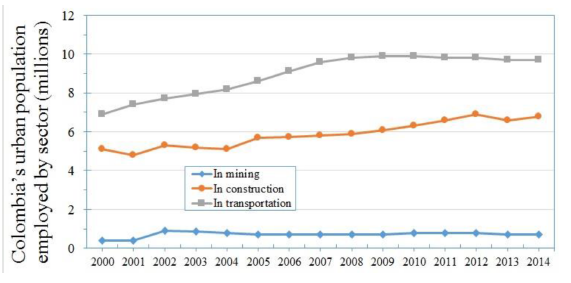
Figure 9 Urban population employed by GDP sectors: mining and quarrying, construction and transportation and communications. Source: Eurostat (2018)
Figure 10 includes information about the use of SW generated in Colombia between 2012 and 2015. In 2012, waste amounted to a total of 16,567,267.9 tons and reached its highest point in 2014 at a total of 17,965,049.9 tons. Waste decreased in 2015, which may be attributed to proper waste management efforts through recycling and reusing, other treatments, the development of new waste-based industries and through the management of waste deposited in the environment.
Figure 10b shows how waste in Colombia is collected, treated and eliminated. Between 2010 and 2015, the majority of SW was sent to landfills. This is a growing trend, as the SW sent to landfills in 2015 was 8,705,050.7 tons compared to 8,062,005.6 tons in 2012. The second most common use of waste is classified as “other treatments,” which reached a maximum in 2014 with a total of 6,484,462.8 tons. A third use of waste is “recycled and new use,” which grew significantly between 2012 and 2014, when it totaled 1,823,868.9 tons. In 2015, however, this amount fell slightly to 1,706,568.8 tons. Waste sent to other industries also grew steadily until 2014, when its total was 683,759.05 tons, which fell to 649,970.01 in 2015. The last group represents waste deposited in the environment, a figure that reduced significantly as in 2012 it totaled 460,193.037 tons and by 2015, it had lowered to 259,164.29 tons, a 43.68% reduction of waste deposited in the environment.
4. Analisys
The rapid pace of global development and its effects on the generation of waste has become a point of concern for all countries. From countries with high levels of development to those with early indicators of growth, in general, all countries have issued warnings on the generation of waste and have established strategies to take more efficient measures to address the problem. Studies conducted by the World Bank show that in the year 2012, cities throughout the world generated 1.3 billion tons of SW. It is estimated that this SW will reach 2.2 billion tons by the year 2025. This data comes from seven regions throughout the world and include a significant number of cities that share a concern for the effects this waste can have on the environment at a global level [2]. This concern is an issue that is also being constantly analyzed by governments and companies worldwide [19].
The composition of SW in the world has been classified elsewhere [20]. This classification has laid the foundation for measures to manage and control SW. For the group of seven regions mentioned, consisting of 51% of the total composition of SW, the greatest component of SW is organic material [2]. However, according to the Organisation for Economic Co-operation and Development (OECD, an economic organization of industrialized countries with 34 member countries), this component is only 27%. For China, this component is 65% of all of its SW, and for the EU, it is 46%. In Colombia, this component is 61.54%, which indicates that its economy has great potential to utilize recoverable material and transform it in an efficient way [21]. This would help reduce its negative impact on the environment and creates the added challenge of attempting to incorporate economic models with strategies for designing new materials and processes that generate less waste. These actions require examining and creating industrial processes that are different or that radically transform the supplies. It also requires analyzing how a country’s current productive model is designed [22]. According to a supply approach, the solution to the production of SW depends on the supply of materials that can contribute a significant level of circularity to the development of a circular economy model. Demand is another approach to addressing the generation of waste. Through this approach, a different analysis is applied, which is based on the need to take action and to manage the generation of organic waste material. This analysis, therefore, focuses on the “take-use-dispose” consumption practices that are part of a linear economy model [14].
The second component of SW is paper and cardboard, which according to the regional statistics [2], is 14% of total waste. For the OECD, however, paper and cardboard represent 32% of total waste, for the EU are 17%, for China are 9% and for Colombia are 6.55%. This data reveals that the percentages for China and Colombia are less than the 14% of paper and cardboard waste, which is below the amount generated by the seven regions examined by Hoornweg et al [2], a sharp contrast to the high composition of organic materials. In contrast, figures on the generation of paper and cardboard presented by the OECD and the European Union show they are greater than the regional figures gathered by Hoornweg. This may be related to the lower percentage of organic material and could explain why these components of waste may have been excluded in each of these countries. A third component in the classification of worldwide waste is plastic, which averages at 11.15% for the countries analyzed by [2]. The remaining components are glass, metal and others, whose percentages are minimal compared to all of the components of SW and are common in the global classification, [23].
It is important to consider that Colombia includes two components that are not considered at the global level presented by Hoornweg et al: textiles, at 2.74%, and wood, at 0.54% [2]. These materials are not included in the data of SW for the rest of the world. This shows there is an opportunity for new industries to develop in the region, as these components have not been utilized in Colombia and can be utilized to create new companies as well as serve as sources for the of new industrial areas, which could provide the country for leadership of these areas in LAC.
Understanding how a sustainable economy influences a country’s development requires having a basic comprehension of its impacts [24], from which the generation of SW is one of the most significant factors in the economics nowadays, which clearly, as shown before, is important in the GDP [25]. GDP can be analyzed not only from the perspective of final production of goods and services, but also thoroughly for the subsectors involved in different development processes, which includes mining of different materials, construction and transportation. All of these sectors provide information that is important to the measurement of SW, both in regards to its quantity and its different components.
Between 2010 and 2016, the performance of the mining and quarrying subsector was tied to the growing demand for construction materials, which has affected on the country’s urbanization in recent years [26]. Similarly, these two subsectors (mining and construction) have had significant effects on the performance of ground transportation, primarily due to the need to move the different types of materials that each of these subsectors produce and demand [27]. As this dynamic has developed, it has led to information that has helped to identify a direct relationship between the performances of these three subsectors. Similar to the performance of Colombia, a direct relationship between the performances of these three sectors can also be observed in the macroeconomy of LAC countries. For example, the GDP of mining and quarrying grew between 2010 and 2012 both in Colombia and the LAC. Between 2013 and 2016, however, an opposite trend occurs as there is a drastic fall, reaching its lowest point in 2016 [27]. This fall may be related to the decrease in the cost of oil barrels during these years, which significantly affected the global economy, specifically that of LAC and Colombia [28]. Employment levels among Colombia’s urban population in the mining and quarrying subsectors also reached their lowest levels in 2012 at 0.7%, compared to 0.4% in 2000; a trend that was similar for this sector in the LAC [12]. With the construction subsector, increased urbanization in recent years has led to growth, which peaked in 2014 in both Colombia and the LAC [29]. In Colombia, in 2014, the extraction of non-metallic materials, which corresponds to the GDP of mining and quarrying, reached 11.3506658%. In 2010, this number was -11.9680851%, which shows that this sector experienced unprecedented exponential growth. The driving forces behind this result were the social housing programs and the development of Vías 4G project (an 8,000 km road infrastructure program), which were implemented by Colombia’s most recent government administration. Rates for the percentage of the population that was employed by this sector were the highest they had been since 2000, when they were 5.1%; by 2014, they had reached 6.9%, [12]. The ground transportation subsector also performed similarly. The growth rate of these 2 subsectors increased consistently for this activity, which had to meet the service demands of construction as well as those of moving the materials extracted through mining activities. At a peak employment rate of 9.9% in 2010, the employment rates of the urban population in this subsector were therefore higher than those of the mining and/or construction subsectors.
From analyzing the GDP of crude oil and natural gas extractions as well as the mineral extraction of uranium and thorium, there is significant evidence that shows a fall in Colombia’s GDP of its mining and quarrying subsector. The GDP for this subsector fell from 2011 until it reached a negative percentage of -11.08% in 2016, [12]. This drop explains the significant loss of value in a sector that has been a strong foundation of Colombia’s economy for years. It is also important to note Colombia’s performance in the GDP of the extraction of non-metallic materials (which also includes construction materials) was in 2011 -11.96%, while in 2014 was 11.35%, corresponding to a 200% increase [15]. This explains the relationship this indicator has with the GDP of construction, which as mentioned previously, experienced accelerated growth with the infrastructure and housing policies of Colombia’s most recent government administration. As a result of this trend, the GDP of ground transportation (a subsector of the GDP of transportation, storage and communications) was directly affected by the demands of the economy, going from 0.90% in 2013 to 3.40% in 2014 (reflected by the decline of the other two sectors), until it reached its lowest point in 2016 at 0.28%.
Between 2012 and 2015, Colombia’s population grew each year at the following rates: 0.4027, 0.4122, 0.4234 and 0.4134 [13]. As a result of this yearly population increase, the generation of SW also increased each year [30]. In 2014, the generation of SW peaked at 20,182,419 tons. A reflection of this, Colombia’s population also grew for each of these years and was 47,661,787 tons in 2014. In calculating the relationship between the generation of SW and the population, SW per capita in Colombia reached a maximum of 0.4234 tons in 2014, then decreased slightly to 0.4134 tons in 2015. This comparison reveals that despite the population increase, this did not have a direct impact on the generation of SW [31]. According to DANE data, this behavior can be explained by improvements made to the use of different waste generated from different economic activities in recent years. Some of these improvements are: the recycling and new uses for waste, the implementation of new waste treatments, the reuse of residual products in industry, and the reduction of the waste deposited in the environment [32]. An important issue for Colombia and LAC in the analysis of SW is the relationship it can have with GDP: in the case of supply, when a country has greater production it increases its use of materials, and in the case of demand, it increases its generation of SW.
It is also important to consider the effects of a supply approach in the relationship between the production process and the use of materials, particularly because the generation of waste could be interpreted as greater or lesser depending on the level of productive efficiency of the industries of a country’s different sectors [16]. A demand approach of analysis could be taken, however, where greater consumption is interpreted as a greater generation of debris in the environment; or ideally, where greater waste means improved utilization of this waste and the existence of more alternative uses. Under this approach, this relationship occurred in Colombia in 2010, where the GDP was $287,525,370 USD, corresponding to the generation of 11,300,000 tons for that year; or alternatively, for every $1,000,000 USD of the GDP, a total of 39.30 tons of waste was generated. This amount is very high compared to Brazil, where for the same year, the total waste generated was 28.35 tons per $1,000,000 USD of the GDP. On the other hand, the generation of waste in Colombia was three times less than in Bolivia, where it was 92.48 tons per $1,000,000 USD of the GDP for the country [33]. This comparison reveals the difference in productive efficiency between these three economies. Brazil is therefore the country that is leading the situation in Latin America, as it is generating the least amount of waste for each unit that is produced and that contributes to its GDP. It is equally important for this analysis to consider the composition of the waste produced by each Latin American country, as this explains the utilization and managing of this waste. For example, the highest component of Brazil’s solid waste is organics, followed by plastics, paper and cardboard [34]. Similarly, these indicators can account for the production characteristics of a country, as well as its potential for recycling and waste utilization. Such information can provide data that is important for analyzing alternative economic models, such as the circular economy, increase the utilization alternatives [24].
Between 2010 and 2015 in Colombia, the search for waste management alternatives has been constant but not enough yet, which is reflected in that the greatest amount of waste is still deposited in landfills. Also, despite that its greatest percentage of waste is organics, the impact this has on the environment is not less serious, especially when considering the additional deposit of waste left on the environment increases its negative impact [32].
One of the main strategies for reducing and managing the generation of SW is the identification and classification, measurement and valorization [35]. This helps to attain clear information that can serve as a foundation for governmental and private sector decision-making processes. It also draws attention to factors to be considered for analysis by a sustainable economy that is based on a production perspective. An example of this can be found with the eco-design framework. This framework uses a series of variables from the ECO-3 model that can identify alternatives to achieving greater efficiency and reducing waste in a country [36]. The alternatives offered by models - such as natural capitalism - that have significant impacts on businesses should be studied and seriously consider by developing countries [37]. This model offers alternative analyses to keep growth patterns at high levels of sustainability, making social responsibility a part of how its natural resources are used, and resulting in economic expansion that does not inflict irreversible damage to the planet [38].
5. Conclusions
5.1 The impact of solid waste (SW) on GDP
Having a greater understanding of the SW that is generated in Colombia and how it is classified and measured, are important aspects towards the valorization of SW and its positive effect in the GDP. In other words, if a more efficient use can be given to the raw materials in Colombia, this will increasingly be reflected in the country’s productive efficiency, which in turn, will improve the performance of its GDP. The opportunity to improve how SW is used by creating more, new and better products, will also contribute to increasing the GDP of sectors that establish the conditions for managing and utilizing SW. This not only applies to Colombia, but to Latin America and to LAC as well (see Figure 6]. A direct relationship can therefore be drawn between the production and the generation of SW. This relationship can determine the levels of productive efficiency that different countries can have, for example, when a country has significant production but the generation of its waste is minimal, resources are being used in an optimal way. In contrast, low production with a high generation of waste is an indicator of inefficient practices.
Although the municipal solid waste by weight is in the main interests in Colombia, the current investigation was more centered in the effect of the GDP from mining and quarrying, and construction and transportation. The main reason is that these areas not only are important for the economy of the country, but also because its numbers are less known and thus less research and companies are willing to give solutions to the recycling and economic model of this sector. However, the relation of the selected sectors of the GDP with the municipal solid waste is direct from the transportation and further investigation must be conducted in this line. More details have been discussed and reported recently [39].
5.2 Sustainable and circular economy for development
As described by authors Amory B. Lovins, L. Hunter Lovins and Paul Hawken in their book Natural Capitalism: Creating the Next Industrial Revolution, the paradigm of a new economic model that can counter the adverse effects of production and consumption provides important alternatives that ( similar to a linear economic model ( allow for growth and development, but with a sustainability focus. This prevents the system of production from slowing the economy [39]. These alternatives also introduce new proposals that serve as natural restoration models and that can create innovative methods for fostering competitiveness and ensuring the feasibility of companies. This analysis provides important points that help to determine that circular economy has become a development alternative that should be assessed, tested and implemented by countries that have great impacts on the world and that can analyze the results that have been achieved by economies with significant degrees of development (EU, China, and some other countries). In developing countries (although the circular economy has not been fully implement even in the world main economies [40]), with innovation in science and enginnering this concept can be implemented and bring new leading business that drive the country towards a better economy. Therefore, although Colombia still has a lot of work to do towards a sustainable environment, is now in the right route, since not only the government started taking actions towards this goal, but also new generations are more committed for the sustainability of the planet.
5.3 Waste in Colombia: A development opportunity
Identifying, classifying and measuring SW, serves as a foundation to implement initiatives to address SW and utilize them. This applies both to the reuse of SW in industries where reuse is feasible, as well as to the creation of new business opportunities that decrease the waste. Therefore, making possible to reduce landfill disposal and develop production policies with clear sustainability guidelines. Last, the composition of SW in Colombia includes textiles and wood, which demonstrates and opportunity for innovation in these sectors, as has already occurred in other regions. Several innitiatives from industry and academia have as main goals the waste recycling, [41-45] the manufacturing of green materials [46, 47], the circular economy [48], the development of low CO2 footprint manufacturing [49-51] and the energy harvesting [52, 53]. Other works have been very diverse and developed not only in the biggest urban areas but also in small cities with topics important for the country that include mining, organic waste valotization, metals and plastic recycling: [54-59].

