




 English (pdf)
 Article in xml format
 Article references

 Automatic translation
 Send this article by e-mail
 Cited by SciELO
 Cited by Google
 Similars in
SciELO
 Similars in Google

 Permalink


Introduction
The methods used to integrate, examine, model, visualize, and interpret big data are the subjects of what is known as analytics. Data analytics in higher education institutions (HEI) provides important prospects to examine, understand, and model pedagogical processes. However, one of the main challenges in academic analytics has been integrating large data volumes that come in diverse formats from different academic sources and often need to communicate with each other. The use of data can improve higher education (HE) practice by enabling more effective decision-making based on evidence and formulating responses to address global trends.
An analytic study can be classified depending on the type of information that it intends to extract from the data. For example, the descriptive analysis aims to define a current situation by depicting and summarizing historical data on students, teaching, research, policies, and other administrative processes1.
The main challenges in integrating big data and academic analytics are the generation and collection of data; the integration, transformation, and processing of data, considering challenges of volume, variety, variability, velocity, and veracity, among others; and the construction of analytics tools for visualization to support decision-making, assess scenarios, measure performance, and communicate the most likely scenarios to different HE actors 2.
Due to the complexity and variety of sources of data that HEI may have, some authors proposed four components (institutional analytics, information technology (IT) analytics, academic analytics, and learning analytics) to develop a conceptual framework that describes big data in HEI 3. IT focuses on strategic decision-making, using policy, instructional, and structural analytics to increase the ability to make appropriate decisions based on data. Academic analytics aims to effectively measure, collect, interpret, report, and share data on operational activities related to educational programming and identify students' strengths and weaknesses, whereas learning analytics centers on the learning process.
The potential of education analytics is very significant. Using it as a basis for decision-making can be fruitful as using historical data and information helps not only understand what occurred but also predict what is most likely to occur in the future and what preparations are needed to address those most likely scenarios 4,5. It is necessary to understand the information housed even internally in HEI. Thus, there are still better research opportunities in integrating what is known as big data and academic analytics. There are challenges inherent in these two areas that have not been addressed in an integrated way through a structured methodology that allows transforming large volumes of data into useful, accessible, and transparent information for decision-making in HE. Regarding the implementation of analytic tools in HEI, many of the above studies have focused on developing data-based tools that are assumed to be available in most HEI.
Student dropout in higher education (HE) is a complex phenomenon that has been studied from different perspectives 6-12. With analytic tools, it is possible to measure, collect, interpret, report, and share data to identify factors that affect the student dropout phenomenon. Despite the positive outcomes that analytic tools may produce in identifying student dropout factors, only some academic program administrators have adopted these tools.
For this reason, this paper presents the general design and implementation of an academic analytics dashboard in HE, called ADHE, to support the decision-making process of educational program administrators.
In Colombia, a public institution is responsible for evaluating the country’s education quality (Colombian Institute for the Evaluation of Education - ICFES). This evaluation is assessed through national tests administered to students at all educational levels in the country. ICFES conducts tests in the third and fifth years of primary education called Saber 3° and Saber 5°, a test in the fourth year of secondary education called Saber 9°, and a test in the last year of secondary education called Saber 11. This test assesses areas of mathematics, language, social sciences, natural sciences, and English language. Notably, during the tests, sociodemographic and economic data are collected; these data supplement any analysis resulting from the evaluation of academic performance. The results of all these HE quality assessment tests are stored in ICFES databases. Universidad de Antioquia, where the analysis presented in this document takes place, has specific admission tests or criteria. In this case, the specific admission test consists of two competencies: reading comprehension and logical reasoning. The results of admission tests are stored in UDEA databases. Thus, the potential for integrating information from different sources, not necessarily within the same HE institution, is evident. Then we integrated information and development ADHE, an Academic Analytic Dashboard in Higher Education.
This paper is divided as follows. The first section presents theoretical fundamentals to analyze HE data; in this section, we describe the background of the research on analytics in HE and related work on academic analytics and dashboards in HE. The second section presented the methodological framework, including information such as the big data processing pipeline and dashboard planning. In the third section, we present the construction of an information visualization tool as a Dashboard and the main findings related to the student dropout problem. The fourth section corresponds to discussion results about three topics: 1) the impact of the academic analytic Dashboard in HE, 2) the integration of information in HE from different sources, and 3) the characterization of student dropout in an HEI. Finally, we presented the main conclusions and suggestions for future work.
Theoretical fundaments to HE data
Several features characterize data as big data in HE. Some authors discuss certain key features, including 1) a large amount of information about academic and learning processes and socioeconomic and academic student characteristics through longitudinal student data 4. The information must be stored, processed, transferred, analyzed, and presented, for example, to examine student performance patterns over time. Also, 2) HEI data can be updated and generated frequently due to admission and assessment processes, graduation, dropout, etc. Finally, 3) data are in diverse structured and unstructured formats that are generated in teaching, learning, and assessment activities. These characteristics make HE an area where analytics can be beneficial for exploiting and classifying complex information found in large and diverse data sets.
2.1 Analytics in HE
Analytics applied to education have had various objectives: 1) To use analytics to facilitate the initial processing of data through the integration of information sources and technological subsystems 5; 2) to predict the academic performance of students according to their context (social, family, economic, etc.) 6; 3) to analyze the degree of association of the variables that influence students’ performances 14; and 4) to develop interactive information visualization tools that, taking as their scope the development of exploratory analyses of academic variables, serves as an input for decision-making that can increase efficiency in HEI 15.
Many of the studies in educational analytics have been concerned with collecting and analyzing information on student academic performance, student effort, and the demographic context of each student. Other studies have developed student dropout analysis management systems in Engineering programs, helping to determine student dropout factors methodologically 16,17. However, regarding information from preuniversity academic performance, social behaviors, and possible feedback from teachers and instructors, few studies can be found 11,14-16,18-20.
Some authors have studied the aggregation of information from the different technological subsystems of a university, identifying the potential of education analytics for use in decision-making and improving management activities related to student performance and institutional and administrative issues; furthermore, synthesized successful analytics practices in HE in different institutions and highlighted relevant aspects, such as the fact that sources and types of data used in education analytics have changed dramatically over the years; the success of analytical studies in this field may depend on the effectiveness of the integration of data, which not only come from different sources and are structured in different ways but are also generated in large volumes. The more data there are and the more diverse they are, the better and more fruitful the results will be. Other authors noted the importance of integrating and visualizing information through an analytical tool and suggested a feedback process to allow automated warnings so HEI can make timely and effective responses 5,9,10.
Types of analytics in HE
HEI should be able to make analytics actionable, implementable, and executable 21. Performing descriptive analytics with these characteristics requires the capacity to collect data, measure performance and monitor performance constantly to obtain an evaluative overview of programs and the institution. The context of predictive analytics requires projecting and analyzing relationships between variables and events to gain a comprehensive understanding of information. This involves translating the data into correlation and regression models, which can then be integrated into the decision-making process. Finally, in prescriptive analytics, it is essential to create and use optimization and decision models to guide the implementation of alternatives with a more significant impact on the objectives and to discard those with less impact. Understanding the complexity associated with analytics tools, from data collection to constructing these tools to obtain useful results, is the most important step in integrating analytics into strategy 22,23.
The tools of descriptive analytics have great potential that must still be explored. As evidenced in studies, graphical tools designed to display exploratory visual analyses not only help test hypotheses more easily but also support decision-making and ensure proper monitoring of information 15. Furthermore, the analytics tools applied in education are not limited to a single objective. These studies include tools for data processing that address the challenges associated with big data and large volumes of data, facilitating the integration and manipulation of information from different sources 5,14,15 tools focused on visualization through web platforms and applications specializing in the visual descriptive analysis 15; and machine learning tools, predictive analytics, probabilistic and supervised learning models, such as logistic regression, decision trees, and support vector machines 24.
Academic analytics in HE
Regarding the specific objectives with which academic analytics studies have been developed, some prevail within the academic analytical literature are 1) to facilitate learning and academic progress; 2) to strengthen the effectiveness of learning support strategies; and, to a lesser extent, 3) to improve administrative effectiveness 12. Thus, from the analytic perspective, the first objective seeks to improve academic performance; the second objective proposes to support students in the early stages of their programs to ensure academic success and provide information to generate warnings to identify and assist at-risk students; and the third objective attempts to provide information to improve curriculum design and for well-informed management decision-making regarding the recruitment, admission, and retention of students.
The student dropout phenomenon is articulated with the objectives of academic analytics. Studies focused on early detection of high-risk status among students who are generally at higher risk of dropping out of HE has been developed 10,19-23. This enabled enhancing early strategies to support and intervene with the most vulnerable students, increasing their academic success and the effectiveness of the strategies themselves. Other authors have studied strategies for supporting permanence and intervention. Understanding the factors that affect student retention has become essential in the retention analysis. The study analyzes academic and psychological factors through structural equation modeling.
In business intelligence, the clean-up and preprocessing stage of data is crucial in the analytics processes, and it is not accidental that it is one of the most extensive stages. It also assesses the potential of dashboards, constructed and processed appropriately, to serve as a pivotal tool and offer dynamic yet impartial environments that cater to the informational requirements of decision-makers and end-users alike 28.
Dashboards in HE
Studies that have developed dashboards in HE have focused on learning analytics 29,30 and academic analytics 15,22,31,32. In learning analytics, VisMOOC 29 is a visual analytic system to help analyze user learning behaviors by using video clickstream data from MOOC platforms and exploring video utilization from multiple perspectives. In academic analytics, the visual analytics tool for exploratory analysis of Academic Analytics. The tool supports various interactive data visualization methods and develops a web platform capable of managing the metadata of medical and health programs, with constant updates that support curricular innovations and their adoption within academic programs to increase their effectiveness. Additionally, visual analytics systems not only help instructors and education experts understand the reasons for student dropout but also allow researchers to identify crucial features that can further improve the performance of the models. Moreover, although it is a much more theoretical tool, it serves as a starting point to apply analytics tools and highlights the need to propose generalizable strategies for many more processes in HE.
Methodology
To understand the relationship between student dropout and academic and socioeconomic factors of students in HEI, we used the methodology of named “big data processing pipeline” 2, slightly modified for this study. The methodology shown in Figure 1, considers five phases: data acquisition, data integration, data cleaning, data transformation, and finally, visualization.

The data analyzed in this paper were taken from the data repository of the Colombian Institute for the Evaluation of Education, DataIcfes 33, and the institutional information system of Universidad de Antioquia. The data analyzed comes from three databases. The first set of databases was obtained from the DataIcfes repository, and it contains the results of the Saber 11 test between 20061 and 20172 and factors associated with the student and school. The second database, the admission dataset, was obtained from the institutional information system of Universidad de Antioquia and includes the results of the entrance tests of applicants to programs of the engineering faculty between 2010 and 2018, in addition to factors associated with the students and with admission. The third database, referred to as the dropout dataset, comprises data about the academic performance of students within the engineering faculty from 2010 to 2018, along with factors related to both the students themselves and the program in which they were enrolled. Table 1 shows the number of students in each database.
Table 1 Number of students in each database
| Database | Number of students |
|---|---|
| Datalcfes | 6,579,352 |
| Admission | 30,548 |
| Dropout | 6,859 |
Table 2 Variables in database
| Type | Variable |
|---|---|
| Demographic | Gender |
| Family background | Father’s educational level |
| Mother’s educational level | |
| Financial | Family income |
| Social stratum | |
| Pre-enrollment | Saber 11 test scores |
| School emphasis | |
| School type | |
| Monthly tuition payment | |
| Social stratification in school | |
| Multidimensional poverty index of high school | |
| Enrollment | Reading comprehension score |
| Logic reasoning score | |
| Admission year | |
| Admission type | |
| Admission program | |
| Semester-related | Semester GPA |
| Range | |
| Academic level | |
| Other programs |
In the data integration phase, the three databases were related. In the first instance, the dropout and admission databases were related; the student information, the engineering program to which they were admitted, and the school code were used as a filter. Once these two databases were related, we proceeded to relate them to the Saber 11 database and used student information and school code as a filter. In the data transformation phase, some variables were transformed and created. The number of students in this database was 6.593, registered in 12 on-campus programs, 11 distance programs, and four online programs. Table 2 shows the dataset variables after the fourth phase of the big data processing pipeline. The database contains demographic, family background, financial, pre-enrollment, enrollment, and semester-related variables.
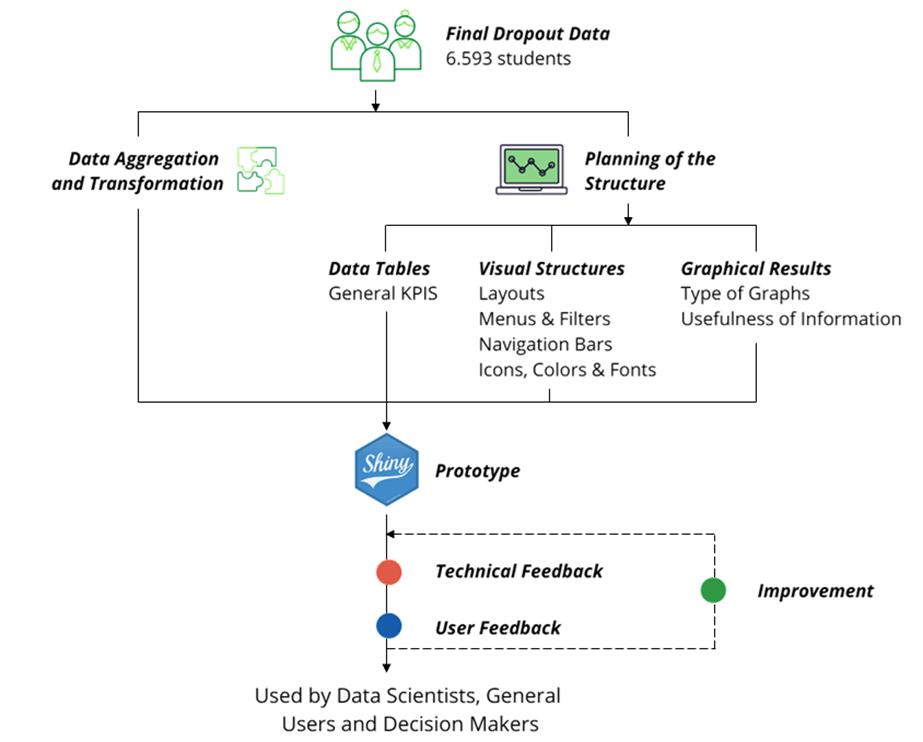
Figure 2 presents the methodology used to develop the dashboard to visualize the information obtained from the final dropout database. The proposed methodology consists of a series of steps that include consolidation of the database, planning of the visualization structure, prototype development, and dashboard improvement using feedback from users and decision-makers.
Within the planning of the visualization structure, the following methodology was carried out for the final graphical display of the results of the descriptive analytics study. First, the different hypotheses that the data could help answer were posited, and based on this, other sections were conceived for the dashboard. There would be a section that grouped the different academic variables for the whole faculty, for each program, and for each academic level; in this way, academic performance could be related to the student dropout problem. Another section will present the results of the knowledge assessment tests that everyone must pass before having the status of a university student and subsequently, the status of having dropped out of HE. A third section would relate the students’ social, economic, and family variables to give them context and understand the different dimensions of the student dropout phenomenon in HE.
The dashboard was developed in the Shiny package of the programming language and environment for statistical computing R. To construct the dashboard, we used functions of the Shiny 34, shinydashboard 35, shinyWidgets 36, ggplot2 37, plotly 38, dplyr 39, DT 40, and viridis 41 packages. Finally, the feedback was carried out with the Department Directors, the Curriculum Development Committee, and the Vice Dean of the Faculty under study, where the importance of having a variable that would allow segmenting and analyzing the results according to specific periods of interest was evidenced.
Results
The construction of an information visualization tool is the main technical result of the proposed methodology. The visualization tool ADPHE allows for transforming large volumes of data from different sources into visual information relevant to decision-making and understanding the student dropout phenomenon in HE. Thanks to the interactive and graphical structure of the dashboard, it is feasible to effectively communicate the most pertinent aspects of the problem to all stakeholders of the academic community, including students, parents, teachers, administrators, and so on. The ADPHE dashboard was built using the R language programming R, and it is hosted at shinyapp.io service, which is available to any user at the URL https://fhernanb.shinyapps.io/AppPermanencia/. The structure of the developed ADPHE dashboard is shown in Figure 3.
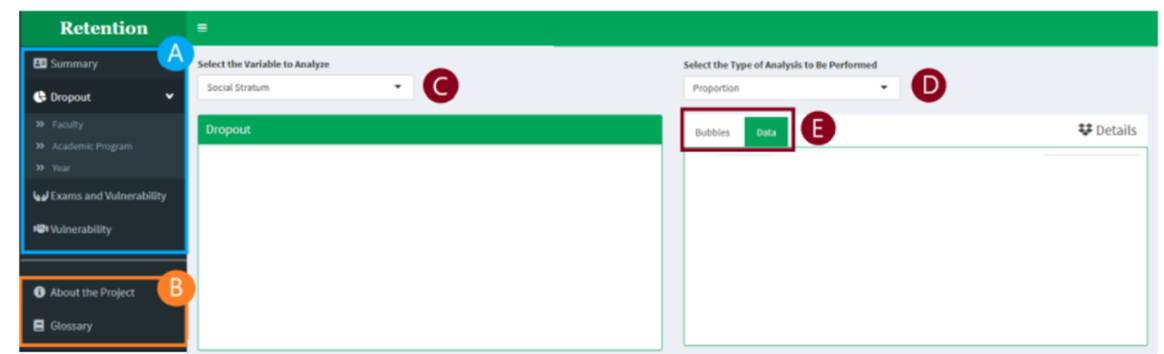
Marker A in Figure 3 groups together the four main sections of the application: Summary, Dropout, Vulnerability, and Exams and Vulnerability. In the Summary section, proportional and absolute frequency analyses are presented on some socioeconomic variables generally associated with the student dropout problem; in this section, the most important information is summarized through bar charts, bubble charts, and frequency tables. The Dropout section is divided into three parts. “Faculty” allows evaluating the relationships between up to two academic and socioeconomic variables, and “Academic Program” enables analyzing different academic variables for each on-campus academic program of the engineering faculty, using graphs and key performance indicators, such as dropout proportion and dropout average GPA. Finally, “Year” presents a history of the dropout proportion by academic year and program from the 2011-1 academic semester to the 2017-2 semester. It also allows comparing up to two academic programs for different time windows. The Exams and Vulnerability section provides information on the scores obtained by students on each of the admission tests and the Saber 11 test, according to their family and socioeconomic context. In this way, it is possible to determine whether the conditions of the individual who dropped out of their HE program could have ultimately conditioned their performance on the tests. Finally, the Vulnerability section allows comparing two important variables: the type of admission and academic level of dropout students, with many of the variables that characterize students socially and economically.
In contrast, marker B in Figure 3 shows the two complementary sections of the dashboard. The About the Project section presents the study’s technical file and relevant information for researchers and decision-makers. The Glossary section contains all the important terms to understand the graphics and information presented in the dashboard.
An example of how the drop-down lists of variables to analyze are presented in each of the sections is presented in Figure 3, specifically in the C marker, where in this case, the social stratum variable is selected as an example. Marker D exemplifies another drop-down list type in the application; these lists are not related to variables but rather to how the users want to visualize the information. Finally, the E marker shows that each section contains a tab box with supporting information or with display alternatives; in this case, the information can be visualized using frequency tables or alternating to a bubble chart.
Main findings related to the student dropout problem
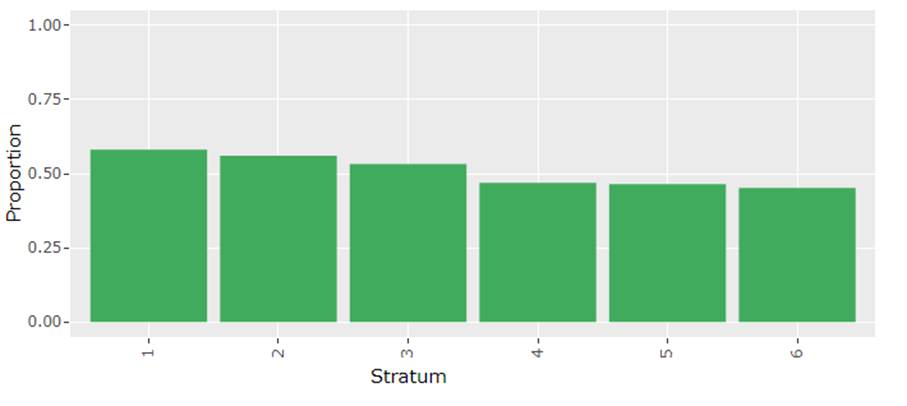
It is commonly hypothesized that economic conditions determine whether a student will drop out of HE over time. It seems almost a preconceived idea that the higher the student's socioeconomic stratum (better their socioeconomic conditions), the lower their probability of dropping out. As shown in Figure 4, one of the main results in the dashboard is that, when a proportional analysis of the dropouts is carried out, the ratios of student dropouts do differ greatly among socioeconomic strata. We applied a Pearson's chi-squared test to compare the dropout proportions through social stratum and found a
p-value=1.485x10⁻¹¹, meaning there is a difference between the proportions. This shows that socioeconomic level is a determining factor in the student dropout phenomenon, as is commonly thought. This pattern is similar to other factors, such as gender (p-value < 2.2x10⁻¹⁶) and type of high school
(p-value = 3.653x10⁻⁹) where the student studied; in these last variables, there is less difference between proportions.
Another important result is presented in Figure 5, which shows the dropout proportion by type of admission to the university. Notably, the type of general admission is through the admission test (POR-EXAM), where the two measured competencies are logical reasoning and reading comprehension. However, the figure presents up to 13 other types of admission, most structured as equitable admission strategies for groups generally considered vulnerable, such as negritude (NEGRITUD) and indigenous (INDIGENA) groups. In these types of equitable admission strategies, the dropout proportion is much higher than the proportion of the general exam method. This indicates that although inclusion efforts exist, they do not remain effective over time, since many of these vulnerable students also end up dropping out. Types of admission related to a change of program (CAMB-PRG) or modality (CAMBMODA) have the lowest dropout proportion since, generally, when a student decides to leave one academic program to enter another, it is because he or she has gone through a process of internal reflection and is firm about what he or she truly wants for his or her professional life, and such students rarely leave an academic program again.
Notably, the type of admission with the highest dropout proportion is AJUPEI; the university conceived this admission strategy as an alternative for those who obtain scores close to the admission exam cut-off score but still need to be admitted. This strategy is aimed at helping people in rural areas, and people registered for admission in seats of the university other than the main campus. However, this admission strategy has yet to prove effective, and decision-makers should re-evaluate it or implement complementary strategies to guarantee the permanence of those who enter with a lower performance.
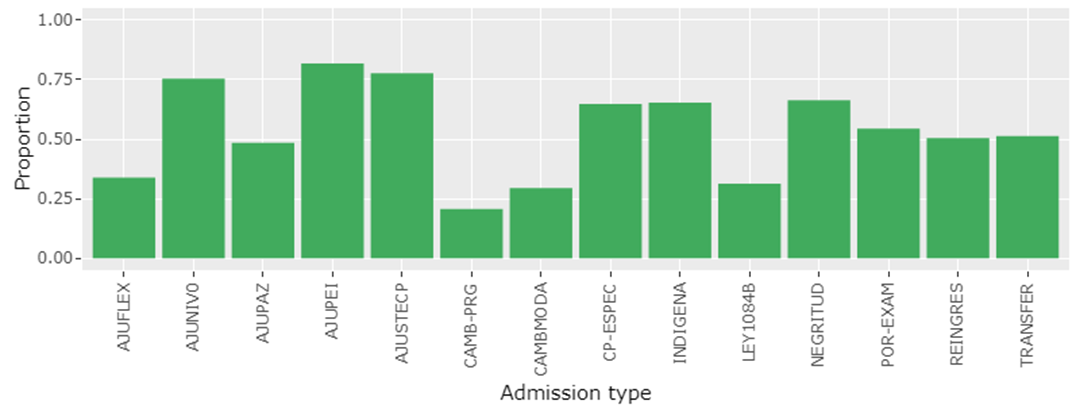
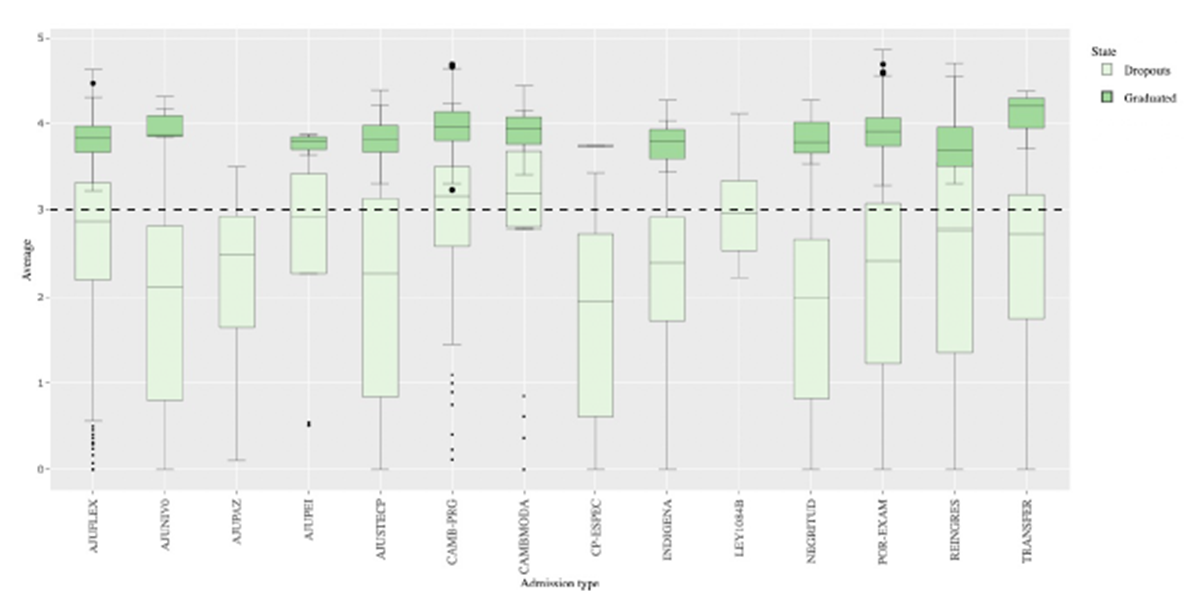
Figure 6 presents the distribution of the cumulative GPAs of students who dropped out of their academic program and who finished their educational program, about the type of university admission. In the case of those who dropped out of their academic program, it is shown that for almost all types of admission, at least 25% of students (Q3) dropped out with a cumulative GPA above the passing grade (3.0); that is, at least 25% of students in almost all types of admissions dropped out for reasons beyond academics, which might include motivational or curriculum-related factors. In this case, we applied the Kruskal Wallis test to verify the difference between the type of admission according to the GPA of students who dropped out, obtaining as a response that there is a difference in the GPA according to the type of admission. In the case of those who finished their academic program, it is shown that for almost all types of admission, at least 25% of those who completed their academic program had a cumulative GPA above 3.5. As in the previous case, the Kruskal Wallis test indicated that there is a difference between the type of admission according to the GPA of graduated students.
As expected, the figure shows that the GPA boxplot for graduated students lies above the GPA boxplot for dropout students.
Regarding the academic dropout level, Figure 7 shows the panorama of an academic program - in this case, industrial engineering. However, the pattern is generalizable to the other academic programs of the engineering faculty. Moreover, it is a pattern in which early student dropout is predominant; the most significant number of students drop out of their academic program at levels 1, 2, and 3.
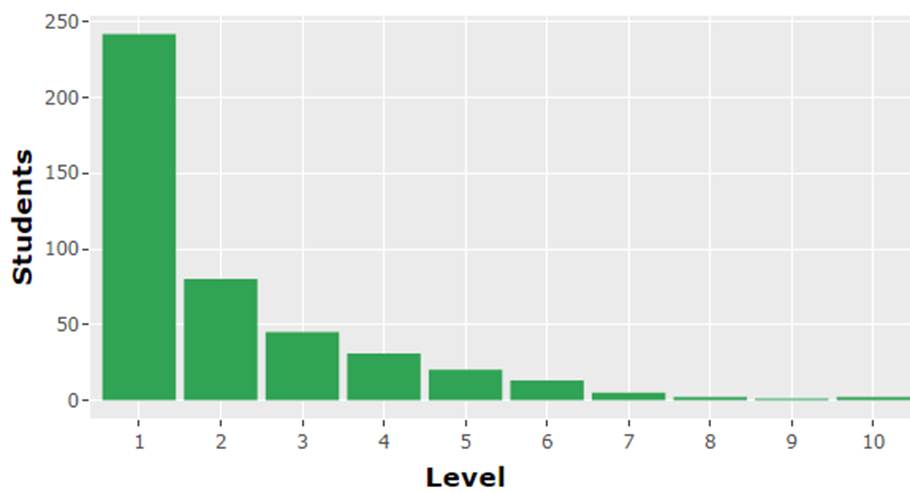
Likewise, the indicators presented in Figure 7 show that in the industrial engineering program, 17.05% of students dropped out in the first semester, and almost 30% dropped out in the first half of the academic program (levels 1 to 5). However, only 2.33% of students dropped out once this threshold was passed.
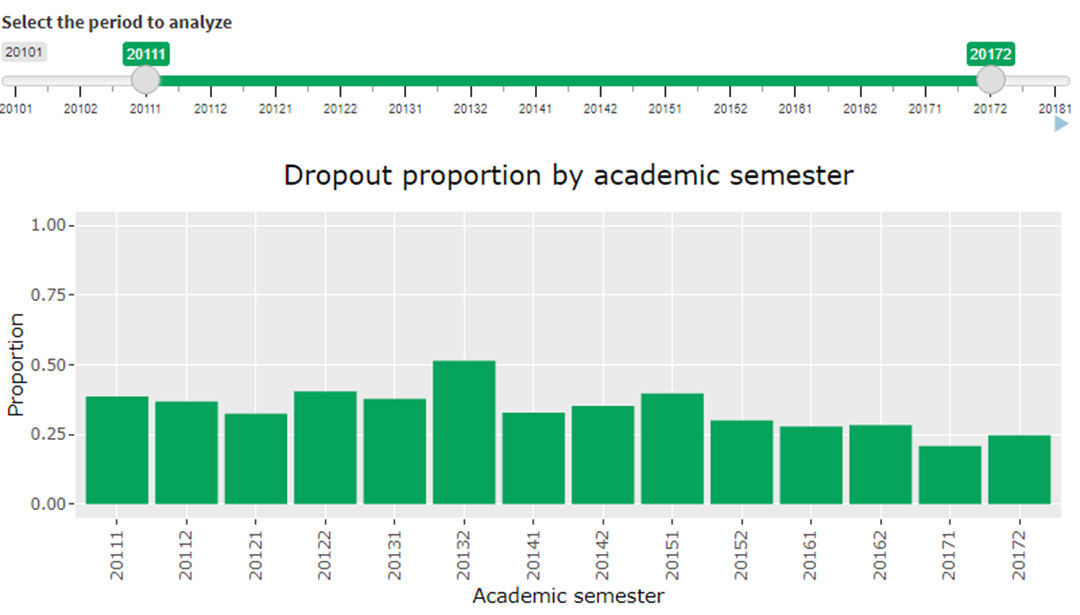
Analyzing the student dropout phenomenon by academic year, using the case of the industrial engineering program again, Figure 8 shows that the dropout proportion is not constant over time; in some academic semesters, it is higher, indicating that it is a dynamic phenomenon that is also affected by temporary problems or by time-dependent relationships. Moreover, in a specific semester, it is possible to find social, economic, academic, curricular, or other changes or phenomena that influence the increase in the dropout proportion.
In contrast, as shown in Figure 9, the analysis of the score obtained on the logical reasoning test by students who dropped out of their academic program concerning socioeconomic stratum reflects that, among students who dropped out, those belonging to the highest socioeconomic stratum scored better than those at the lowest stratum. Comparing dropouts and graduated students through the Kruskal Wallis test, we found the logical reasoning score was different in strata 1, 2, 3, and 4, which indicates that the performance in this test is a protective factor for permanence. In the case of social stratum 5, no differences were observed between the scores obtained by the two groups, which points out that student dropout in social stratum 5 is not due to the ability in logical reasoning. In social stratum 6, despite the high performance in the logical reasoning test, we observed a student dropout of 100% of the students. Figure 10 shows similar findings with the mathematics test of the secondary school.
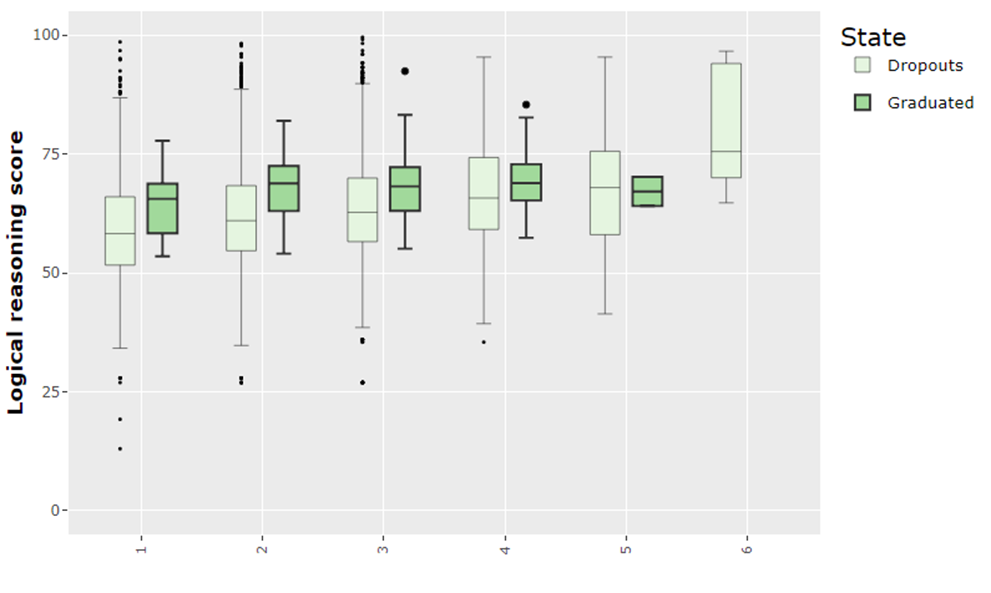
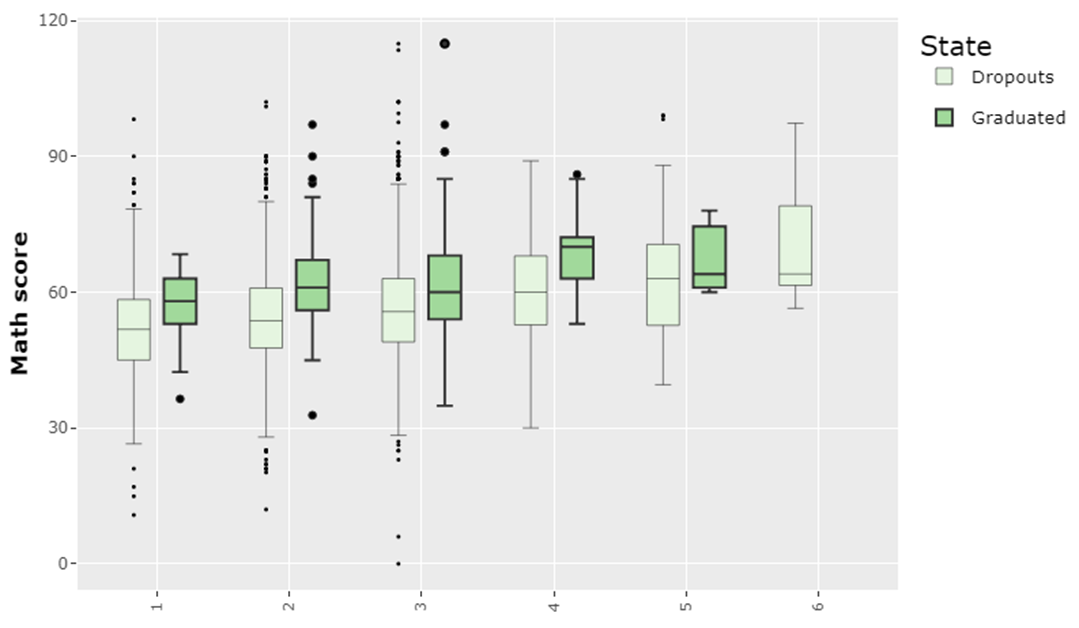
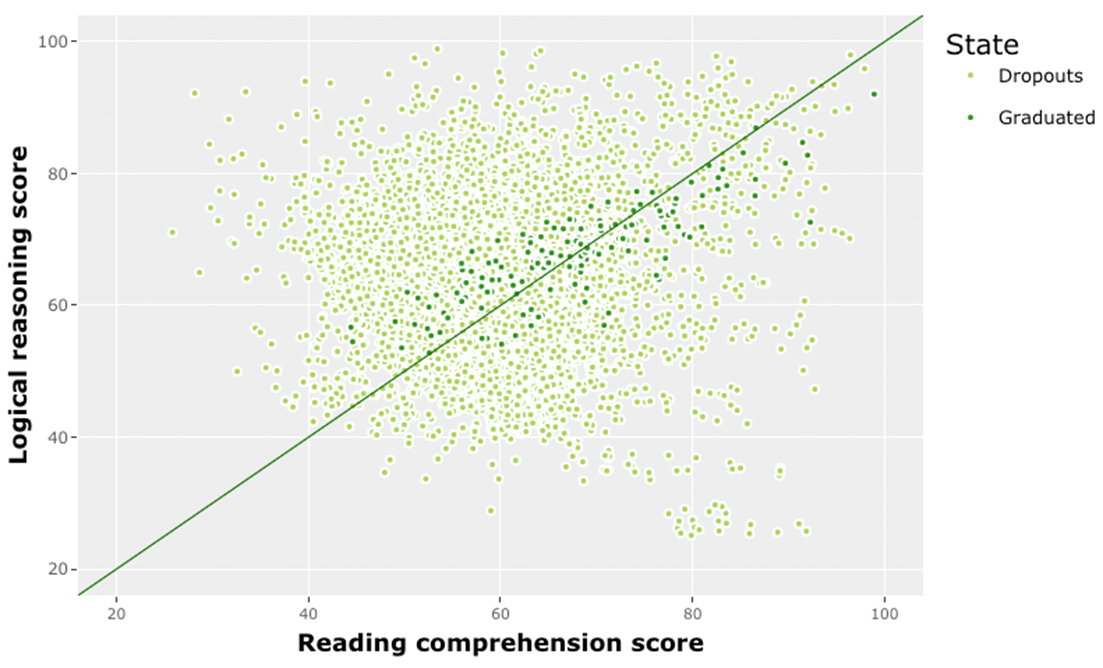
Figure 11 shows a scatter plot between the scores obtained in the university entrance tests (logical reasoning and reading comprehension) for dropped out and graduated. We note that graduated students tend to have equal scores on both tests, which means that having balanced scores on the two tests represents a protective factor for permanence. In contrast, we note that dropped-out students had unbalanced scores on both tests. This fact shows that engineering is not only connected to abilities in quantitative analysis but rather that the two abilities complement each other.
Discussion
This paper presented a methodology to integrate information from different academic sources and proposed the ADHE with demographic, academic, social, and economic information on students before and during their professional studies at specific higher education institutions. The objective of the study was to integrate and visualize student information that would allow academic administrators to visualize the relationships between student dropout and demographic, academic, and social factors. The discussion is structured according to three characteristics: 1) the impact of the academic analytic dashboard in HE, 2) the integration of information in HE from different sources, and 3) the characterization of dropouts in an HEI.
Impact of academic analytic dashboard in HE
This paper shows an ADHE that supports student dropout analysis. Some of the origins of this research are supported using open data from ICFES and its integration into information from the study institution, in addition to the institution's interest in understanding the relationships between student dropout and factors associated with students. The implementation of ADHE would support an academic analytic program and, according to 4, dashboards like this allow identification and appropriate rectification of operational activities related to academic programming and student strengths and weaknesses.
Improvements on the ADHE could focus on providing constant updates of data. Developing tools as web platforms with constant updates support their adoption within academic programs and increase their effectiveness. The ADHE could update student information on a semesterly basis to offer insights into student attrition analysis, as certain factors may fluctuate over time. Additionally, the ADHE could possess an in-house data preprocessing tool to evaluate and enhance the data quality for dependable analysis. Moreover, data preprocessing is critical since it enables the extraction of high-quality output information from large educational data sources, such as the present case 2,14.
Integration of information in HE from different sources
Incorporating data from various sources should not be treated as a static process, as data continues to be generated at an increasingly rapid pace. Information repositories that simply capture data from a single moment in time are not effective, and integration must be ongoing and adaptable to address challenges such as those presented in 4, which include data velocity and variety. As a result, it is essential that integration processes are fast and efficient, and that the dashboards utilized for presenting information are dynamic over time.
On the other hand, it is crucial for dashboards, as a tool for descriptive analytics, to serve as a means of integration for various forms of analytics. Each dashboard undertakes an internal data processing step to present the information in an organized, lucid, and practical manner. However, for a dashboard to be an effective integration tool, it should facilitate the generation of integrated data following the internal processing step. Exporting preprocessed raw data that can serve as input to other analytics such as predictive and make many strategic decisions. Unfortunately, ADHE does not include dynamic integration or data export functions, but it is clear the importance of them as an opportunity for future work and research.
Characterization of student dropout in an HEI
Dashboards and reports play a fundamental role as tools for visualization, tracking, and information consolidation. In this case, the ADHE allows for finding relationships between dropouts and variables related to demographic, social, and academic performance.
From a marginal point of view, ADHE showed there is a difference between the dropout proportion according to social stratum, gender, and type of high school. Also, the main dropout proportion occurred before reaching the middle of the program. This finding allows designing policies and projects to analyze the phenomenon in the first semesters. Figure 6 indicates that student dropout is not solely caused by academic factors. The figure displays that a percentage of students who left the faculty had met the academic requirements, having attained a cumulative GPA above the passing grade of 3.0. Consequently, we propose that HEI could incorporate additional factors such as stress levels, student poverty, lack of parental involvement, and lack of self-motivation, as these factors could heighten the likelihood of student attrition in HE. Moreover, future research could focus on developing predictive models for forecasting early student dropout as well as predicting student attrition on a semester-by-semester basis.
Conclusions
In this paper, we propose an academic analytic dashboard named ADHE, which is a novel tool in academic analytics because it allows us to integrate data from different academic sources and depict the relations between multiple variables interactively. ADHE can be used for decision-makers to evaluate the relationship between some variables and student dropout in HEI, and this new knowledge can be used to set future policies to minimize student dropout proportion. This visualization tool, the result of using descriptive analytics, can also serve as a basis for further studies on predictive and prescriptive academic analytics. This study contributes by encouraging HEI to build their dashboards to share useful information with students, teachers, and administrators.
The integration of information from different sources requires developing a series of technical and business intelligence processes in a structured manner, given that only through an established methodology is it possible to convert large volumes of data - which are also variable, heterogeneous, and generated at high velocity - into reliable, and valuable information. An accurate integration process facilitates the comprehension, cleansing, monitoring, transformation, and delivery of data, which transforms mere numbers, figures, or character sets into reliable and consistent information. This information can be managed in real-time, allowing for more effective decision-making. By utilizing these processes, fields such as academic analytics, which rely heavily on large volumes of information, can optimize their use of powerful data analysis tools. This allows universities to unlock their research potential, align their strategies with their institutional mission, and take timely actions in pursuit of higher-quality HE.
The results of this research show that student dropout is a multidimensional phenomenon where not only economic factors such as social stratum, gender, type of high school, and academic performance play an important role but also motivation, curricular characteristics, and sociodemographic conditions. All these factors interact in different ways and at different levels, making the student dropout problem extremely complex. As a result, the development of student dropout analysis requires the involvement of various disciplines and perspectives, including emotional, psychological, and social dimensions, as well as factors related to academic performance, which can be objectively measured using indicators that capture student characteristics. Thus, it is in this context that descriptive analytics maximizes its potential since it allows for identifying relationships between variables, obtaining conclusions, and improving decision-making from objective behaviors and logical structures.
Future work may be focused on keeping the dashboard updated, integrating the dashboard with other HEI information sources, and including some manner of user manipulation/selection of variables and statistical tests. In addition, we will work on the types of intervention according to the results obtained.

