


 English (pdf)
 Article in xml format
 Article references
 Send this article by e-mail
 Cited by SciELO
  Cited by Google
  Similars in
SciELO
Similars in
SciELO  Similars in Google
 Permalink
1. INTRODUCTION
The software development sector has experienced exponential growth in the number of companies dedicated to this activity and the demand for technological products. In this competitive landscape, software quality has become a key factor for standing out in the market and maintaining a solid customer image. Poor quality can affect a company's reputation and lead to significant financial losses. Hence, activities related to assessing and improving software quality and development processes have gained unprecedented relevance [1].
Well-defined, continuously managed processes are essential to achieve high-quality products. As Sarwosri et al. [2] noted, a quality product can only be obtained through a quality process planned and executed with discipline, both at the individual and team levels. However, despite the methodologies addressing this challenge, adequate tools to facilitate the collection and management of metrics are still lacking, which is crucial for measuring and improving development processes [3].
In this regard, formalizing processes and measurement models has become necessary for software companies. Without metrics that allow for the tangible evaluation of process efficiency and progress, it becomes difficult to demonstrate improvements or ensure product quality before market release [4, 5]; however, selecting metrics also poses some challenges.
Moreover, several issues must be considered when choosing metrics. First, they must be carefully selected, as incorrectly defined metrics can divert the project from its objective and deplete the time and resources allocated [6]. The second issue is infinite metrics and ways to categorize them. This overload can lead to shifting priorities and losing focus on the project [6]. Because the issue of metric selection is so important and complex, several structured and formal approaches have emerged to derive metrics and simplify this process [7].
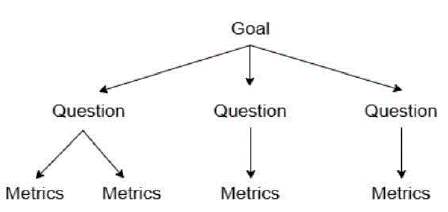
Victor Basili's development of the Goal-Question-Metric (GQM) method stands out. It provides a systematic framework for defining metrics aligned with a project>s specific objectives, avoiding deviations, and ensuring that the measurements are relevant and valuable [6, 7]. The GQM method is based on three levels: defining objectives, formulating questions to evaluate those objectives, and selecting metrics that provide quantitative answers [8, 9]. The structure of GQM is illustrated in Figure 1.
In Software Engineering, metrics are classified into three main categories: process metrics, product metrics, and project metrics. Each plays a crucial role in evaluating and improving development processes, software quality, and project efficiency [10, 11]. The GQM method, with its hierarchical structure and systematic approach, has gained importance as a practical solution for establishing measurements in processes and project outcomes [12].
This work presents a web-based system for metric tracking based on the GQM method, implemented at the Software Development Center (CEDESOFT) of the Instituto Tecnológico Superior de Nochistlán. Between 2022 and 2024, the system managed 22 projects, recording 11,116 planned hours and 11,384 actual hours (a 2.41% deviation), alongside a 92% reduction in post-delivery defects. While the system demonstrated improved planning accuracy and quality control, its evaluation faced limitations such as scarce historical data for comparison. The tool not only automates metric collection and visualization (e.g., costs, defects) but also fosters a data-driven culture, aligned with the strategic goals defined through GQM.
2. METHODOLOGY
This study followed a mixed-method approach, combining the qualitative definition of metrics using the Goal-Question-Metric (GQM) method, and quantitative analysis of project data. The research design was structured into three systematic and sequential phases aimed at developing a web-based application that integrates the GQM method and validating its impact on software project management at the Software Development Center (CEDESOFT).
A. Phase 1: Metric Definition with GQM
GQM was applied to define measurable indicators aligned with CEDESOFT's strategic objectives. The method consists of three hierarchical levels:
Conceptual level (Goals): Three main goals were established, focused on improving time estimation, cost planning, and software quality.
Operational level (Questions): Each goal was associated with a set of questions designed to assess its achievement. These questions targeted process, product, or project aspects.
Quantitative level (Metrics): Specific metrics were defined to provide objective, quantifiable answers to each question.
Tables 1 to 3 present the full breakdown of goals, questions, and metrics, illustrating the systematic alignment between organizational objectives and measurable indicators.
Table 1 Objectives
| Objective | Description |
|
1 2 3 |
Purpose: Optimize project time estimation. Objective: Accuracy in project time estimation. Problem: Errors in time planning cause delays and additional costs in project execution. Point of View: From project management and development team perspectives. Purpose: Optimize accuracy in project cost planning. Objective: Cost estimation for projects. Problem: Inaccurate cost estimates lead to significant overruns and complications in project financial management. Point of View: From project managers and finance team perspectives. Purpose: Raise quality standards for developed software. Objective: Software quality. Problem: The recurring presence of defects and user dissatisfaction negatively impacts software reliability and acceptance. Point of View: From developers, testers, and end users perspectives. |
Table 2 Objectives and Questions
| Objective | Question |
|---|---|
|
1 2 3 |
How many hours are planned per project? How many hours are actually spent per project? How many hours are planned per phase? How many hours are actually spent per phase? What is the total planned cost per project? What is the total actual cost per project? What is the total number of defects during development? What is the total number of defects after software delivery? |
Table 3 Objectives, Questions, and Metrics
| Objective | Question Metric | |
|---|---|---|
|
1 2 3 |
How many hours are planned per project? How many hours are actually spent per project? How many hours are planned per phase? How many hours are actually spent per phase? What is the total planned cost per project? What is the total actual cost per project? What is the total number of defects during development? What is the total number of defects after software delivery? |
Total planned hours per Project Total actual hours per Project Total planned hours per phase Total actual hours per phase Total planned cost per Project Total actual cost per Project Total defects during development Total defects after software delivery |
B. Phase 2: Development of the Web-Based Metrics Management System
Once the metrics were defined, a custom web-based system was designed and implemented to support automated collection, storage, visualization, and analysis of the defined metrics. Key methodological aspects of this phase include:
User Profiling: Two roles were established (client and administrator), each with distinct functionalities.
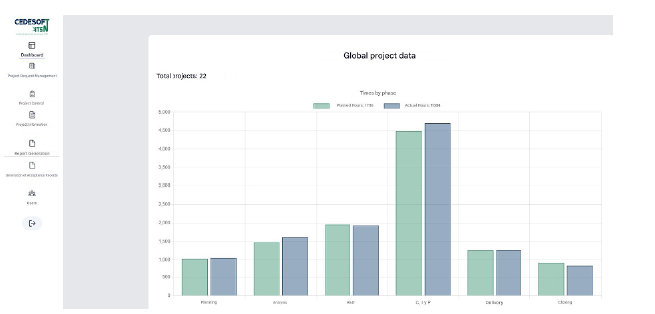
Core Functionalities (Figure 2): The system allowed for the registration of time, cost, and defects; real-time dashboard visualizations; and automated report generation.
Metric Traceability: The system architecture ensured consistency between data collection features and the metrics defined through the GQM method.
This phase focused not only on the technical development of the application but also on preserving the conceptual integrity of the GQM method and ensuring its applicability in real-world software development environments.
C. Phase 3: System Validation and Impact Analysis
To evaluate the effectiveness of the system, a comparative analysis was conducted between projects developed before and after the implementation. This phase included:
Historical Baseline: Seven projects developed between 2021 and 2022 were used to establish pre-implementation benchmarks.
Post-implementation Evaluation: 22 projects developed from 2022 to 2024 were analyzed using data collected by the system.
Comparative Indicators: Key comparisons included planned vs. actual hours, planned vs. actual costs, and the number of defects reported during and after development.
Administrator Feedback: A survey was conducted among CEDESOFT administrators to collect qualitative insights regarding system usability, decision-making support, and cultural impact.
This phase provided the necessary evidence to determine whether the web-based implementation of the GQM method contributed to improving project estimation accuracy, quality control, and data-driven decision-making.
3. RESULTS
This section presents the results obtained from the implementation and validation of the web-based system that incorporates the Goal-Question-Metric (GQM) method at the Software Development Center (CEDESOFT). The analysis compares key performance indicators before and after the deployment of the system to evaluate its effectiveness in time estimation, cost control, and software quality.
A. Time Estimation Accuracy
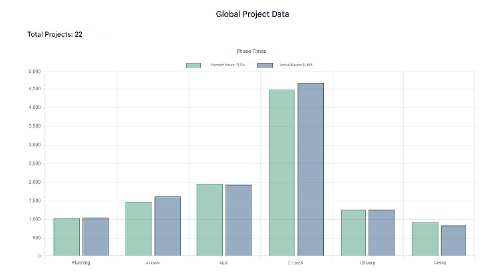
The analysis of 22 projects developed between 2022 and 2024 showed a total of 11,116 planned hours and 11,384 actual hours, resulting in a 2.41% deviation. Phase-specific analysis revealed the following:
The construction phase had the highest deviation (+5.3%).
The testing phase showed the closest alignment (+0.9%).
To assess the system's impact, historical data from seven projects developed between 2021 and 2022 were used, which revealed an average deviation of 4.54% (ranging from 2.82% to 6.25%). Figure 3 illustrates this comparison, showing a 46.92% improvement in time estimation accuracy after the implementation of the GQM-based system.
B. Cost and Quality Metrics
Two additional performance areas were analyzed: cost planning and software quality. Cost Performance:
Pre-implementation data showed an average cost deviation of 12%, thus indicating a 70.8% improvement in cost estimation after using the GQM-based system.
Quality Indicators:
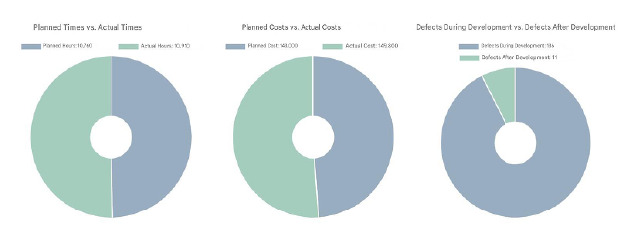
Defects during development: 136 total (6.2 per project)
Post-delivery defects: 11 total (0.5 per project)
This represents a 92% reduction in post-delivery defects compared to the historical average of six per project. These improvements suggest a more controlled development process, likely influenced by more accurate planning and metric-driven oversight, as illustrated in Figure 4, which presents the analysis of Time, Cost, and Defects.
C. Administrator’s Feedback
A survey was conducted among six CEDESOFT administrators (five with over three years of experience and one with less than a year). The key findings were as follows:
System usefulness:
83% rated the system as "Very useful" or "Useful" for decision-making.
100% confirmed that the metrics generated were clear and sufficient for project monitoring.
Efficiency gains:
67% estimated a 70-100% reduction in manual tracking efforts.
One respondent estimated a 40-69% improvement.
Improvements in planning and quality:
All respondents acknowledged significant improvements in project planning.
50% linked these improvements to reduced defect rates.
Cultural impact:
83% stated that the system fostered a metrics-driven culture.
100% reported using system-generated reports frequently during project review meetings.
D. Limitations
Despite the positive outcomes, the study faced the following limitations:
Limited historical data: Only five complete pre-implementation project records were available for direct comparison.
Potential feedback bias: 83% of survey respondents had extensive experience, which may have influenced a more favorable evaluation.
These limitations should be considered when interpreting the results and planning for future improvements to the system or its broader application.
The analysis demonstrated measurable improvements in planning accuracy and defect reduction, while highlighting areas require future optimization.
4. CONCLUSIONS
The results of this study demonstrate that implementing a web-based system aligned with the Goal-Question-Metric (GQM) method at CEDESOFT contributed to measurable improvements in project management, specifically in time estimation, cost control, and software quality. Key findings supported by project data include:
Improved time estimation: The average deviation between planned and actual hours decreased from 4.54% (pre-implementation) to 2.41%, thus reflecting a 46.92% improvement in accuracy. The testing phase showed the closest alignment (0.9%).
Enhanced cost control: Cost deviation decreased from 12% to 3.5%, representing a 70.8% improvement in financial planning accuracy.
Defect reduction: Post-delivery defects dropped by 92% compared to the historical average, indicating significant quality improvements in delivered software.
Organizational impact: Most administrators rated the system as useful or very useful. The system reduced manual tracking efforts and fostered a culture of data-driven decision-making and continuous improvement.
Study limitations included the limited number of historical project records available for comparison (only five) and the need for several refinement cycles during the initial metric selection to align with GQM principles. While no technical issues were encountered, future evaluations should consider scalability testing under high concurrency conditions.
In conclusion, the GQM method, when implemented through a dedicated web system, proved effective in supporting accurate estimation, improving software quality, and establishing a strong foundation for measurement-based project oversight.
Recommendations for future work include:
Integrating risk indicators into the goal-question-metric relationships.
Expanding the historical dataset to strengthen future comparisons.
Conducting stress testing and technical optimization to ensure scalability as project volume increases.
Incorporating industry benchmarks into the goal-definition phase to align with broader quality standards.
The successful application of Basili's GQM method at CEDESOFT reinforces its potential to promote a measurement-driven culture in software development. Sustained alignment with its core principles, along with adaptive evolution of the system, will be essential for long-term success in more complex or larger-scale environments.

