


 English (pdf)
 Article in xml format
 Article references
 Send this article by e-mail
 Cited by SciELO
  Cited by Google
  Similars in
SciELO
Similars in
SciELO  Similars in Google
 Permalink
INTRODUCTION
Tea is an extremely popular beverage around the world which can be served hot or cold. White, green and black teas are commonly consumed teas, obtained from the leaves or buds of the Camellia sinensis (Family Theaceae) plant. Green teas are different depending on their harvesting, processing, and associated degree of oxidation of polyphenols present in fresh tea leaves 1. The beneficial health effects of tea are thought to stem from polyphenols which have antioxidant properties 2. The content of polyphenols in green tea is higher than those of black tea. Tea catechins mainly include four com-pounds, namely, (−)-epigallocatechin-3-gallate (EGCG), that represents approximately 59% of the total content of catechins; (−)-epigallocatechin (EGC) (19%); (−)-epicatechin-3-gallate (ECG) (13.6%); and (−)-epicatechin (EC) (6.4%) 3.
EGCG, is believed to provide for most of the health benefits linked to green tea. The production of green tea is characterized by an initial heating process that inhibits the polyphenol oxidase enzyme, responsible for the conversion of flavonoid into dark polyphenolic compounds. Another important process, in which leaves are cut and twisted to break their cell walls, is called rolling 3. EGCG has both antimatrix metalloproteinase and antiangiogenesis activities and can prevent the formation of solid tumors. In the extraction and preservation processes, EGCG degrades very fast. Degenerated enzyme activity, pH and temperature are the significant factor that affects the degradation of EGCG. By adjusting these factors, degradation of EGCG can be prevented in the extracting process of fresh tea leaves 4. Due to the potential benefits of the green tea catechins especially EGCG, several studies have been conducted on various brewing conditions to maximize the extraction of these components from green tea. The optimal water conditions include temperatures maintained at 80.8°C for 30 min 5. The study using mathematical models by Labbé et al,6, showed the best combination of temperature and time for the extraction process: 50°C during 20-40 minutes for compounds that are time dependent, 90°C during 80 minutes for compounds that are time or temperature dependent, and 70-80°C during 20-40 minutes for caffeine 6.
Green tea is consumed by two thirds of the world’s population 7. Considering the increasing interest in the health properties of tea, especially those with its antioxidant capacity, and taking into account the different types of teas, and the different methods to prepare a cup of tea in different countries which may affect the content of active ingredients in the final preparation of this beverage, it becomes necessary to evaluate the antioxidant activity to determine the changes between process 8.
For this reason, the present study was carried out to determinate total phenolic compounds (TPC), total flavonoids content (TFC); and the antioxidant capacity of four different brands of tea sold in Colombia, by hot and cold extraction in water. In this way, it was possible to establish a relationship between biological activity and temperature of extraction. An HPLC method to identify some catechins, caffeine, and Gallic acid was designed. The present study is a continuation of previous studies conducted by Ramírez-Aristizabal et al,9.
MATERIALS AND METHODS
Tea samples
A set of three commercial brands of green tea (Oriental®, Lipton®, Hindú®) and combinations of green tea with some fruits and aromatic flowers (Jaibel® with Hibiscus sabdariffa and lemon) were used in the assay, to compare cold tea extracts with hot tea extracts. Tea samples were obtained from a local supermarket.
Sample preparation
To simulate the beverage brewing, each brand of tea was used in an aqueous extraction procedure, to study the effect of different extraction temperatures on the total phenolic concentration, total flavonoids content, as well as on the antioxidant capacity.
Cold tea extracts were prepared by adding 150 mL of potable water at room temperature to a teabag that was previously weighed; the infusions remained at room temperature (25°C) for 5 minutes and were agitated manually every minute for 15 seconds, and their temperature were controlled every 30 seconds. Hot tea extracts were prepared by adding 150 mL of potable water at hot temperature to a teabag that was previously weighed; the infusions remained at hot temperature (80°C) for 5 minutes and were agitated manually every minute for 15 seconds, and their temperature were con-trolled every 30 seconds. Initially all samples were diluted at 10000 ppm in distilled water and stored at 4°C for subsequent analysis. In this study, the terms cold tea extract and hot tea extract are used to express these two infusion types.
Total polyphenol concentration (TPC)
The TPC of the different tea samples was determined by Folin-Ciocalteu method described by Sigleton et al, 10. The initial samples with a concentration of 10000 ppm were diluted 1:10 in distilled water, for both cold and hot tea extracts. Then 160 μL of each new sample and a standard (gallic acid) were added to polystyrene cells with a volume of 3000 μL. Afterwards 1420 μL of Folin reagent (1:10) and 1420 μL of Na2CO3 (7.5%) were added and homogenized in the polystyrene cells. Finally, the samples were left for 120 minutes at room temperature in the dark. The absorbance was determined at 758 nm according with the spectral scanning for the equipment used (SHIMADZU UV-1700 spectrophotometer). The blank used was made of distilled water instead of tea; phenolic compounds were quantified using calibration curves of gallic acid (1-60 mg gallic acid /L) and were expressed as mg gallic acid equivalent/g per sample (mg GAE/g per sample). The results are expressed as the mean ± standard deviation.
Kinetics of the reaction was followed for a period of two hours with tea samples and the standard (gallic acid) in order to determine the time stability of the formed complex.
Total flavonoid content (TFC)
The TFC was determined using the method proposed by Kim et al,11. The initial samples with a concentration of 10000 ppm were diluted 1:5 in distilled water for cold tea extracts, and were diluted 1:10 in distilled water for hot tea extracts. Then 150 μL of each new sample and a standard (catechin) were added to polystyrene cells with a volume of 3000 μL. Afterwards 600 μL of distilled water and 10 μL of sodium nitrate (NaNO3, 5%) were added and homogenized in the polystyrene cells; this mixture was incubated in the dark for 5 minutes. Then, a 45 μL volume of aluminum chloride (AlCl3, 10%) was added to the mixture which was incubated for 6 additional minutes in the dark, the extract reacted with aluminum chloride and a pink color appearing after a few minutes indicates the presence of flavonoids according to Zhishen et al, 12. Finally, 300 μL of NaOH, (1 M) were added to the resulting mixture followed by the addition of 360 μL of distilled water. The absorbance was determined at 505 nm according with the spectral scanning for the equipment used (SHIMADZU UV-1700 spectrophotometer). The blank used was made of distilled water instead of tea; total flavonoids content was quantified using calibration curves of catechin, the range of the calibration curve was between (1-30 mg catechin /L), and was expressed as mg catechin equivalent/g per sample (mg CE/g per sample). The results are expressed as the mean ± standard deviation.
Kinetics of the reaction was followed for a period of one hour with tea samples and the standard (catechin) to determine the time stability of the formed complex.
Antioxidant capacity
DPPH assay
DPPH assay was carried out in photometric cells of 3 mL according to the modified method of Sharma and Bhat 13. The initial samples with a concentration of 10000 ppm were diluted in methanol (96%). For cold tea extracts a dilution 1:10 was used, and for hot tea extracts the dilutions were made as follows: 1:10 for Jaibel®, 1:20 for Hindú®, 1:25 for Oriental® and Lipton®. A trolox solution was used as standard; in addition, two controls were used: the positive control was hydroquinone (1000 ppm) and the negative control was methanol (96%). Then 2700 μL of a solution of DPPH (30 ppm) in methanol (96%) were added to polystyrene cells with a volume of 3000 μL. Afterwards 300 μL of the tea samples were added and homogenized in the polystyrene cells. The same was done for the controls and the standard (Trolox). Finally, the samples were left for 30 minutes at room temperature in the dark. The absorbance was determined at 517 nm according with the spectral scanning for the equipment used (SHIMADZU UV-1700 spectrophotometer).
Radical scavenging capacity is the comparison between the decreasing absorbance of the DPPH• radical being reduced by an antioxidant (becoming yellow). The antioxidant capacity was quantified using calibration curves of trolox, the range of the calibration curve was between (10-240 µM), and was expressed as mg TE/g per sample. The results are expressed as the mean ± standard deviation.
Kinetics of the reaction was followed for a period of one hour with tea samples and the standard (Trolox) to determine the time stability of the formed complex.
ORAC assay
Antioxidant capacity of cold tea extract and hot tea extracts was also assessed conducting the ORAC (oxygen radical absorbance capacity) assay, according to the method proposed by Gillespie et al, 14. The initial samples with a concentration of 10000 ppm were diluted in PBS (phosphate buffered saline) 75 mM for cold tea extracts, the dilutions were made as follows: 1:50 for Jaibel® and Hindú®, 1:80 for Oriental® and Lipton®. For tea hot extracts the dilutions were made as follows: 1:125 for Jaibel®, 1:160 for Oriental®, Lipton® and Hindú®. The diluted samples were added to 96-well-microplates; 187 μL of fluorescein (80 nM) diluted in PBS (75 mM) were also added to each well. After an incubation in the dark lasting 15 minutes and hold at 37°C, a solution of AAPH (2,2’-azobis 2-methylpropionamidine dihydrochloride, 140 mM) diluted in PBS (75 mM) was added to each well of the plate. The compound named AAPH is responsible for starting the decay of fluorescein, for this reason it is important to have a very strict control of its addition to the wells. The plate is incubated at 37°C for 2 minutes and then the fluorescence is determined in a fluorescence spectrophotometer (Varian, Cary Eclipse, version 1.1 (135) using an emission wavelength of 493 nm and a filter excitation of 515 nm). It is necessary to record data every 120 seconds until the decay of fluorescein is completed.
The AUC (area under the fluorescence decay curve) for each sample and standard was obtained by subtracting the area of the blank sample (PBS). Antioxidant capacity was expressed as mg TE/g per sample using the linear regression value obtained from the trolox calibration curve between (3-6 µM). The results are expressed as the mean ± standard deviation.
Determination of tea compounds by high pressure liquid chromatography (HPLC)
Cold and hot tea extracts were analyzed on a reverse phase high performance liquid chromatographic system Jasco 2000 which comprises the following pieces: A Jasco MD-2015 detector plus diodes arrangement, an auto sampler Jasco AS-2059 Plus, and a Jasco Oven CO-2065 Plus. The separations were performed in a column (Ultra AQ C-18 150 x 3.2 mm, 3 μm particle); the column temperature was maintained at 35°C. The software used was EZChromElit. The mobile phase was 0.5% acetic acid (solvent A) and a mixture of acetonitrile: ethyl acetate: 0.1% acetic acid in the proportion 10:2:88 (solvent B). Compounds were identified in the chromatograms by comparing retention times of samples with the standards; the respective quantification was accomplished using the method and calibration curves of trigonellin (1,25-20 mg/L), catechin (1-10mg/L), epigallocatechinhalate (50-300 mg / L), gallic acid (5 - 80 mg/L), caffeine (25-400 mg/L), ferrulic acid (0.5-5.0 mg/L), chlorogenic acid (50 - 1200 mg/L), epicatechin (30-250 mg/L), epicatequingalate (5-80 mg/L) and EGC (50 - 600 mg/L) prepared by Ramírez-Aristizabal et al, on the same equipment and under the same conditions 15.
Experimental design
The experimental design used was defined by two factors: temperature, which consists of two levels (Cold tea extract to 25°C and hot tea extract to 80°C), and commercial brands of green tea, with four levels (Oriental®, Lipton®, Hindú®, Jaibel®), these factors were evaluated over the determination of the regressor variables (total phenolic concentration (TPC), total flavonoids content (TFC) and the antioxidant capacity: DPPH radical capture assay, and oxygen radical absorbance capacity (ORAC) assay. Data are expressed as the mean ± standard deviation of the mean of four independent experiments performed in triplicate for three consecutive days. ANOVA’s Tukey multiple comparison test was used to compare the variance in the response variables: total phenolic concentration (TPC), total flavonoids content (TFC) and the antioxidant capacity: DPPH radical capture assay, and oxygen radical absorbance capacity (ORAC) assay, of four different tea brands, and also between two different infusion temperatures, the statistical hypotheses used are shown in Equation 1. The terms µ1, µ2, µ3, µ4... µn refer to the regressor variable response of each of the four brands for each analytical test, therefore four statistical hypotheses were taken into account.
 (1)
(1)
H1: At least one mean is different.
The statistical significance was based on the total error criteria with a confidence level of 95.0%, for this reason P-values less than 0.05 were considered statistically significant. The results were statistically analyzed using INFOSTAT 2008 software to deter-mine the average value, standard error and analysis of variance ANOVA’s Tukey test (significant p < 0.05), the figures were made using GraphPad Prism program.
RESULTS
Total polyphenol concentration (TPC)
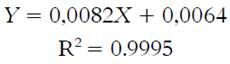
TPC for cold and hot tea extracts are shown in Table 1. TPC was quantified using calibration curves of gallic acid (1-60 mg gallic acid/L); the curve equation is shown in Equation 2.
 (2)
(2)
For cold tea extract the TPC obtained was be-tween: 2.53 ± 0.25 - 14.63 ± 0.53 mg GAE/ g per sample. For hot tea extract the TPC obtained was between: 29.34 ± 0.66 - 55.06 ± 1.03 mg GAE/g per sample. The highest levels were measured in Oriental® for both extraction types: 14.63 ± 0.53 mg GAE/g per sample for cold tea extracts and 55.06 ± 1.03 mg GAE/g per sample for hot tea extracts. Jaibel® contained the lowest TPC for both extraction temperatures: 2.53 ± 0.25 mg GAE/g per sample for cold tea extracts and 29.34 ± 0.66 mg GAE/g per sample for hot tea extracts. In general, the behavior of all samples concerning TPC for these two infusion types, starting from the best, followed this order: Oriental®> Lipton®> Hindú®> Jaibel®. The analysis of variance ANOVA (Tukey’s multiple comparison Test, significant p<0.05) is shown in Figure 1, the difference between letters refers to significant differences of TPC between each one of the four brands of green tea, in cold tea extracts and hot tea extracts, in the following way: Oriental® (B for cold tea extracts and E for hot tea extracts), Lipton® (AB for cold tea extracts and D for hot tea extracts), Hindú® (AB for cold tea extracts and DE for hot tea extracts), Jaibel® (A for cold tea extracts and C for hot tea extracts).
Table 1 Summary, TPC, TFC, DPPH and ORAC results of four different tea brands between two different infusion temperatures.

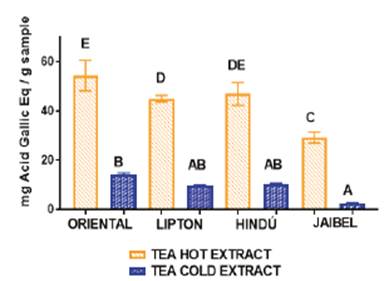
Figure 1 ANOVA, Tukey´s multiple comparison test (significant p< 0.05) of TPC assay of four different tea brands between two different infusion temperatures.
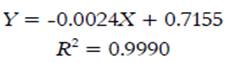
TFC of cold and hot tea extracts are shown in Table 1. TFC was quantified using calibration curves (1-30 mg catechin /L); the curve equation is shown in Equation 3.
 (3)
(3)
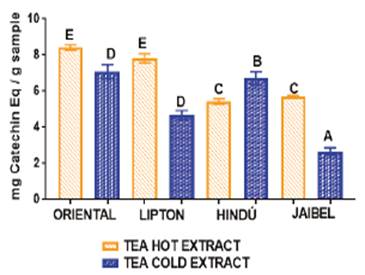
For cold tea extracts the TFC obtained was between: 2.67 ± 0.20 - 7.08 ± 0.38 mg CE/g per sample). For hot tea extracts the TFC obtained was: 5.70 ± 0.06 - 8.41 ± 0.15 mg CE/g per sample. The highest levels of TFC were measured in Oriental® for both extraction types: 7.08 ± 0.38 mg CE/g per sample for cold tea extract and 8.41 ± 0.15 mg CE/g per sample for hot tea extract. Jaibel® contained the lowest TFC for both extraction temperatures. However, the highest TFC was obtained for hot tea extracts in Oriental® (8.41 ± 0.15 mg CE/g per sample) and the lowest was found for cold tea extracts in Jaibel® (2.67 ± 0.20 mg CE/g per sample). The analysis of variance ANOVA (Tukey’s multiple comparison Test) is shown in Figure 2, the difference between letters refers to significant differences of TFC between each one of the four brands of green tea, in cold and hot tea extracts, in the following way: Oriental® (D for cold tea extracts and E for hot tea extracts), Lipton® (D for cold tea extracts and E for hot tea extracts), Hindú® (B for cold tea extracts and C for hot tea extracts), Jaibel® (A for cold tea extracts and C for hot tea extracts).
Antioxidant capacity
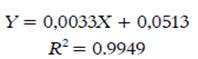
The antioxidant capacity was determined by the 1, 1-diphenyl-2-picrylhydrazyl (DPPH) free-radical scavenging assay, using the calibration curve of trolox (10-240 µM); the curve equation is shown in Equation 4.
 (4)
(4)
And also was determined by the oxygen radical absorbance capacity (ORAC) assay using the calibration curve of trolox (3-60 µM); the curve equation is shown in Equation 5.
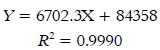 (5)
(5)
The results of the antioxidant capacity for both methods are shown in the Table 1. A similar profile was observed for the antioxidant capacity determined by both methods for the cold tea extract: 22.36 ± 0.98 - 41.29 ± 0.86 mg TE/g per sample by DPPH assay and 22.95 ± 1.31 - 46.25 ± 2.05 mg TE/g per sample by ORAC assay. Similarly, for the hot tea extract the following ranges were obtained: 38.50 ± 0.35 - 110.01 ± 0.23 mg TE/g per sample for DPPH assay and 23.40 ± 1.50 - 113.60 ± 2.30 mg TE/g per sample by ORAC. Jaibel® contained the lowest antioxidant capacity according to DPPH assay for both extraction temperatures: 22.36 ± 0.98 mg TE/g per sample for cold tea extracts and 38.50 ± 0.35 mg TE/g per sample for hot tea extracts. The same behavior was observed for Jaibel® using the ORAC assay for both temperatures: 22.95 ± 1.31 mg TE/g per sample for cold tea extracts and 23.40 ± 1.50 mg TE/g per sample for hot tea extracts. However, the highest antioxidant capacity was obtained for hot tea extracts in Oriental® by both methods: 110.01± 0.23 mg TE/g per sample by DPPH assay and 113.6 ± 2.30 mg TE/g per sample by ORAC assay.
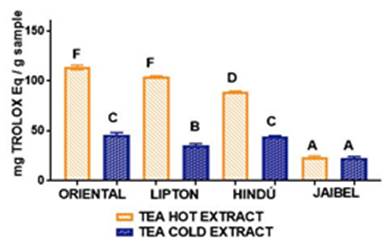
In general, the behavior for all samples concerning antioxidant capacity for these two infusion types by both methods, starting from the best, followed this order: Oriental®> Lipton®> Hindú®> Jaibel®. The analysis of variance ANOVA (Tukey’s multiple comparison Test) for DPPH assay is shown in Figure 3, the difference between letters refers to significant differences in antioxidant capacity by DPPH assay between each one of the brands of green tea, in cold and hot tea extracts, in the following way: Oriental® (D for cold tea extracts and G for hot tea extracts), Lipton® (B for cold tea extracts and F for hot tea extracts), Hindú® (CD for cold tea extracts and E for hot tea extracts), Jaibel® (A for cold tea extracts and C for hot tea extracts).
The analysis of variance ANOVA (Tukey’s multiple comparison Test) for ORAC assay is shown in Figure 4, the difference between letters refers to significant differences of antioxidant capacity by ORAC assay in just three brands of green tea in cold and hot tea extracts, in the following way: Oriental® (C for cold tea extracts and F for hot tea extracts), Lipton® (B for cold tea extracts and F for hot tea extracts), Hindú® (C for cold tea extracts and D for hot tea extracts). Conversely, Jaibel® did not show significant differences in antioxidant capacity between cold tea extracts and hot tea extracts: (A for cold tea extracts and A for hot tea extracts).
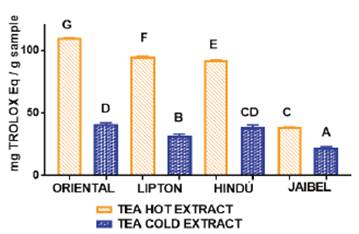
Figure 3 ANOVA, Tukey´s multiple comparison test (significant p< 0.05) of antioxidant capacity by DPPH assay of four different tea brands between two different infusion temperatures.
Determination of tea compounds by high performance liquid chromatography (HPLC)
The identification and quantification of ten compounds by HPLC for cold and hot tea extracts are shown in the Table 2. The peaks corresponding to EGC, caffeine and EGCG are the most abundant in these four brands for both extraction temperatures. Perhaps, the peak of EGCG have higher abundance in hot tea extracts respect to cold tea extracts in the four brands: Oriental® (159.79 mg/L for hot tea extracts and 85.89 mg/L for cold tea extracts), Lipton® (176.59 mg/L for hot tea extracts and 42.24 mg/L for cold tea extracts), Hindú® (178.29 mg/L for hot tea extracts and 77.08 mg/L for cold tea extracts) and Jaibel®(57.68 mg/L for hot tea extracts and 41.09 mg/L for cold tea extracts). The separation conditions show that the polar compounds will elute first than the non-polar compounds.
Table 2 Concentration of ten compounds in green tea extracts determined by HPLC-DAD of different tea brands between two different infusion temperatures 15.

Jaibel® has differences in the compounds determined by HPLC, therefore the peaks corresponding to ferulic acid and ECG for both temperatures could not be identified, likewise, the peak of chlorogenic acid in hot tea extracts was not identified. The results are shown in the Figure 5a y 5b. Also, Oriental® has differences in one of the compounds, since the peaks corresponding to ferulic acid for cold tea extracts could not be identified. Notably, there is a tendency in the results because the concentration in almost all compounds for hot tea extracts are higher in comparison with cold tea extracts, except the EGC where the concentration is higher for cold tea extracts. The results are shown in the Figure 6a y 6b.
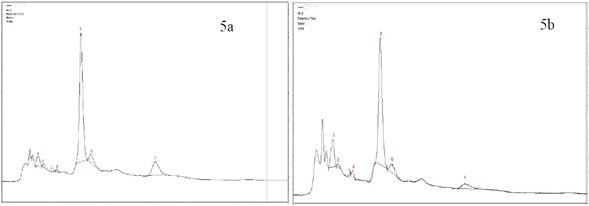
Figure 5 HPLC Chromatogram of Jaibel® a) Hot tea extract, peak identification: 1. Trigonelline, 2. Gallic Acid, 3. EGC, 4. Catechin, 5. Caffeine, 6. EC, 7. EGCG b) Cold tea extract, peak identification: 1.Trigonelline, 2. Gallic Acid, 3. EGC, 4. Catechin,5. Chlorogenic acid 6. Caffeine, 7. EC, 8. EGCG.
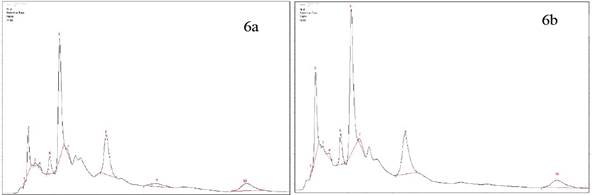
Figure 6 HPLC Chromatogram of Oriental®. a) Hot tea extract, peak identification: 1. Trigonelline, 2. Gallic Acid, 3. EGC, 4. Catechin, 5. Chlorogenic acid, 6. Caffeine, 7. EC, 8. EGCG, 9. Ferulic acid, 10.ECG. b) Cold tea extract, peak identification: 1.Trigonelline, 2. Gallic Acid, 3. EGC, 4. Catechin,5. Chlorogenic acid, 6. Caffeine, 7. EC, 8. EGCG, 9.ECG.
Lipton® also has differences in one of the compounds determined by HPLC since the peaks corresponding to ferulic acid for both temperature of extraction could not be identified. Significantly, there is a tendency in the results because the concentration in almost all compounds for hot tea extracts are higher than cold tea extracts except the EGC where the concentration is higher for cold tea extracts. The concentration in the EC is almost the same for both temperatures: (14.37 mg/L for hot tea extracts and 14.37 mg/L for cold tea extracts). The results are shown in the Figure 7a y 7b. Also, Hindú® has ten compounds determined by HPLC for both extraction temperatures. Significantly, this brand presented the same tendency in the results obtained in all brands. The results are shown in the Figure 8a y 8b.
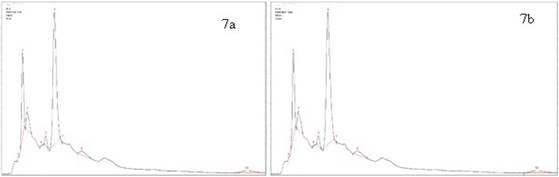
Figure 7 HPLC chromatogram of Lipton®: a) Hot tea extract, peak identification: 1. Trigonelline, 2. Gallic acid, 3. EGC, 4. Catechin, 5. Chlorogenic acid, 6. Caffeine, 7. EC, 8. EGCG, 9. Ferulic acid, 10.ECG; b) Cold tea extract, peak identification: 1.Trigonelline, 2. Gallic acid, 3. EGC, 4. Catechin,5. Chlorogenic acid, 6. Caffeine, 7. EC, 8. EGCG, 9.ECG.
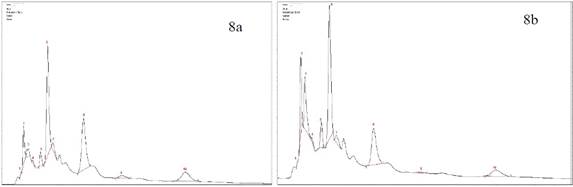
Figure 8 HPLC chromatogram of Hindú®: a) Hot tea extract, peak identification: 1. Trigonelline, 2. Gallic Acid, 3. EGC, 4. Catechin, 5. Chlorogenic, acid 6. Caffeine, 7. EC, 8. EGCG, 9. Ferulic acid, 10.ECG; b) cold tea extract, peak identification: 1.Trigonelline, 2. Gallic Acid, 3. EGC, 4. Catechin, 5. Chlorogenic acid, 6. Caffeine, 7. EC, 8. EGCG, 9. Ferulic acid, 10. ECG.
DISCUSSION
To date, it seems that there are no thorough studies on how antioxidant capacity of green tea could be affected by hot or cold water steeping and how this could be related to their TPC, TFC and catechin quantification. In this study the extraction time is not a determining factor, since the main objective was to simulate beverage brewing. Each one of the four brands of green tea were used in an aqueous extraction procedure, to study the effect of different extraction temperatures on TPC, TFC and antioxidant capacity. As well as on the determination and quantification of tea compounds.
TPC obtained for cold and hot tea extracts is presented in the Table 1. The analysis of variance ANOVA is shown in Figure 1, which identified significant differences between cold tea extracts and hot tea extracts for each one of the four brands, in the following way: Oriental® (B for cold tea extracts and E for hot tea extracts), Lipton® (AB for cold tea extracts and D for hot tea extracts), Hindú® (AB for cold tea extracts and DE for hot tea extracts), Jaibel® (A for cold tea extracts and C for hot tea extracts). Therefore, it can be inferred that hot tea extracts presented higher concentration of TPC in comparison with cold tea extracts, shown in figure 1. These results are similar to those reported by Venditti E. and Bacchetti T, they compared the TPC in hot and cold teas and found that always TPC is higher in hot than in cold for green tea extracts, except in the case of white tea, where TPC is significantly higher in cold extracts than in the hot ones. In addition, TPC, in white tea prepared through cold water steeping, is significantly higher than in all other teas prepared in the same way 8. TPC of hot and cold tea extracts obtained in this study generally covers a range of 2.53 - 127.74 mg GAE/g per sample, which matches the range of 43.21 - 139.02 mg GAE/g per sample obtained by Horžić et al,16. Also, Luximon-Ramma et al, 17, reported similar results in TPC with ranges of 62 - 107 mg GAE/g per sample in nine brands of black and green tea. Oriental® contained the highest TPC for both extraction temperatures: 14.63 ± 0.53 mg GAE/g per sample for cold tea extracts and 55.06 ± 1.03 mg GAE/g per sample for hot tea extracts, on the contrary, Jaibel® contained the lowest TPC for both extraction temperatures: 2.53 ± 0.25 mg GAE/g per sample for cold tea extracts and 29.34 ± 0.66 mg GAE/g per sample for hot tea extracts, however, it is important to consider that Jaibel® is a combination with Hibiscus sabdariffa and lemon, which may be an interferer for the extraction of polyphenols in green tea, contrary to a previous study carried out by Costa et al, 18, where infusions of green tea with Hibiscus sabdariffa showed higher phenolics contents than those without Hibiscus sabdariffa. In fact, green tea and Hibiscus sabdariffa are described in literature as very good sources of phenolic compounds, comparatively with other medicinal plants 18. A study using HPLC showed that the catechins are predominant phenolic compound in samples of Camellia sinensis, and also the TPC in green tea is higher than in white tea, being the extraction efficiency dependent on the infusion time and temperature 19.
TFC obtained in this study for cold and hot tea extracts is presented in the Table 1. The analysis of variance shown in Figure 1, identified significant differences between cold tea extracts and hot tea extracts for each one of the four brands, in the following way: Oriental® (D for cold tea extracts and E for hot tea extracts), Lipton® (D for cold tea extracts and E for hot tea extracts), Hindú® (B for cold tea extracts and C for hot tea extracts), Jaibel® (A for cold tea extracts and C for hot tea extracts). In a general way, TFC obtained in the four commercial brands of tea by both extraction temperatures is in accordance with those reported in literature by Damiani et al, 1. They expressed that TFC was higher in hot tea extracts (1.47-2.53 mmol CE/L per sample) than in cold tea extracts (0.70-1.13 mmol CE/L per sample), and identified significant differences between cold and hot tea extracts. Shuyuan et al, 20, concluded that the TFC decreased at extraction temperatures between 20 and 60°C, followed by a slight decrease when the steeping temperature exceeded 60°C similarly to the results obtained in table 1. Recently, the idea of cold brewing tea, which originated in Taiwan, seems to be enticing, unique and interesting: it uses only cold water to steep teas and is slowly moving westward, toward North America, which is the largest consumer of iced cold tea, generally prepared by cooling the hot brew. Since tea components extracted from tea leafs during tea brewing may be affected by the steeping conditions, it is believed that the TFC depends on the temperature of extraction 1.
TFC for hot and cold tea extracts obtained in this study generally covers a range of (2.67 - 8.41 mg CE/g per sample) which is in agreement with the results obtained by Luximon-Ramma et al, 17, with ranges between 15-26 mg CE/g per sample, which showed a slightly higher TFC than the one reported in this study when reflux extraction was carried out in the Eastern brand. Besides, another study reported that when the extraction is performed with methanol, the TPC is between 0.671 g CE/Kg tea per sample, these results indicates that the solvent is important in the solubilization of flavonoids and other compounds of tea 21. Astill et al, also reported the influence of solvent, time and extraction temperature 20. The highest value of TFC in hot tea extracts were related with the number 4 peak corresponding to catechin, found by HPLC chromatograms in the four brands of green tea shown in the Figure: 5a for Jaibel®, 6a for Oriental®, 7a for Lipton®, 8a for Hindú®. However, it is important to mention that time and temperature of preparation in green tea are important variables that allow the solubilization of flavonoid compounds such as catechins. Therefore, it is possible to identify groups of catechins that will depend on the extraction time as the EC and the EGC, which is stabilized within 20 minutes, because of some catechins are time and temperature dependent (C, EGCG, GCG and ECG) according with the studies carried out by Labbé et al, 6. This result explain the differences between cold and hot tea extracts in relation with the quantification of catechins by HPLC, indeed, hot tea extracts presented higher concentration of catechins, and from there an increased TFC in comparison with cold tea extracts that presented lower concentration of catechins, the results are presented in the table 2. Oriental® contained the highest TFC for both extraction temperatures: 7.08 ± 0.38 mg CE/g per sample for cold tea extracts and 8.41 ± 0.15 mg CE/g per sample for hot tea extracts, on the contrary, Jaibel® contained the lowest TFC for both extraction temperatures: 2.67 ± 0.20 mg CE/g per sample for cold tea extracts and 5.43 ± 0.16 mg CE/g per sample for hot tea extracts, unlike a previous study 18, with infusions of green tea with Hibiscus sabdariffa showed higher TFC (29.1 mg CE/100 mL per sample) than those without Hibiscus sabdariffa (8.4 mg CE/100 mL per sample).
The result of the antioxidant capacity obtained in this study for cold and hot tea extract by DPPH assay is presented in the table 1. The analysis of variance ANOVA showed significant differences between two extraction temperatures in the studied brands of green tea, in the following way: Oriental® (D for cold tea extracts and G for hot tea extracts), Lipton® (B for cold tea extracts and F for hot tea extracts), Hindú® (CD for cold tea extracts and E for hot tea extracts), Jaibel® (A for cold tea extracts and C for hot tea extracts), these results are similar to the study conducted by Taheri et al,22, where they found that the antioxidant activity of tea increased significantly in hot extracts when comparing white and black tea and black tea wastes. Interestingly, tea factory wastes showed an antioxidant activity almost equal to that of black tea, these results can be explained because the water extraction of green tea at different temperatures varied in the yield of extracts and composition. The antioxidant capacity was significantly lower in low-temperature steeping water (20-40°C) than in hot water (60-100°C), and it did not show a significant increase when the steeping temperature exceeded 60°C 6. It has been shown that many factors affect the extraction yield including temperature and stirring during extraction on the TPC and TFC that are directly related with the antioxidant capacity in green tea. This result indicates that tea extracts are almost as potent as the pure flavonoid, catechin, in DPPH radical scavenging, depending on the extraction methods of the tea samples. Previous studies showed positive association between tea TPC and scavenging of DPPH radical. An increase in TPC resulted in the increase of DPPH radical scavenging in tea infusions, a study suggested higher water temperature and shorter steeping time as the best combination for improving the herbal teas beneficial health effects in terms of antioxidant properties 7. The antioxidant activity of green tea Liptón® obtained in this study was compared with the study of another reported author who determined the activity of 24 commercial samples, where the brand Lipton® reported 1000 μmol trolox eq/g per sample 23, similar to the results obtained by hot extraction (95.25 ± 0.24 mg trolox eq/g per sample). Catechin polyphenols are believed to be the most important active component in green tea. They are secondary metabolites possessing antioxidant activity, which is 20 times higher than that of vitamin C. Catechins have the ability to quench free radical species and chelate transition metals, which have higher antioxidant capacity 24),(25. Commonly available green tea on the market contains 6.5-15.4 mg EC, 30.9-76.4 mg EGC, 3.6-15.9 mg ECG and 43.5-83.9 mg EGCG per 100 mL per sample. The objective of green tea brewing is to infuse water with the soluble polyphenols, purine alkaloids (methylxanthines: caffeine and theophylline), aromas, flavors, and other substances from dried green tea. Typical brewing methods for a cup of green tea are 55 mL of water at 60°C to 80°C and 2 g of green tea in an infuser that is placed in hot water for 1 to 2 min, these brewing methods will vary with different cultures and geographic regions. The ratio (mass/mass), infusion time, and water temperature affects the concentration of polyphenols and the purine alkaloids in the brew 27. To confirm the results obtained by DPPH, it also was determined the antioxidant capacity by ORAC assay, shown in Table 1, the analysis of variance ANOVA, shown in Figure 4, shows significant differences between two extraction temperatures in just 3 brands of green tea, in the following order: Oriental® (C for cold tea extracts and F for hot tea extracts), Lipton® (B for cold tea extracts and F for hot tea extracts), Hindú® (C for cold tea extracts and D for hot tea extracts), on the contrary, Jaibel® didn’t showed significant differences between the extraction temperature (A for cold tea extracts and A for hot tea extracts). These results are similar to those obtained by DPPH assay, but just in 3 of the four brands (Oriental®, Lipton®, Hindú®). Oriental® contained the highest antioxidant capacity for both extraction temperatures 46.25 ± 2.05 mg Trolox eq/g per sample for cold tea extracts and 113.6 ± 2.05 mg trolox eq/g per sample for hot tea extracts, on the contrary, Jaibel® contained the lowest antioxidant capacity by ORAC assay for both of extraction temperatures: 22.95 ± 1.31 mg trolox eq/g per sample for cold tea extracts and 23.40 ± 1.50 mg CE/g per sample for hot tea extracts. Jeszka-Skowron and Zgoła-Grześkowiak (2014), showed that the anti-oxidant capacity of two out of four pure green tea infusions was higher than green tea with fruits or lemon, like the brand Jaibel®, that is a combination of green tea with some fruits and aromatic flowers (Hibiscus sabdariffa and lemon), that had good results 26, contrary with the results of antioxidant capacity obtained by DPPH and ORAC assays shown in table 1, where the brand Jaibel® presented the lowest antioxidant capacity, TFC and TPC. The green tea polyphenols extraction into tea is both time and temperature dependent. Tea preparation is important, since hot water preparations makes tea a better oxidative radicals scavenger, unlike cold water preparations, which is attributed to a greater extraction of polyphenols 11.
The cold and hot tea extracts separation and quantification method was used according to the results obtained by Ramírez-Aristizabal et al,15, where it was demonstrated that catechins, especially EGCG and Catechin are the major compounds in hot tea extracts, as shown in Table 2, being higher for Oriental® and Lipton®, therefore their antioxidant capacity behaved in the same way. However, it could be inferred that such antioxidant capacity will depend on the joint action of the tea components, since Oriental® had a lower EGCG content compared to Lipton® in hot tea extract, but was superior in cold tea extract, shown in table 2. All brands in terms of chlorine acid content, confirmed the results obtained by Horžić et al,16, where it was indicated that phenolic acids contribute to the antioxidant capacity of green tea extracts. The antioxidant capacity of the phenolic compounds will depend on the number of OH groups and their position. The OH groups at the 3’-4’-5’ position of the flavonoid bring increase the antioxidant capacity 27. Other authors suggest that the content of catechins increases from 30-40% when the extraction lasts 10 minutes, old leaves contain less caffeine but more EGCG 30. Generally, caffeine levels in infusions are between 141-338 mg/L, but cold and hot tea extracts from all brands presented lower values, obtaining the highest composition of caffeine in Lipton® shown in the Table 2, which contains (76.83 mg/L) 31.
EGCG presented higher correlation coefficient than other tested flavanoids. This outcome was associated with the presence of hydroxyl group in aromatic rings of gallyl and galloyl substituents because flavanols without this substituent showed reduced antioxidant capacity. The highest antioxidant capacity was observed for ethanolic and aqueous extracts for both radicals. In addition to the elevated radical scavenging activity of major catechin derivatives in green tea, structural differences also influence the radical scavenging activity in DPPH. This finding was reported by Nanjo et al,28, which indicated that the galloyl substituents present in EGCG and ECG were related to higher scavenging activity than EGC and epicatechin. The capacity to scavenge peroxyl radical is measured by ORAC assay. Green tea polyphenols also act as peroxyl radical scavengers as indicated by the positive correlation between this assay and TPC. Antioxidant capacity of green tea measured by ORAC evaluation suggested high capacity to scavenge peroxyl radicals in vitro. Green tea polyphenols also present quenching activity against singlet oxygen. Likic et al, 29 showed that green tea catechin and catechin derivatives could quench singlet oxygen (catechin, EC, EGC, ECG and EGCG). Particularly, EGC and EGCG presented similar overall rate constants (combination of physical quenching and chemical reaction) observed for α- and γ-tocopherol 32.
In this study, each one of the four brands of green tea presented TPC, TFC and antioxidant capacity by both methods with significant differences between hot and cold tea extracts, with exception of the brand Jaibel® in the determination of antioxidant capacity by ORAC assay were no significant differences where identified. Oriental® showed higher TPC, TFC and antioxidant capacity than the others brands and Jaibel® showed the lowest.
CONCLUSIONS
The bioactive compounds of green tea in commercial brands were significantly affected by temperature of extraction; it can to conclude that by increasing the extraction temperature the total polyphenol concentration, total flavonoid content as well as the antioxidant capacity of green tea extracts is increases. The highest total phenolic concentration, total flavonoids contents and antioxidant capacity values were obtained at 80°C for 5 minutes. The results obtained contribute to gaining further knowledge on how the potential health benefits of this popular beverage could be maximized by the different methods of preparation.
Individuals who consume green tea can use the information included here to make more informed decisions about green tea selection and preparation, for maximal health benefits. It is our intention that this comprehensive exploration of the effect of brewing conditions on the antioxidant capacities of four green tea varieties can help further understanding of the maximal health benefits to be attained through consumption of green tea. The infusing efficiencies of non-gallated catechins and GA were higher than gallated catechins and CA under cold tea extracts. EGC was the highest catechin in cold tea extracts, whereas EGCG was the highest one in hot tea extracts, where related scavenging activity with the concentration of epigallocatechin and epicatechin, for that reason the brands Oriental® and Lipton® has the highest values for the antioxidant capacity in correlation with the peaks of EGCG identified by HPLC.

