


 English (pdf)
 Article in xml format
 Article references
 Send this article by e-mail
 Cited by SciELO
  Cited by Google
  Similars in
SciELO
Similars in
SciELO  Similars in Google
 Permalink
1 Introduction
Rivers and streams are ecosystems and natural conduits of surface water that act as a source of drinking water. Therefore, assessing water quality conditions for human consumption in this environment is critical [1, 2]. For this reason, regular monitoring of some variables at different points of the tributary is a crucial factor in the bio-sanitary alerts for water consumption. Currently, water quality is monitored through the systematic collection of samples that are subsequently analyzed in the laboratory, which implies a high investment of human and technical resources to generate timely and reliable results. Colombia has the most significant water supply globally with five watersheds: the Caribbean, Orinoco, Amazon, Pacific, and Catatumbo. For this reason, it is of utmost importance to evaluate the quality indexes in any geographical point of the national territory.
The biological and physical-chemical features of water aim to identify and measure pollution indicator agents. For determining these characteristics, there are two analysis types; qualitative and quantitative.
I) qualitative analysis is generally concerned with identifying suspended solids and dissolved contaminants. This analysis is usually done by observation and without the need for rigorous laboratory testing. II) Quantitative analysis makes it possible to identify pollutants that are not visible to the naked eye in greater detail. In this case, pH, dissolved oxygen, electrical conductivity, and microbial contamination are evaluated. The pH level of the water plays a fundamental role in the phases of water treatment because it affects the formation of crusts in the water sources. The chemical and biochemical oxygen demand determines the quantity of organic matter in the water. Electrical conductivity is a variable that identifies the conduction of energy by ions, thus demonstrating the ions' concentration in the water. For this reason, this work addresses the importance of this analysis and focuses on the development of a device capable of quantitatively analyzing these variables [1, 3,4].
IoTMonitor-WQ records and transmits information on pH, electrical conductivity, dissolved oxygen, humidity, temperature, and flow rate variables from distant water sources. Thanks to the arrangement of some hardware elements configured as an embedded IoT platform with energy autonomy, the analysis of remote water sources no longer requires logistical and personnel investment. These elements are endowed with particular capabilities in acquiring and transmitting essential data for water quality assessment [5, 6, 7]. The central part of the IoTMonitor-WQ device is the data acquisition and transmission module. This module is based on a Pycom device that operates in wide coverage networks (25 km) and low power consumption through long-range antennas (LoRa) in LPWAN configuration [8, 9].
IoTMonitor-WQ consists of a Lopy one controller that develops the operational logic for acquiring each of the sensor signals and deploys the information transmission process with LoRa. The acquisition of signals concerning pH, electrical conductivity, and dissolved oxygen are AtlasScientific products [6, 10, 2, 8]. These sensors were chosen for their range of measurement accuracy and the support of the conditioning circuit included. IoTMonitor-WQ is a low-cost device with good technical specifications reliable in sampling, data transmission, and storage.
IoTMonitor-WQ has a broad spectrum of use in various application fields; for example, in water treatment plants, an autonomous sensor network is needed to monitor parameters and generate early alarms after evaluating the stored or piped water quality. This field of application is possible thanks to the ability to configure the maximum and minimum levels of the monitored variables to generate alerts [8, 11, 12]. IoTMonitor-WQ can become a device capable of certifying sources, water inflows, or white, gray, or black water management processes within the agricultural or industry. IoTMonitor-WQ can be widely scalable and generate coverage over large areas of territory.
We propose a platform capable of taking on scientific and laboratory work with a high degree of reliability in evaluating drinking water quality. In this work, we built an automated device called IoTMonitor-WQ to measure, record, and transmit data concerning the quality of water sources in distant geographical locations. We use precision sensors, high-fidelity information transmission technologies in extreme conditions, and peripherals to determine their energy autonomy. For this reason, IoTMonitor-WQ signifies a breakthrough in low-cost, efficient, and reliable devices intended to take on the role of assuring water quality assessment processes.
This article is organized as follows: Section 1 introduces research challenges pertinent to water quality; Section 2 describes the deployment of the application, identifying the main challenges and features of the IoTMonitor-WQ; Section 3 details the hardware description; Section 4 presents the design files of IoTMonitor-WQ device; Section 5 presents the result through a validation and characterization and finally, the conclusions are shown in Section 6.
2 Application Deployment
LoRa technology provides up to 3 KM coverage in direct line of sight and enables a minimum internet connection GMC (Multitech Conduct gateway) US915 with low power consumption [13] .
This work proposes a network deployment of three nodes (IoTMonitor-WQ devices) and a central node (GMC US915) in a rare scenario in altitude and with non-direct lines of sight. According to the topographic and technical characteristics of the setup, it is shown that the Lora devices have a range of approximately 2.4 km from the nodes (IoTMonitor-WQ devices) to the central node, according to the distribution shown in Figure 1. The scenario poses challenges regarding communication instability in the connection (Transmission) and link (Authentication and interoperability). For this reason, signal and link losses are reduced through the configuration of a LoraWAN network from the GMC US915 (Central Node) and line-of-sight signal search with direction to the nodes (IoTMonitor-WQ Devices). However, this configuration is still subject to link failures when weather conditions (rain and fog) happen.
In addition, internet access in rural areas of Colombia is almost non-existent, so it is necessary to use shared mobile data from a Smartphone. With the measured use of this resource, it is possible to generate a local network that provides internet to the infrastructure from the central cloud access node (GMC US915). However, due to a limited internet connection, there is a latency in the order of ms in the transmission and visualization of data on the web platform. Once we identified this problem, the integrity of the data collected in each module is guaranteed through an SD data storage module.
Another challenge proposed by the setup is safeguarding the device (IoTMonitor-WQ nodes) at the sampling site. To mitigate this risk, to install a GPS module in each device and installing local alarms to alert intrusions in the nodes can be considered. For now, the study focused on data collection in short periods (3 hours per day for five months). However, we built the IoTMonitor-WQ prototype to withstand hostile environmental conditions and low power consumption. These features allow the sampling process to be maintained for up to 3 months.
IoTMonitor-WQ is designed under autonomy in sampling, connection service, and data transmission deployment. For this reason, the modular construction of the device allows reconfiguration, replacement, and adaptation of modules to improve its performance. In addition, with the deployment of the network of nodes in star typology Figure 2, the Gateway offers synchronous communication with up to 50 receiving nodes, which makes the system highly scalable, with large territorial scopes and, depending on the measurement points, would guarantee data traceability in large bodies of water.
2.1 Background
The main problem with monitoring the quality of water for human consumption is the lack of real-time monitoring of the liquid from the natural source to the consumer, in addition to the high costs associated with the constant analysis of water and the lack of capacity to identify contaminant sources in natural water tributaries. It is estimated that diseases related to poor water and sanitation conditions have more than 200 million reported cases annually, causing between 5 and 10 million deaths worldwide [14].
The monitoring and analysis of samples in the evaluation of water quality is a process that demands technical, human, and, therefore economic resources. For this reason, most of these processes are carried out only in the water treatment plants that supply the population. However, this process is incomplete if traceability of the contaminant material contained in the water and the natural source of the water is desired. Therefore, this process is considered corrective and not preventive. In addition, the tributaries supply water to aqueducts in distant municipalities that do not have a water treatment plant and for agricultural use. Therefore, the lack of water quality records at points remote from the treatment plant becomes critical and indispensable [15].
Several studies conducted on water monitoring contribute to solving the problem through monitoring platforms [8, 15, 16, 17]. One of the platforms deploys an LPWAN network that offers long-range and low power consumption wireless connectivity, which estimates the successful packet delivery rate at 95% for more than 1000 nodes served with multiple gateways [5]. However, there is no data deployment in a visual environment and no power backup and data storage system, thus making the system vulnerable. This research proposed a modular and portable water quality monitoring system with a long-range deployment infrastructure and projected three benchmarks for data transmission.
IoTMonitor-WQ, thanks to LoRa technology, allows to make trade-offs between the amount of data to be transmitted, the range and energy autonomy, an advantage for studies in remote areas, in a range of 20 km in rural areas and 5 km [9] in urban areas. Another advantage is that it has certified sensors and the backup of the data collection. It also has its web service built for real-time monitoring, with the backup of the information on-site and in the cloud generating reports on data analysis.
Future work to improve the performance of IoTMonitor-WQ is to enhance the data display on the Web platform involving more measurement variables: chemical and biological, supported by the implementation of a photovoltaic backup system to ensure energy autonomy. Additionally, it is essential to include security system based on Blockchain to ensure traceability of data and products and guarantee the certification of processes.
3 IoTMonitor-WQ hardware description
The IoTMonitor-WQ design combines several related hardware peripherals to automate the sampling of distant water tributaries, store the data locally and transmit it to an evaluation center. This feature makes the process low cost and high coverage capacity.
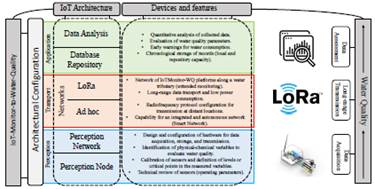
Figure 1 describes the IoT architecture designed for the remote water quality monitoring system. As we can see, the architecture is based on the three fundamental layers for the Internet of Things (IoT). The architecture is configured from two points of view; the application field and the IoT system architecture. Thus, with these two fields' technical and descriptive crossing, it is possible to show a complete panorama of the system. The IoT-Architecture block details the content of each of the three layers (Perception, Transport, and Application), blue, red, and green respectively (from bottom to top); the perception layer contains details related to the hardware design (Lopy 1.0, sensors, conditioning circuits, power module, memory module, etc.) arranged for data capture and the way they interoperate with the other active devices of the system, both other hardware devices of the same layer, as well as with the network and connection agents of the transport layer. The transport layer involves designing local and extended networks for connection, the configuration of communication protocols, and the interoperability of the transport channel between the sensing and application layers. The application layer deploys the system-wide data visualization, storage, and analysis service. This layer is the one visible to stakeholders in the water quality assessment process. Therefore, it is designed to generate alerts and enable the configuration of alert levels in the measurement of variables.
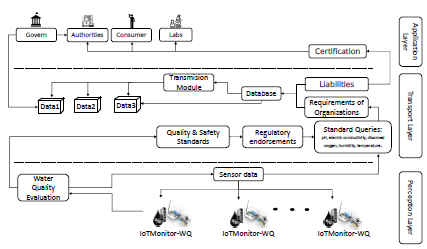
Figure 2 shows a system abstraction proposed by IoTMonitor-WQ. As we can see, this system based on these devices can deploy water traceability throughout the entire supply process. The ability to record and evaluate water quality variables, from the source to the consumer, has a very high impact on public health in any country. The quality requirements demanded by governments, world organizations dedicated to public health, and regional water supply centers laboratories can benefit from this type of technology. This system is designed from the perspective of the IoT architecture described in the figure above. The perception layer involves hardware deployment, network design, and technology interoperability. The transport layer requires adapting technologies, coordinating transmission processes, designing and configuring communication channels according to protocols, studying transparency and quality parameters of transmitted data, and other parameters related to the connection. The application layer involves deploying a visual and hosting service for the information collected and shipped from the hardware devices of the perception layer. In this layer, the entire logistical process of the system, including data in the form of statistics, alert parameters, and normality indicators, is made available to the user (government, entities, and consumers).
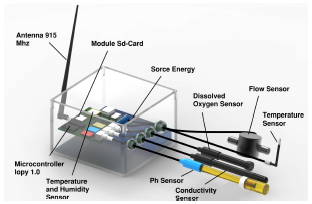
Figure 3 shows the detailed drawing of the internal elements that compose the IoTMonitor-WQ device. The printed circuit board has a design obeying the logic of the system and the service proposed from the architecture and hardware.
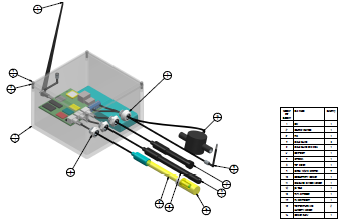
Figure 4 shows each of the elements that make up the IoTMonitor-WQ device. In addition, they identify the most relevant technical characteristics. The following is a description of the devices in the scheme.
a) The digital thermometer DS18B20 provides 9bit to 12-bit Celsius temperature measurements and has an alarm function with nonvolatile user-programmable upper and lower trigger points. This sensor communicates over a 1-Wire bus and can derive power directly from the data line ("arasite power"), eliminating the need for an external power supply.
b) The BME280 is as combined digital humidity, pressure and temperature sensor based on proven sensing principles. This sensor achieves high performance in all applications requiring humidity and pressure measurement. The humidity sensor provides an extremely fast response time for fast context awareness applications and high overall accuracy over a wide temperature range. Moreover, integrated temperature sensor has been optimized for lowest noise and highest resolution.
c) The EZO-DO (Dissolved Oxygen) circuit guarantees dissolved oxygen readings in mg/L and percent saturation. This sensor has temperature, salinity, and pressure compensation features that make the measurements accurate.
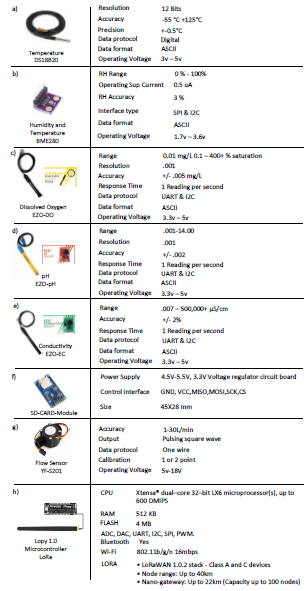
d) EZO-pH circuit offers highly accurate pH readings and capabilities traditionally found only in expensive laboratory equipment. Although a typical measurement, accurate pH readings are complicated. However, this circuit provides this assurance.
e) The EZO-EC (Electric conductivity) circuit provides critical measurements of water chemistry. This sensor measures conductivity, salinity, and TDS (PPM). Inside the probe, there are two electrodes opposite each other, to which an alternating voltage is applied that causes the cations to move towards the negatively charged electrode. In contrast, the anions move towards the positive electrode. The more free electrolyte the water contains, the higher its electrical conductivity.
f) The module (MicroSD Card Adapter) is a Micro SD card reader module for reading and writing through the file system, and the SPI interface driver, SCM system, can be completed within a file MicroSD card.
g) YF-S201 is an integrated magnetic hall effect sensor that outputs an electrical pulse with every revolution. This sensor works in line with the flow water line and contains a pinwheel sensor to measure how much liquid has moved through it. The hall effect sensor is sealed from the water pipe and allows the sensor to stay safe and dry.
h) The central part of IoTMonitor-WQ is the Lopy 1.0 module. This microcontroller-based module has an adapted local flash memory module for local data storage. Lopy one is a compact network mycroPython enabled development board (Lora, Wifi, Bluetooth). This module has a direct link to a web platform where data is chronologically recorded.
4.2 IoTMonitor-WQ components
IoTMonitor-WQ sensors and peripheral elements are mounted on a PCB (70 x 100mm) that interconnects and polarizes the devices. The sensors are installed on the board according to the logical layout programmed in the system core (Lopy 1.0 Microcontroller). The PVC electrical housing containing the IoTMonitor-WQ system (x, y, z 140 x 100 x 150mm) houses; a LiPo lithium-ion battery (40 x 20 x 140mm), a communication antenna for the LoRa protocol, LED indicators, and four external adapters for the sensors (see Figure 5).
The connection adapters for the sensors are 2 inch and individually supported. These connectors are highly resistant to hostile environments and constant movements. These connectors should be arranged horizontally to prevent water from damming or entering the PCB. Sensor wires are snap-fitted tightly to these connectors.
The sensor probes must always be immersed in the water source to be evaluated, especially the YF-S201 sensor in charge of measuring water flow. The PCB and sensor connectors are fastened with support screws to the electrical housing. The sensors calibration is done every specific time in the test field, and this period is the same time that the battery must be charged or replaced. This time is part of the design of the IoTMonitor-WQ device. Refer to the operating instructions (section 6) for a detailed description.
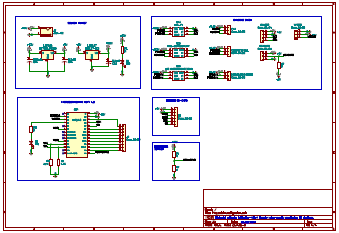
4.3 Electrical components
The electronic control system of the IoTMonitor-WQ device is based on a Lopy 1.0 microcontroller (see Figure 5). The components connected to the controller are six sensors; DS18B20 digital thermometer, BME280 combined digital humidity, temperature and pressure sensor, EZO-DO (Dissolved Oxygen), EZO-pH, EZO-EC (Electric conductivity), YF-S201 (Flow rates) (see Figure 4). The electrical circuit (see Figure 6) is powered by a 12 V LiPo battery with regulated circuits (converters) with different voltages needed in the system.
The EZO-DO, EZO-pH, EZO-EC sensors signal is connected to pin3, pin4, and pin5, respectively, of the Lopy 1.0 through the conditioning circuit. These sensors operate at 5 Volts in a current consumption range of 5-2 5mA. Changes are perceived in the oven and resolution of the measurements with minimum average increments of 3 mA for each measurement unit in the three sensors. The DS18B20 sensor connected to pin4 of the Lopy1.0 has a 12-bit resolution that fluctuates in current ranges of 5-7 mA for every
0.4 °C change in the conditioning and parameterization curve. The BME280 sensor connected to pin5 of Lopy1.0 works with 3.3 V and a peak consumption in high-temperature measurements of 0.6u A in the sensor parameterization curve. The YF-S201 flow sensor is connected to pin6 of Lopy1.0. It requires a voltage amplifier circuit at 24 V, which defines the state changes at the frequency increase of the hall effect. It consumes between 6-9 mA per liter step of water.
The printed circuit board (PCB) layout arranges the flows, ground coupling, and voltage interoperability of the abovementioned elements. The voltage regulators contain isolation stability filters with the primary circuit of the Lopy1.0. The thickness and angles of the tracks (0.3 mm thick and minor to 40 °C slope) were designed under the quality standards required by the technical standards in PCB design.
4.4 Lopy1.0 software
The software for operating the IoTMonitor-WQ device is available for a Lopy1.0 microcontroller and has the workflow shown in the flowchart in Figure 7. The software is available in the online repository-a detailed description of the graphical user interface and the software in section 6. The user platform has a secure access template and a direct template to display recorded and stored data from the IoTMonitor-WQ.
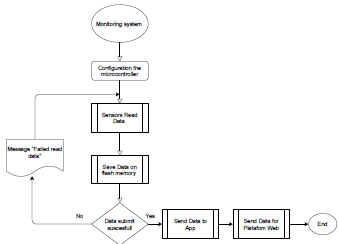
The software includes an empirical calibration of the BME280, DS18B20, and YF-S201 sensors, which were performed by applying behavioral formulas and device parameters according to the datasheet of each one. For the other sensors EZO-DO, EZO-pH, EZO-EC, the calibration can be adjusted by changing the corresponding formula in the code but related to each conditioning circuit. Additionally, the software includes the configuration of the LoRa communication protocol and the management of the data transmitted through this technology.
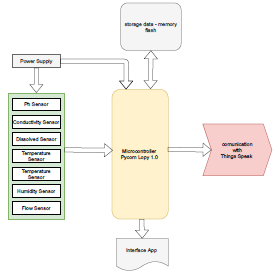
The block diagram in Figure 8 shows the relationships of the system components represented in modules. According to the designed software, the arrows linking the blocks represent the flow of information and the logical connection.
5 Bill of materials
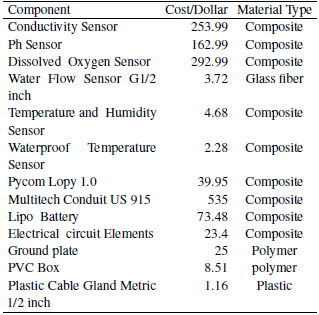
The bill of materials in Table 4 shows a reduced list, which includes the main components and collections of parts needed to make IoTMonitor-WQ work for what it was designed to do. The primary device costs come from the sensors and the Lopy1.0 card, the LiPo lithium-ion battery, and the sd-card information storage module.
6 Build and operations instructions
The following steps summarize the actions to be taken to make IoTMonitor-WQ work properly. The instructions concentrate on the calibration of the three primary sensors of the device. Operating Instructions:
The pH, electrical conductivity, and dissolved oxygen sensors are conditioned through the conditioning circuit of each measuring probe.
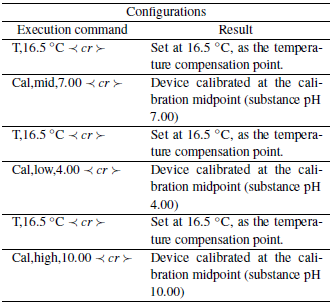
The pH sensor needs to be calibrated with the standard substances: 4.00, 7.00, and 10.00, as shown in Table 4. This conditioning is designed to cover the three states in which the pH level can be located while performing the calibration procedure. Moreover, the ambient temperature influencing the process.
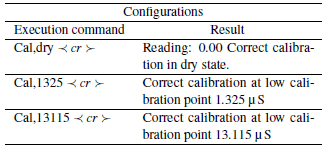
The electrical conductivity sensor is calibrated in a dry state in the first stage, connecting it to the LoPy microcontroller, and the calibration command is entered through the serial monitor. Table 2 shows that, for the second stage, once the calibration has been adjusted, the sensor is calibrated according to the specified standard substance for the low and high levels, obtaining a reference of 1,325 uS and 13,115 uS for the low and high points, respectively.
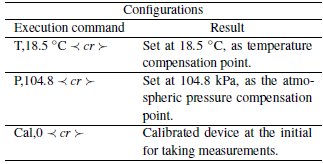
Like the electrical conductivity sensor, the dissolved oxygen sensor is calibrated first from the LoPy microcontroller and through the serial monitor. And in the second stage, according to Table 3, where the temperature compensation values are observed (18.5 °C at the time of measurement), the value of atmospheric pressure is 104.8 kPa.
Once the measurement probes of the three primary sensors have been calibrated, the operating ranges of the external sensors such as flow sensor, temperature and relative humidity sensor, and the temperature probe are configured.
Once the sensors are calibrated, the Lora communication of the IoTMonitor-WQ device ends with the Gateway is configured. Then, the collected data is managed to be included in the web platform.
Finally, the IoTMonitor-WQ device is installed in the field for sampling. The device has a power supply system, which ensures autonomy in collecting and transmitting records for a continuous period of two months. The device has a communication radius of approximately 1.2 km on a visible line.
7 Validation and characterization
We installed IoTMonitor-WQ devices at three points along a water tributary that provides drinking water to a population to validate the system. The three points are georeferenced on the map in Figure 9. The idea is to analyze the water quality at these three points to trace the liquid. Figure 10 shows the internal detail of the IoTMonitor-WQ device while it is active and ready to be installed at the marked point.
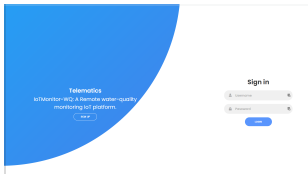
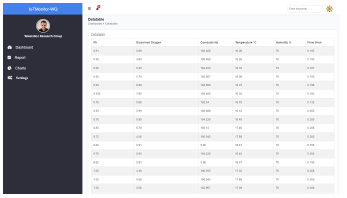
Figure 11 shows the first screen in the sequence of the user experience in viewing the data collected by the IoTMonitor-WQ devices hosted in the field. As we can observe in the series, screen 1 shows the security login environment arranged for registered users. Screen 2 of the application in Figure 12 shows the options menu to visualize all the variables that IoTMonitor-WQ can measure in real-time. As can be seen, the data are displayed and recorded in the database provided for this purpose.
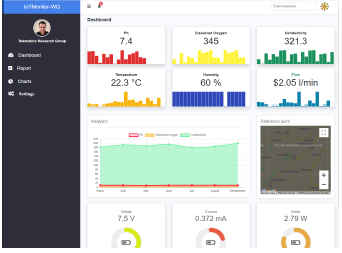
Screen 3 in Figure 13 shows the data recorded by the devices and stored for later analysis. We can see that device data such as power consumption, voltage and current, the geographical location on a map, and the timeline graph of each variable recorded by the water source are recorded.
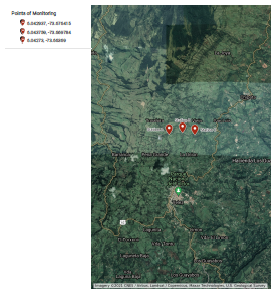
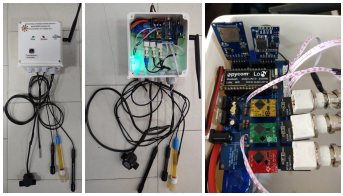
Figure 10 Physical detail of the IoTMonitor-WQ platform installed at the water quality parameter recording
7.1 Data analysis
Tests were carried out during five months with a periodicity of 4 times per month for sampling to validate the system. As a result, data were obtained from all the sensors of the device. However, as shown in the graph in Figure 14, the three IoTMonitor-WQ devices installed indicate the three main variables measured in three parallel axes in a standard timeline. These data are transmitted to the web platform and presented to the analyst and laboratory team.
As shown in the graph of Figure 14, colors are used to distinguish the records of each IoTMonitor-WQ device located at each geo-referenced point. The measured scales of the three variables (pH, electrical conductivity, and dissolved oxygen) are shown. The main characteristics highlighted are; device C has a pH between 4.2 and 6.8 with a tendency to an acidic state, station A and B maintains a regulated between the range of 5 and 10.5.
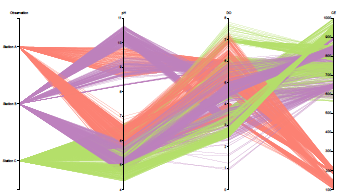
Figure 14 Parallel coordinates for data collection from the three IoTMonitor-WQ devices over a period of 5 continuous months of system operation.
The Dataset is composed of a total of 2036 samples corresponding to 6 quantitative independent variables and one qualitative variable (observation). Initially, the statistical values are evaluated to establish preliminary information on the behavior of the data, as shown below:
The average pH of the water in the influent is 6.64, which indicates that it is within the parameters for a distributed system, which means that the water is neither acidic nor alkaline. Still, it is also observed that it has absolute extremes of a minimum of 4.34 and a maximum of 10.69.
The average dissolved oxygen in the influent is 4.67 mg/L at a temperature range of 20 degrees Celsius.
The average electrical conductivity is 603.75 µ S/cm.
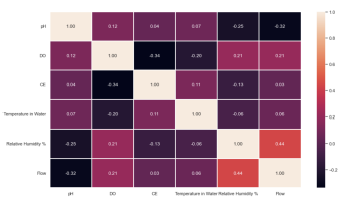
The correlation between the attributes and the matrix shown in Figure 2 is presented; as can be seen, the correlation values are not very high; however, the following observations stand out.
It was found that there is an inversely proportional relationship between water temperature and flow about the amount of dissolved oxygen and pH. This correlation can be inferred that the dissolved oxygen concentration is temperature-dependent. As for the flow rate, we determine a directly proportional relationship between oxygen concentration and water flow rate.
With the visualization tools of the Seaborn library, graphs were obtained that allow us to establish in more detail the relationship between variables, which proves a more detailed analysis of their dispersion.
Figure 16 shows the relationship between temperature and the amount of dissolved oxygen. It is observed that the temperature in the range of 17 °C to 23 ° C influences water precipitation (synonymous with contamination). These scattered points also allow us to compare the behavior of the variables according to the geographical location since they change at all points.
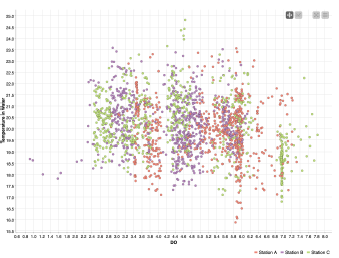
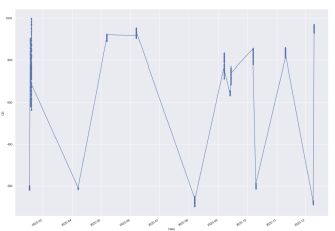
Figure 17 Time series for pH from the three IoTMonitor-WQ devices over a period of 10 continuous months of system operation.
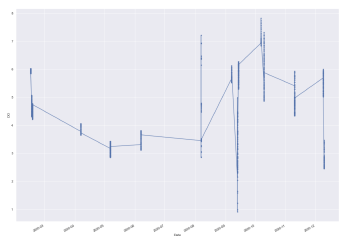
Figure 18 Time series for electric conductivity from the three IoTMonitor-WQ devices over a period of 10 continuous months of system operation.
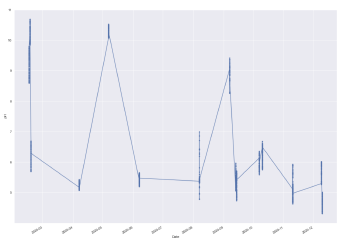
Figure 19 Time series for dissolved Oxygen from the three IoTMonitor-WQ devices over a period of 10 continuous months of system operation.
According to what is observed in Figure 17, the following can be concluded.
The pH of station c has a behavior below 7. Under this condition, a decrease in pH can increase the amount of soluble mercury in the water or release acidic substances into the tributary (synthetic or natural).
A characteristic pattern of the measured variables is that when the watercourse descends into the river, the water quality loses its physical-chemical properties in conditions favorable for potability, the pH drops to an acidic state, and the EC values increase until reaching 1000 µS/cm and the concentration of dissolved oxygen remains in a range of 3 to 7.5 mg/L.
8 Conclusions
The IoTMonitor-WQ device presented here solves the problem of water quality analysis in geographically distant locations. The conditioned sensors in the IoTMonitor-WQ device provide reliability and accuracy in sampling and real-time data transmission to the user platform, significantly reducing the costs of such a process. IoTMonitor-WQ technology reduces data collection and analysis time. It improves deployability, scalability, system function programming, increases the ability to standardize quality parameters, and displays results to the user comprehensively and transparently. The user platform is designed for the analyst to access relevant information intuitively through graphs and data sets generated from the application field point of view. All information collected from the IoTMonitor-WQ device is made available to the analyst in the form of raw data if any other type of evaluation than the one provided by the platform is required. If the IoTMonitor-WQ device is implemented in a monitoring network, it would have the ability to increase the accuracy to certify quality processes through a process of traceability of the stages of treatment and supply of drinking water.

