




 English (pdf)
 Article in xml format
 Article references
 Automatic translation
 Send this article by e-mail
 Cited by SciELO
  Cited by Google
  Similars in
SciELO
Similars in
SciELO  Similars in Google
 Permalink

1 Introduction
Epilepsy is a neurological disorder that affects approximately 50 million people around the world 1,2. To address this issue, electroencephalography (EEG) is used to measure the electrical activity of the brain, which has become the standard of care in epilepsy treatment 3. Nevertheless, due to its non-stationary nature and its nonlinearity, this is still an open problem in the field of neuroscience 4-7, which has been explored using different pattern recognition techniques derived from classical approaches, e.g., Fourier transforms 8-10, Wavelet transforms 11-13, Stockwell transforms 14, and empirical mode decomposition (EMD) 15-18.
Many research studies have been carried out to enhance the detection and classification of epileptic seizures in real time. For instance, 19 presented a new method for the classification of epileptic seizures which applies EMD to select the two most relevant intrinsic mode functions (IMFs) to extract two features of energy and two features of spectral dimension, while 20 proposed a multi-objective optimization approach to solving two non-restricted objectives, using NSGA-II and NSGA-III algorithms to improve classification accuracy and reduce the number of channels. On the other hand, 21 presented a novel method for the classification of epileptic seizures that exclusively uses Tsallis entropy at a low computational cost, and 22 presented the thresholded offset Gaussian (TOG) statistical algorithm, which acts as a noise filter and extracts seven features.
This work presents a method for the optimal selection of IMFs from real EEG signals. This approach is data-driven and applies EMD in the pre-processing stage. The selection of the most relevant IMFs is based on a threshold and a set of discrimination metrics such as the Minkowski distance, cross-correlation, the mean square error (MSE), and entropy. The IMFs with the most relevant information are selected for brain mapping and to identify active electrodes.
The remainder of this paper is organized as follows: Section 2 outlines the dataset used, EMD, and the proposed method; Section 3 presents and discusses the results; and Section 4 states the conclusions of this work.
2 Methodology
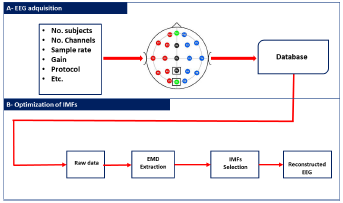
This section outlines the methodology used in this study. Fig. 1 illustrates our method in the form of a block diagram. The methodology comprises two main components: a description of the dataset used and an explanation of the EMD method and our proposal, which employs restriction metrics. The overarching objective of this research endeavor was to minimize the number of IMFs required for the reconstruction of EEG signals while retaining relevant information. This systematic approach facilitates a comprehensive understanding of the experimental setup and the analytical framework employed in this work.
2.0.1 Data description
The dataset used in this work was the CHB-MIT Scalp EEG database 23,24, which contains 939 hours of recordings that featured 173 seizures (clonic, atonic, tonic). This data set was developed at Boston Children's Hospital, involving patients with intractable seizures who were monitored for several days after the withdrawal of antiseizure medication, in order to characterize their seizures and assess their candidacy for surgical intervention. The dataset consists of bipolar EEG signals from 24 patients that were recorded using 23 channels (FP1-F7, F7-T7, T7-P7, P7-O1, FP1-F3, F3-C3, C3-P3, P3-O1, FP2-F4, F4-C4, C4-P4, P4-O2, FP2-F8, F8-T8, P8-O2, FZ-CZ, CZ-PZ, P7-T7, T7-FT9, FT9-FT10, FT10-T8, and T8-P8). All EEG data were sampled at 256 Hz and 16-bit resolution, using the 10-20 international system and an electrical power line of 120 V and 60 Hz.Fig. 2, presents the raw ictal EEG signals from all 23 channels during an epileptic seizure period of 40 seconds, belonging to the third instance of patient 1.
2.1 Empirical mode decomposition
EMD is an adaptive data analysis method presented by Norden Huang in 1998 as a solution to a problem with the Hilbert transform 25. It essentially aims to empirically identify intrinsic oscillatory modes by their characteristic time scales and then decompose the data accordingly 26. The pseudocode of EMD is shown in Algorithm 1. According to Huang, each IMF should satisfy two conditions 27,28:
In the whole dataset, the number of extrema and zero-crossings should be the same or differ at most by one.
At any instance, the mean value of the envelope of the local maxima and minima should be null.
The signal x(t) can be represented and reconstructed using Eq. (1), where n is the number of IMF.

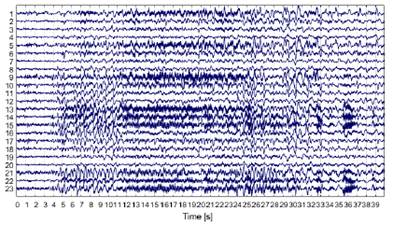
Figure 2 Raw ictal EEG signals from all channels in the third instance of patient 1 of the CHB-MIT dataset
The computational complexity of EMD for a signal of length N is O(NlogN), which makes it a computationally demanding method, especially when dealing with large datasets 29.
2.2 EMD optimized for the selection of relevant IMFs
This approach aims use EMD to select the most relevant IMFs for the detection of epileptic seizure segments from a raw EEG signal. Since IMFs are assumed to be nearly orthogonal components of the original signal, each relevant IMF should be relatively well correlated with the original signal. This presupposes that irrelevant IMFs are poorly correlated with the original signal and can thus be discriminated.

Fig. 3 depicts the proposed methodology for selecting the most relevant IMFs in a raw EEG signal. First, the EMD method decomposes the raw EEG signal into a different number of IMFs. Then, four metrics of discrimination are computed from each IMF, i.e., the Minkowski distance, the MSE, cross-correlation, and the entropy function. To obtain the most relevant IMFs, a threshold т е defined by Eq.(2) is applied to each metric. To select the IMFs, their values for the first three metrics should not surpass the threshold те, while the cross-correlation metric should exceed it. Finally, two relevant sets of IMFs are formed (union and intersection) for rebuilding the EEG signal and evaluating the best option.
| Algorithm 1 Sifting process for EMD |
| Input: The raw signal x(t), for m = 1...,M. |
| Output: IMFs array |
| Sifting: True; |
| 1: while sifting = True do |
| 2: Extract extrema (maxima and minima) from x(t). |
| 3: Interpolate to obtain the envelope of extrema |
| 4: Compute the local mean m(t) = (emin + emax)/2. |
| 5: Compute the modal function d(t) = x(t) - m(t). |
| 6: if d(t) satisfies the stopping criterion then |
| 7: IMFi ← d(t) |
| 8: sifting = False |
| 9: else |
| 10: x(t) ← d(t) |
| 11: sifting = True |
| 12: end if |
| 13: if x(t) is not monotonic then |
| 14: Continue; |
| 15: else |
| 16: Break; |
| 17: end if |
| 18: end while=0 |
| return IMFs array |
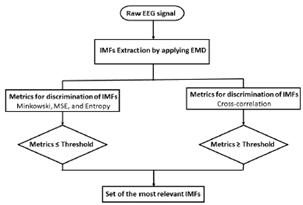
We selected Minkowski distance, MSE, cross-correlation, and entropy as the primary metrics because of their ability to effectively quantify signal similarity and information content. Minkowski distance generalizes multiple distance measures, which makes it adaptable to different signal characteristics. The MSE evaluates the error between reconstructed and original EEG signals, ensuring minimal loss of relevant information. Cross-correlation measures temporal similarity, which is essential for identifying seizure patterns, while entropy quantifies signal complexity, enabling the discrimination of structured and noisy IMFs. Additionally, we compared these metrics against alternative methods, such as spectral entropy and statistical moment-based measures, concluding that our selection provides the best trade-off between sensitivity and computational efficiency.
2.2.1 Minkowski distance
This metric is a measure of similarity and distance 30-32. Also called Euclidean distance, it helps to determine the distance between two vectors X and Y. It can be calculated as follows 33:

where x i and y i are the i - th samples of the original EEG signal and the extracted IMF. According to 34, redundant IMFs differ from the original signal in shape and frequency content, which means that irrelevant ones exhibit a maximum value of d mink . The computational complexity of Minkowski distance is O(N), making it efficient for large-scale EEG analysis.
2.2.2 Cross-correlation
This is a measure of similarity between two signals x and y. The cross-correlation R estimated using Eq. (4):

where x j and y (i+j) are the j -th samples of the original EEG signal and the extracted IMF, respectively. In this case, the computational complexity is O(NlogN).
2.2.3 Mean square error
The MSE measures the average of the squares of the errors, i.e., the difference of the average squares for the estimated and actual values of the signal. This is given by Eq. (5).

where x i and y i are the i - th samples of the original raw EEG signal and the extracted IMF. The computational complexity is O(N).
2.2.4 Entropy function
An entropy-based cost function is applied to each IMF 4,35, as defined by Eq. (6).

To reconstruct the estimated EEG signal
 an automatic selection of the set of IMFs with the lowest entropies O = e
i
, delimited by the threshold т
е, is performed. The computational complexity is
an automatic selection of the set of IMFs with the lowest entropies O = e
i
, delimited by the threshold т
е, is performed. The computational complexity is

2.3 Accuracy assessment
The Wasserstein metric (Wm) (also known as either the Kantorovich-Rubinstein metric or earth-movers distance)15,36, was used as a quality criterion of signal reconstruction accuracy. This metric provides a comparison between the truth X(t) and the estimated EEG signal
 . The index W
m is defined by 8. A lower Wm value represents a better signal reconstruction accuracy.
. The index W
m is defined by 8. A lower Wm value represents a better signal reconstruction accuracy.

The correlation coefficient r is a measure of similarity between two signals. It is defined by the ratio of covariance to variance, as shown in 9.

Unlike the wavelet and Fourier transforms, which rely on predefined basis functions 37, the EMD-optimized method adaptively decomposes signals based on their intrinsic oscillations. This adaptive nature makes it particularly effective for analyzing nonstationary EEG signals. While deep learning models have yielded promising results in seizure detection, their lack of interpretability remains a significant challenge. In contrast, our approach enhances explainability by explicitly selecting IMFs based on signal characteristics, thus ensuring a more transparent and interpretable feature extraction process. Given that these selection metrics are applied to K IMFs, the computational complexity of the selection process is O(KNlogN).
3 Results
This section analyzes and discusses the outcomes derived from the implementation of our methodology, as well as the validation tests conducted in accordance with the procedures outlined above. The implementation was carried out using the MATLAB R2020b software, and the validation was conducted using EEGLAB. This study focused on channel CZPZ of patient 1, for which two signals were analyzed: a normal EEG signal from the first instance and an ictal EEG signal from the third instance.
Fig. 4 presents a comparison between raw normal and ictal EEG signals, revealing a significant increase in the power of the ictal EEG signal within the low-frequency range, specifically between 0 and 6 Hz, in contrast to the normal signal. This increase in power can be attributed to the presence of synchronized neuronal activity during ictal episodes. In the context of epileptic seizures, abnormal neuronal activity often manifests as an excessive synchronization of neurons in specific brain regions. This synchronization leads to the generation of low-frequency electrical signals, contributing to the power increase observed in the frequency spectrum of the ictal EEG signal when compared to the normal one. These findings characterize the distinctive hyperexcitatory neuronal activity of epileptic seizures, providing valuable insights for the detection and understanding of these neurological events.
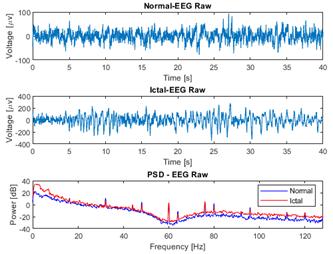
Figure 4 Comparison of raw EEG data from normal and ictal EEG signals and their power spectral density (PSD), as obtained from channel CZPZ of the first and third instances of patient 1 of the CHB-MIT dataset
3.1 Analysis of EMD
The initial phase of the analysis involved the application of EMD to the raw EEG signals, hereafter referred to as the EEG-normal and EEG-ictal signals. Each raw EEG signal underwent decomposition into a series of IMFs, arranged according to its frequency components from highest to lowest (designated as IMF1 to IMF8 in this instance). Upon conducting the database analysis via EMD, eight IMFs were derived per signal, as illustrated in Figs. 5 and 6. This systematic decomposition process facilitated the extraction of signal components across varying frequency ranges, enabling a comprehensive examination of the EEG dataset.
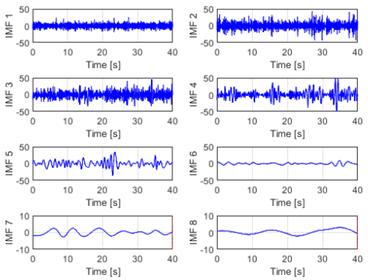
Figure 5 EMD of an EEG-normal signal using eight IMFs of the CZPZ channel corresponding to the first instance of patient 1 in the CHB-MIT dataset
The second step of the analysis was reconstruction, which utilized the initial six IMFs extracted from each signal. This reconstruction process aimed to synthesize the signals based on the dominant frequency components captured by the selected IMFs. The reconstructed signals were then subjected to PSD analysis in order to discern the signal power distribution across different frequency bands. This analytical approach facilitated the examination of the frequency characteristics inherent in the EEG signals, providing insights into the underlying neuronal activity patterns associated with normal and ictal states. Fig. 7 illustrates the PSD diagrams obtained from the reconstructed signals, which describe the frequency composition of the EEG data under study.
The reconstructed EEG-normal and EEG-ictal signals, as observed in Fig. 7, exhibit a remarkably similar behavior to that shown in Fig. 4, despite the processing conducted through EMD. This finding suggests the presence of high-frequency noise that was not eliminated during the reconstruction process, as no pre-processing stage was applied. Consequently, there is an evident need to employ a reliable alternative to supplement this pre-processing stage in EEG signals. Such an approach would enhance reconstruction quality and facilitate a more accurate interpretation of the obtained data.
3.2 Analysis of the optimal selection of IMFs (optimized EMD)
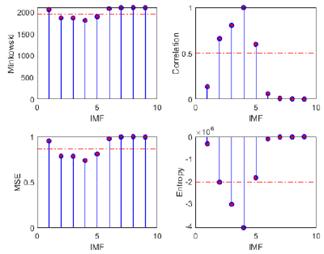
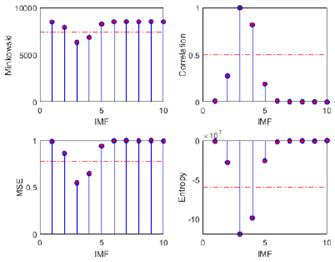
The primary objective of the proposed methodology, termed optimized EMD, was to optimize the selection of IMFs containing relevant information, aligning the raw EEG signals within frequency bands for the study of epileptic seizure detection. To this effect, four discrimination metrics based on a predefined threshold were employed. The outcomes of these discrimination techniques, encompassing Minkowski distance, cross-correlation, MSE, and entropy, alongside the evaluation metrics used for accuracy assessment (the correlation coefficient, p-value, and Wm), are systematically presented in Tables I and II. In addition, they are depicted in Figs. 8 and 9, where the threshold те is denoted by a dashed red horizontal line. The results evince a superior performance for the EEG-ictal signal. This meticulous analysis facilitates a comprehensive evaluation of the efficacy and reliability of the proposed method in discerning relevant IMFs for epileptic seizure detection.
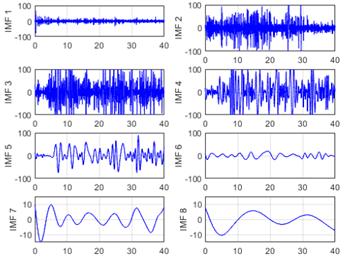
Figure 6 EMD of an EEG-ictal signal using eight IMFs of the CZPZ channel corresponding to the third instance of patient 1 in the CHB-MIT dataset
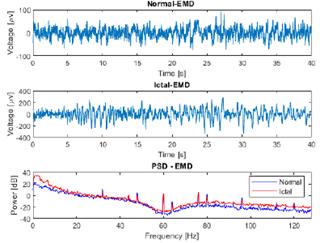
Figure 7 Comparative analysis of EMD applied to the first six IMFs for the reconstruction of normal and ictal EEG signals corresponding to the CZPZ channel of the first and third instances of patient 1
Table I Metrics for the selection of relevant IMFs in the normal EEG signal from channel CZPZ of patient 1's first instance
| Metric | IMFs retained after invoking threshold | Correlation coefficient with original signal | p-Value | Wm |
|---|---|---|---|---|
| Minkowski | 2,3,4,5 | 0.9680 | 0 | 5.1979 |
| Cross-corr | 2,3,4,5 | -0.0153 | 0.1207 | 86.9605 |
| MSE | 2,3,4,5 | -0.0153 | 0.1207 | 86.9605 |
| Entropy | 3,4 | -0.0068 | 0.4928 | 77.7654 |
Table II Metrics for the selection of relevant IMFs in the ictal EEG signal from channel CZPZ from patient 1's third instance
| Metric | IMFs retained after invoking threshold | Correlation coefficient with original signal | p-value | Wm |
|---|---|---|---|---|
| Minkowski | 3,4 | 0.8852 | 0 | 39.1013 |
| Cross-corr | 3,4 | 0.8852 | 0 | 39.1013 |
| MSE | 3,4 | 0.8852 | 0 | 39.1013 |
| Entropy | 3,4 | 0.8852 | 0 | 39.1013 |
Figs. 10 and 11 provide a visual comparison between the original raw EEG-normal and EEG-ictal signals, alongside the reconstructed (rEEG) signals corresponding to channel CZPZ. The reconstruction outcomes are succinctly summarized in Table III. Remarkably, the reconstructed signals exhibit a notable absence of noise. These findings underscore the effectiveness of the proposed methodology in attenuating noise and enhancing signal fidelity, thereby contributing to the accurate representation of EEG activity in both normal and ictal states.
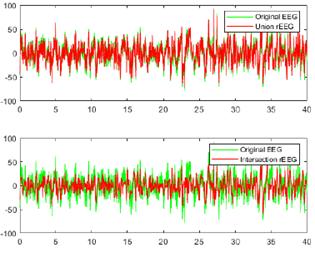
Figure 10 Comparison between the original raw and reconstructed EEG-normal signals using union and intersection on channel CZPZ
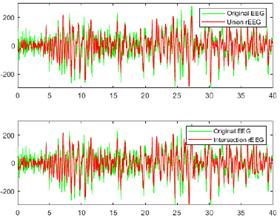
Figure 11 Comparison between the original raw and reconstructed EEG-ictal signals using union and intersection on channel CZPZ
Table III Accuracy assessment of optimized EMD on channel CZPZ
| Operation | Wm | Correlation coefficient | Optimal IMFs | |||
|---|---|---|---|---|---|---|
| Normal EEG | Ictal EEG | Normal EEG | Ictal EEG | Normal EEG | Ictal EEG | |
| Union | 5.1979 | 39.1013 | 0.9680 | 0.8852 | 2,3,4,5 | 3,4 |
| Intersection | 13.7360 | 39.1013 | 0.7484 | 0.8852 | 3,4 | 3,4 |
An assessment of signal reconstruction employing optimized EMD is presented in Table III and illustrated in Fig. 12. The findings reveal a superior signal reconstruction for the EEG-ictal signal utilizing only two IMFs, resulting in enhanced performance index values, including a correlation coefficient of 0.88 and a Wm of 39.10 for both operation modes (union and intersection). The PSD diagram depicted in Fig. 12 underscores two key facts. Firstly, the proposed methodology effectively confines the signal within the operational bandwidth, serving as a low-pass filter to mitigate noise originating from high frequencies, such as the 120 V and 60 Hz power line interference. Secondly, it elucidates the augmented power distribution in low-frequency bands within the EEG-ictal signal compared to the EEG-normal one. This comprehensive evaluation highlights the efficacy of the proposed method in enhancing signal fidelity and discerning features relevant to epileptic seizure activity.
To assess the efficacy of optimized EMD, performance indices such as the correlation coefficient and the Wm were employed in a comprehensive evaluation. This evaluation was conducted on ictal EEG recordings obtained from all channels corresponding to the third instance of patient 1. The results of this evaluation, conducted with a statistical significance threshold of ρ < 0.05, are presented in Table IV. Such rigorous testing provides valuable insights into the performance and reliability of optimized EMD in the context of epileptic seizure detection.
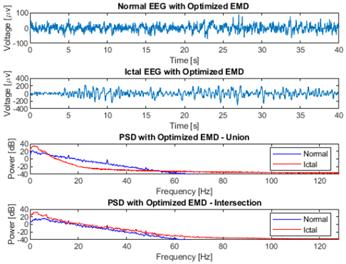
Figure 12 Comparative analysis of the use of optimized EMD on EEG-normal and EEG-ictal signals from channel CZPZ of the third instance of patient 1 in the CHB-MIT dataset
The use of optimized EMD to pre-process the raw EEG signal constitutes a novel approach to epileptic seizure detection. When applied to raw EEG signals without a pre-processing stage, a comparison of power spectra between raw and EMD-processed EEG instances does not reveal significant disparities, as illustrated in Figs. 4 and 7. In both scenarios, analogous high-frequency power peaks are discerned, encompassing the 60 Hz frequency associated with the power line. When applying the proposed method, a significant improvement was observed in identifying the range of frequencies of interest (Fig. 12). In this context, the method acts as a low-pass adaptive filter, eliminating the need for a reference signal, which is common in conventional adaptive filters. This technique enables the effective suppression of high frequencies, including the frequency of the electrical line, which does not contribute to the acquisition of relevant information on the studied pathology.
By decomposing signals into IMFs, the proposed method facilitates the extraction of essential information for precise seizure identification. The process of selecting the most relevant IMFs, guided by thresholds and discrimination metrics such as the Minkowski distance, cross-correlation, MSE, and entropy function, is of paramount importance. This meticulous process plays a pivotal role in enhancing the accuracy and reliability of seizure detection. This ensures that only IMFs that contain significant information relevant to epileptic activity are retained, thus reducing computational complexity and improving detection performance. The results presented in Table IV and depicted in Fig. 12 evidence notable performance indices and demonstrate the capability of discriminating irrelevant information in both union and intersection modes.
Table IV Accuracy assessment of optimized EMD for all channels from patient 1's third instance
| Channel | Wm | Correlation coefficient | Optimal IMFs | |||
|---|---|---|---|---|---|---|
| Union | Intersection | Union | Intersection | Union | Intersection | |
| FP1-F7 | 33.93 | 33.93 | 0.83 | 0.83 | 3,4 | 3,4 |
| F7-T7 | 23.69 | 23.69 | 0.87 | 0.87 | 3,4,5 | 3,4 |
| T7-P7 | 57.05 | 57.05 | 0.85 | 0.85 | 3,4 | 3,4 |
| P7-O1 | 88.94 | 104.08 | 0.75 | 0.63 | 4,5 | 4,5 |
| FP1-F3 | 41.22 | 41.22 | 0.91 | 0.91 | 3,4 | 3,4 |
| F3-C3 | 69.53 | 69.53 | 0.71 | 0.71 | 3,4 | 3,4 |
| C3-P3 | 33.93 | 33.93 | 0.83 | 0.83 | 3,4 | 3,4 |
| P3-O1 | 23.69 | 23.69 | 0.87 | 0.87 | 3,4,5 | 3,4 |
| FP2-F4 | 57.05 | 57.05 | 0.85 | 0.85 | 1,3,4 | 3,4 |
| F4-C4 | 88.94 | 104.08 | 0.75 | 0.63 | 3,4 | 3,4 |
| C4-P4 | 41.22 | 41.22 | 0.91 | 0.91 | 3,4 | 3,4 |
| P4-O2 | 69.53 | 69.53 | 0.71 | 0.71 | 3,4 | 3,4 |
| FP2-F8 | 33.93 | 33.93 | 0.83 | 0.83 | 4 | 4 |
| F8-T8 | 23.69 | 23.69 | 0.87 | 0.87 | 4 | 4 |
| T8-P8 | 57.05 | 57.05 | 0.85 | 0.85 | 3,4 | 3,4 |
| P8-O2 | 88.94 | 104.08 | 0.75 | 0.63 | 3,4 | 3,4 |
| FZ-CZ | 41.22 | 41.22 | 0.91 | 0.91 | 3 | 3 |
| CZPZ | 39.10 | 39.10 | 0.88 | 0.88 | 3,4 | 3,4 |
| P7-T7 | 69.53 | 69.53 | 0.71 | 0.71 | 3,4 | 3,4 |
| T7-FT9 | 33.93 | 33.93 | 0.83 | 0.83 | 4,5 | 4,5 |
| FT9-FT10 | 23.69 | 23.69 | 0.87 | 0.87 | 3,4 | 3,4 |
| FT10-T8 | 57.05 | 57.05 | 0.85 | 0.85 | 1,2,3,4,5 | 4,5 |
| T8-P8 | 88.94 | 104.08 | 0.75 | 0.63 | 3,4 | 3,4 |
In the union mode, even when employing a single channel such as Fp2-F8, F8-T8, and FZ-CZ, correlation coefficients ranging between 0.83 and 0.91 and Wm values of 23.69-41.22 were observed. These values either surpassed or were at least equivalent to those obtained from channels utilizing more than three IMFs, such as F7-T7, P3-O1, FP2-F4, and FT10-T8. In intersection mode, the majority of channels required only two IMFs for effective operation, particularly emphasizing IMF3 and IMF4, with the exception of channels Fp2-F8, F8-T8, and FZ-CZ, which demonstrated efficacy with a single IMF, particularly IMF4. Furthermore, the outcomes derived from brain mapping facilitated the validation of our proposal by enabling the identification of the characteristic frequency range of epileptic seizures. Moreover, the localization of active electrodes represents a noteworthy advancement. Through the identification of IMFs harboring the most relevant information, this method enhances the identification of frequency bands in seizure detection, offering valuable insights into the underlying neural dynamics of seizure events.
3.3 Analysis of brain activity mapping
To assess the effectiveness of the proposed method, a graphical evaluation was conducted using the EEGLAB software, focusing on brain mapping for ictal EEG signal recordings from all channels belonging to the third instance of patient 1. Two scenarios were examined: firstly, ictal EEG signals without EMD processing, and, secondly, ictal EEG signals reconstructed via optimized EMD. Intersection mode data from Table IV were utilized for signal reconstruction. For each channel, a digital band-pass filter (0.1-55 Hz) was implemented, and the segments that were visibly affected by technical artifacts were removed, such as eye movements, muscle movements, and sweating, etc. Subsequently, for each EEG, the channel exhibiting the highest power was identified through spectral response analysis.
The results depicted in Fig. 13 indicate the occurrence of maximum power magnitudes at high frequencies (1,16, 32, and 48 Hz), primarily attributable to additive noise rather than genuine neuronal activity. Consequently, the identification of electrodes with higher brain activity was hindered. Conversely, Fig. 14 demonstrates that the application of optimized EMD acts as a low-pass filter, effectively attenuating the high frequencies associated with noise interference and other artifacts. This facilitated the identification of heightened brain activity in electrodes F7, F10, and Pz.
From these observations, it can be inferred that the application of optimized EMD to EEG signals satisfactorily serves as a pre-processing stage, substantially enhancing signal reconstruction by confining it within the requisite bandwidth for epileptic seizure detection.
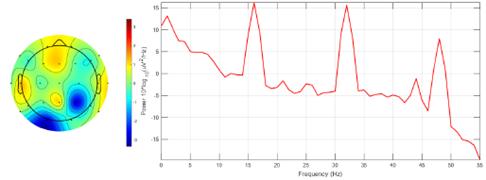
Figure 13 Brain mapping and activity power spectrum of the ictal EEG signal obtained from the third instance of patient 1 without EMD
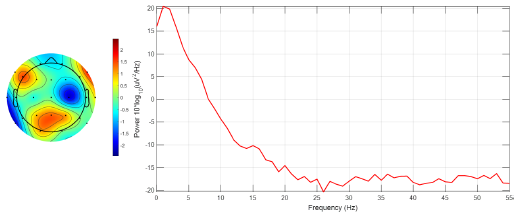
Figure 14 Brain mapping and activity power spectrum of the ictal EEG signal obtained from the third instance of patient 1 after applying optimized EMD
In forthcoming endeavors, our attention will be directed towards validating the proposed methodology through feature extraction techniques seeking to predict and classify epileptic seizures using larger and more diverse datasets. In addition, we plan to conduct clinical trials in order to assess the performance of our method in real-world scenarios. Furthermore, we will explore the potential integration of machine learning algorithms to enhance the accuracy of seizure detection. Such endeavors hold promise for the advancement of epilepsy diagnosis and treatment.
3.4 Robustness analysis: optimal IMF selection in diverse EEGs of epilepsy patients
This study evaluated the robustness of an optimal IMF selection method for epilepsy detection, analyzing EEG data from four patients in the CHB-MIT database, including cases of focal and generalized seizures. Three of these patients had focal seizures (patients 1, 2, and 3), while the fourth experienced generalized seizures. The analysis was performed using the 23 EEG channels available in each patient to compare the optimal selection of IMFs.
The results reveal a marked inter- and intra-patient variability in the channel-specific optimal IMFs, underscoring the necessity of personalized approaches in EEG analysis (Table V). Specifically, the first three patients, with focal seizures, exhibit a predominance of IMFs 3 and 4 across most channels. In contrast, the fourth patient, experiencing generalized seizures, displays a more diverse selection of optimal IMFs, reflecting the increased complexity of the EEG signals associated with this seizure type. The identification of patient- and channel-specific optimal IMFs, predominantly within the range of IMFs 1 to 6, demonstrates their relevance for epilepsy detection and suggests that personalized IMF selection can significantly improve the accuracy of detection algorithms, as well as the differentiation between focal and generalized seizures.
Table V Channel-specific optimal IMFs for epilepsy patients
| Channel | Optimal IMFs | |||
|---|---|---|---|---|
| Patient 1 | Patient 2 | Patient 3 | Patient 4 | |
| FP1-F7 | 3,4 | 3,4 | 4,5 | 4 |
| F7-T7 | 3,4 | 4 | 3,4 | 1,2,4,5 |
| T7-P7 | 3,4 | 2,3,4 | 1,2,3,4 | 1,2,4,5 |
| P7-O1 | 4,5 | 3,4 | 3,4 | 1,4 |
| FP1-F3 | 3,4 | 3,4 | 3,4 | 3,4 |
| F3-C3 | 3,4 | 3,4 | 3,4 | 4 |
| C3-P3 | 3,4 | 3 | 3,4 | 1,2,3,4 |
| P3-O1 | 3,4 | 1,2,3,4 | 4,5 | 1,2 |
| FP2-F4 | 3,4 | 3,4 | 3,4 | 4,5 |
| F4-C4 | 3,4 | 3,4 | 4,5 | 1,2,4 |
| C4-P4 | 3,4 | 2,3 | 3,4 | 1,2,4 |
| P4-O2 | 3,4 | 2,3 | 3,4 | 1,2,3,4,5 |
| FP2-F8 | 4 | 3,4 | 3,4 | 1,2 |
| F8-T8 | 4 | 3,4 | 4,5 | 1,2,4,5 |
| T8-P8 | 3,4 | 3 | 1,2 | 1,2 |
| P8-O2 | 3,4 | 2,3 | 1,4 | 1,2,3,4 |
| FZ-CZ | 3 | 3,4 | 4,5 | 4 |
| CZPZ | 3,4 | 2,3 | 3 | 3,4 |
| P7-T7 | 3,4 | 2,3,4 | 1,2,3,4 | 1,2,4,5 |
| T7-FT9 | 4,5 | 4 | 4,5 | 1,2,6 |
| FT9-FT10 | 3,4 | 3,4 | 4,5 | 3,4 |
| FT10-T8 | 4,5 | 3,4,5 | 1,5 | 1,2,4 |
| T8-P8 | 3,4 | 3 | 1,2 | 1,2 |
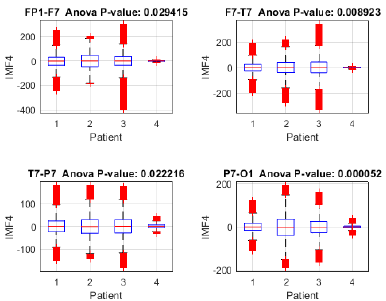
Figure 15 Variance analysis of IMF 4 across channels Fp1-F7, F7-T7, T7-P7, and P7-O1 between focal seizure patients and a seizure-free subject
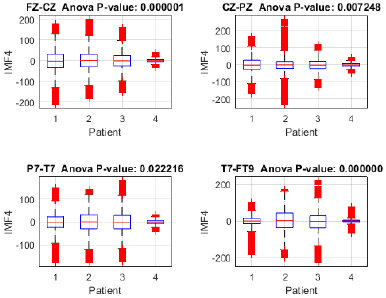
Figure 16 Variance analysis of IMF 4 across channels Fz-Cz, Cz-Pz, P7-T7, and T7-FT9 between focal seizure patients and a seizure-free subject
To assess the proposed method's capacity for discriminating between focal seizure (patients 1, 2, and 3) and seizure-free (patient 4) signals, an analysis of variance (ANOVA) was performed on IMF 4 across the Fp1-F7, F7-T7, T7-P7, and P7-O1 channels (Fig. 15), revealing significant differences between the three patients with focal seizures and the seizure-free subject (p < 0.05 in all channels), with the highest significance observed in P7-O1 (p = 0.000052). These findings suggest that IMF 4 may capture relevant information for identifying focal epilepsy, particularly in the occipital region. Moreover, the ANOVA of IMF 4 in the FZ-CZ, CZ-PZ, P7-T7, and T7-FT9 channels (Fig. 16) revealed significant differences between patients with focal seizures and the seizure-free subject (p < 0.05 in all channels), with the most pronounced differences in FZ-CZ (p = 0.000001) and T7-FT9 (p < 0.000001). These findings highlight the relevance of IMF 4 in distinguishing focal epilepsy, particularly in the central and temporal regions, suggesting the need to complement the analysis with power estimations in order to quantify the magnitude of these differences.
To further investigate this differentiation, the analysis was complemented by estimating the power of IMF 4 in each channel and patient. The power distribution in channels FP1-F7, F7-T7, T7-P7, and P7-O1 revealed notable differences between patients with focal seizures and the seizure-free subject (Fig. 17). Patients 1, 2, and 3 exhibited higher power across all evaluated channels, whereas patient 4 showed considerably lower values. Notably, the frontotemporal channels (FP1-F7 and F7-T7) reported the highest values, suggesting that IMF 4 captures relevant information in these regions, likely related to the propagation of epileptic activity. Similarly, the power distribution of IMF 4 in channels FZ-CZ, CZ-PZ, P7-T7, and T7-FT9 exhibits comparable trends, further supporting the relevance of this component in distinguishing focal epilepsy. Notably, patients 1, 2, and 3 showed higher power values compared to patient 4, reinforcing the association between IMF 4 and epileptiform activity.
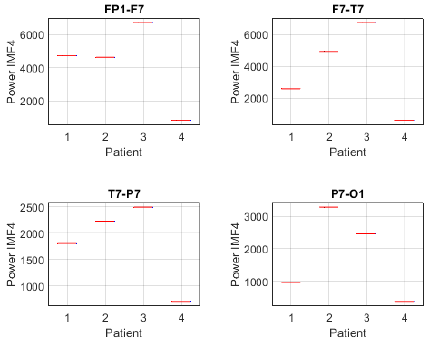
Figure 17 Power distribution of IMF 4 across channels Fp1-F7, F7-T7, T7-P7, and P7-O1 between focal seizure patients and a seizure-free subject
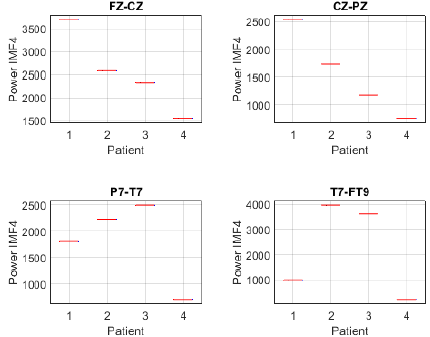
Figure 18 Power distribution of IMF 4 across channels Fz-Cz, Cz-Pz, P7-T7, and T7-FT9 between focal seizure patients and a seizure-free subject
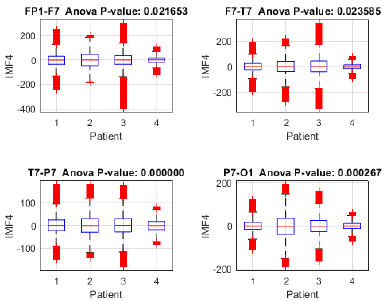
Fig. 19 illustrates the distribution of IMF 4 in patients with focal (1-3) and generalized (4) seizures, revealing significant inter-subject differences according to the ANOVA (p < 0.05). Channels T7-P7 (p = 0.000000) and P7-O1 (p = 0.000267) exhibited the highest variability, suggesting that IMF 4 captures distinctive brain activity patterns. The presence of outliers indicates possible transient events or epileptiform discharges, particularly in T7-P7. These findings highlight the potential of IMF 4 for distinguishing between seizure types, although further validation with a larger patient cohort is recommended to ensure the robustness of the method.
4 Conclusions
This study proposed an optimized method for the selection of intrinsic mode functions using empirical mode decomposition for epileptic seizure detection in raw electroencephalogram signals. The results demonstrated that IMF 4 plays a crucial role in distinguishing focal epilepsy, as indicated by the power distribution across different EEG channels. Patients with focal seizures exhibited significantly higher power values in specific frontotemporal and central-parietal channels in comparison with seizure-free subjects, reinforcing the relevance of IMF 4 in the characterization of epileptiform activity.
The proposed method provides an alternative to traditional EEG pre-processing techniques, potentially reducing computational cost while preserving critical signal information for classification. Moreover, the selection process, based on discrimination metrics such as Minkowski distance, cross-correlation, and entropy, showcased an effective way to identify relevant IMFs with a computational complexity of O(KNlogN), making our proposal suitable for large-scale EEG datasets. However, optimized EMD necessitates multiple iterations (K), which increases the required processing times. For real-time execution, optimization with digital signal processors (DSPs) or graphics processing units (GPUs) is essential for parallel computations. Future research should explore the feasibility of this method in real-time applications, particularly for intracranial EEG (iEEG) signals, which exhibit different noise characteristics and resolution. Additionally, expanding the evaluation to larger and more diverse datasets will further validate the robustness and generalization of this approach.
Ultimately, this methodology contributes to the advancement of adaptive signal processing techniques for epileptic seizure detection, offering a more interpretable and computationally efficient alternative to deep learning-based approaches.

