


 English (pdf)
 Article in xml format
 Article references
 Send this article by e-mail
 Cited by SciELO
  Cited by Google
  Similars in
SciELO
Similars in
SciELO  Similars in Google
 Permalink
1. INTRODUCTION
The world's energy consumption is continuously increasing, primarily driven by the consumption of fossil fuels, which leads to emissions released into the atmosphere, causing environmental problems and climate crises. Using fossil fuels in internal combustion engines (ICE), especially diesel engines widely used in agriculture, industry, and transport, contributes to environmental degradation, and disrupts ecological balance. Governments have closely monitored the environmental impact from diesel and have imposed strict regulations on diesel engine vehicle users. Combustion in ICE should be evaluated comprehensively, considering efficiency, performance, and post-combustion emissions. Recent experiments and projects provide an opportunity to compare fuel performance and environmental impact. Various fuel types are being continuously modified and tested, shedding light on the path toward cleaner and more efficient fuels (Michaels-Katz & Bartter, 1985; Shivakumar et al., 2011).
Recently, nanoparticles (NPs) have attracted considerable interest as they have been shown to enhance the combustion process in ICE, and serve as excellent catalysts in chemical reactions (Sa et al., 2021). Adding nanoparticles to fuel significantly influences the combustion process and plays a crucial role in efficient fuel combustion. Moreover, it has been demonstrated that it reduces harmful exhaust emissions (Yaşar et al., 2019). NPs additives exhibit an active surface area given their nano-sized nature, which promotes rapid oxidation. Their high thermal conductivity improves heat transfer between the flame front and unburnt fuel particles, releasing nearly twice the energy obtained from molecular explosions. This facilitates better and complete combustion of fuel droplets, thus reducing fuel consumption and harmful emissions from diesel engines (Das et al., 2003; Saxena et al., 2017). Cerium oxide (CeO2) nanoparticles have unique properties such as high thermal stability, UV absorbance, electrical conductivity, hardness, specific chemical reactivity, and high oxygen retention and transport capacity. Because of these features, it has many applications, such as glass polishing, automotive, corrosion inhibition for metals, light-sensitive material protective additives, oxidation catalysts, and solar panels. In addition, it also has low production costs. It has been said that cerium oxide nanoparticles added to the fuel affect viscosity and ignition temperature (Arslan & Çelik, 2022). Karthikeyan et al. 2014, highlighted the enhancement of catalytic activity by adding nanoparticles to fuel, reducing ignition delay. They also reported the contribution of nanoparticles to mixing fuel particles with the surrounding air (Karthikeyan et al., 2014). Similarly, Lenin et al. have stated that nanoparticles reduce emissions and improve engine performance (Lenin et al., 2013).
In sum, the addition of nanoparticles to fuels in ICE shows promising results as for improving combustion efficiency, reducing harmful emissions, and enhancing engine performance. Continued research and experimentation in this area are key for developing cleaner and more efficient energy sources, thus contributing to a sustainable future for our planet.
Fuel properties significantly affect fuel spray, fuel/air mixture, combustion process, and pollutant formation. Therefore, numerous experiments are conducted to determine performance and emission characteristics. Experimental studies for ICE optimization can be complex regarding time and cost. Conducting experiments under all operating conditions with varying engine parameters, fuel conditions, and environmental factors is quite complex. Conventional tests are time-consuming and expensive under different load conditions and with differing fuel blends. Therefore, there is a growing interest in minimizing the number of experiments and seeking more economical approaches. Computer-based learning methods have emerged as valuable techniques for predicting engine performance and emission parameters (Uslu, 2020). This approach involves using computer-based models to predict the performance and emissions of different fuel blends. Such methods are developed and validated using data from laboratory experiments, thus increasing their ability to predict engine performance and emissions under current operating conditions. Using these approaches avoids costs of equipment, materials, and labour required to conduct theexperiments. The following research step involves optimization methods to simulate further and predict control effects to save experimental costs and time, one of which is the Response Surface Methodology (RSM) (Ghanbari et al., 2021; Saidur et al., 2008.).
RSM is a set of mathematical and statistical techniques used to model the relationship between independent and response (input and output) variables. Typically, this relationship is approximated using polynomial functions (Alauddin et al., 1997; Elkelawy et al., 2020; Saidur et al., 2008). Unlike other optimization techniques, RSM requires minimal time to complete the process by reducing the number of tests and creating appropriate matrices for testing (Uslu, 2020). As a statistically compatible technique, researchers have widely used RSM to optimize petroleum-based fuels, alternative fuels, fuel additives, and their blends, especially in the context of ICE (Solmaz et al., 2021). Consequently, the time required to conduct experiments and analyse the results is reduced.
(Bharadwaz et al. 2016) conducted predictive modelling using RSM with compression ratio, engine load, and fuel mixture ratio as input parameters. They achieved maximum performance at an 18:1 compression ratio, 5% fuel mixture, and 9.03 kg load. Optimization of output parameters resulted in a brake thermal efficiency of 31.95%, BSFC of 0.37 kg/kWh, CO emission of 0.036%, HC emission of 5 ppm, NOx emission of 531.23 ppm, and particulate matter emission of 15.35% data (Bharadwaz et al., 2016). (Win et al. 2005), used the RSM method to optimize load, speed, and static injection timing on a compression ignition engine to reduce engine noise, fuel consumption, and exhaust emissions (Win et al., 2005). Bose et al. investigated the optimum diesel-ethanol mixture in a single-cylinder 4-stroke compression ignition engine. The input parameters were engine load and ethanol-hexane-diethyl ether mixture, while the output parameters were BSFC, NOx, CO, and HC emissions. The optimal input parameters were 5% hexane, 15% diethyl ether, 40% ethanol, and 40% diesel fuel. RSM data resulted in a BSFC of 221 g/kWh, NOx emission of 22 ppm, CO emission of 0.06%, and HC emission of 34 ppm (Bose et al., 2017).
Najafi et al., 2015, used a composite design of RSM for engine performance and emissions. The input parameters were fuel mixture and engine speed, and experiments were conducted with ethanol additions of 5%, 10%, 15%, and 20% to gasoline at 20004000 rpm. The output parameters included BSFC, power, torque, NOx, CO, CO2, and HC. The study's main goal was to obtain minimal emission values under the best engine conditions. RSM yielded the best results at an engine speed of 3000 rpm and a 10% ethanol and 90% gasoline mixture. The resulting output parameters were power of 35.26 kW, torque of 103.66 Nm, BSFC of 0.25 kg/kWh, CO of 3.5 vol%, CO2 of 12.8 vol%, HC of 136.6 ppm, and NOx of 1300 ppm (Najafi et al., 2015). Safieddin et al. 2020, used the Response Surface Methodology (RSM) to optimize the nano-biochar additive in a fuzel oil and diesel fuel blend. They mixed different ratios of fuzel oil-diesel fuel blends (5%, 10%, 15%, 20%) at various engine speeds (1800, 2000, 2200, 2400, 2600 rpm) and different concentrations of biochar nano-additive (25, 50, 75, 100, 125 ppm). Fuzel oil ratio, engine speed, and nano-additive concentration were chosen as input parameters, while engine torque, engine power, BSFC, and exhaust emissions were selected as output parameters. Among the experimental results, RSM optimization identified that a blend of 100 ppm biochar nano-additive, 10% fuzel oil, and 90% diesel fuel at 2300 rpm provided the best outcome. RSM yielded a prediction within a 5% error of the actual results (Safieddin et al., 2020). Hirkude and Padalkar conducted 36 experiments at a 3-kW engine load, varying compression ratios (16, 17, 18, and 19), injection pressures (200 bar, 225 bar, 250 bar), and injection timings (24°, 27°, and 30° before top dead center). All tests were performed with a 40% biodiesel and 60% diesel blend at a fixed engine speed. They achieved a maximum brake thermal efficiency of 30.6%, minimum BSFC of 0.341 kg/kWh, and minimum smoke emissions of 67 HSU. Using RSM for optimization, they determined the compression ratio to be 17.99, injection pressure at 250 bar, and injection timing at 27° before top dead center, resulting in a brake thermal efficiency of 29.76%, BSFC of 0.289 kg/kWh, and smoke emissions of 56.49 HSU (Hirkude & Padalkar, 2014). Çelik et al. 2022, used the Taguchi method to investigate the effect of n-hexane and n-hexadecane additives at 4%, 8%, and 12% levels in biodiesel and diesel fuels on diesel engine performance and emissions. The study considered fuel additive, additive amount, and fuel type parameters, with fuel type as the dominant factor in the optimization process (Çelik et al., 2022).
2. MATERIALS AND METHODS
In the experimental studies, the four-stroke single-cylinder Antor 3LD510 diesel engine, whose technical specifications are shown in Table 1, was utilized along with the Net Brake engine dynamometer as the engine loading equipment. Throughout the experiments, a 1 g precision load cell with a measurement range of 0-50 kg was used to load the engine. Calibration settings were adjusted according to the manufacturer's user manual instructions. The dynamometer used in the experiments has a measurement range of 0-5000 rpm, and the engine torque measurement range spans from 0 to 350 Nm. Thanks to the microprocessor control of the thyristor driver circuit in the regenerative DC dynamometer, closed-loop speed control is possible, and the dynamometer can also be operated as a motor. The motor speed can be precisely adjusted thanks to the 10-turn potentiometer placed on the dynamometer panel. The Bosch-BEA 350 model emission measurement device was used to measure CO, HC, and NOx exhaust emissions during the tests. In contrast, smoke emissions were calculated using the Bosch-BEA 070 model smoke measurement kit. The measurement range of the emission devices is shown in Table 2 and Table 3. The encoder determines the crank angle position. Regarding the analyses, the encoder must be correctly mapped to the crankshaft. If there is a deviation of 12 degrees in the crank angle, it can cause deviations up to 78% in the heat dissipation analysis. The encoder is connected to the engine output shaft with an elastic coupling. The TDC of the engine was precisely determined with a dial indicator over the piston. Then, the encoder and the data transfer card were connected, and the bolts on the coupling were fixed to the motor shaft when +5V was started to be received from the output signal. Thus, the output signal of the encoder and the TDC of the motor were overlapped by accurately matching the motor.
In the study, Ege NanoTek, a brand CeO2 additive characterized by 20 nm dimensions, 0.8-1.1 g/cm3 bulk density, and 99.98% sensitivity, was procured from the market and introduced into diesel fuel. CeO2 additive was mixed into diesel fuel for diesel engines at 25 ppm, 50 ppm, and 100 ppm ratios. The mixing process was first carried out with a mechanical mixer for 45 minutes and then homogenously mixed using an ultrasonic mixer at 50°C for 1 hour. The experimental setup is depicted in Figure 1. The emission measurement devices used were Bosch-BEA070 and Bosch-BEA350, with their specifications listed in Tables 2 and 3, respectively. The CeO2 nanoparticle additive, described in Table 4, was prepared using an ultrasonic device at various concentrations (25-50-100 ppm), and tested at full load across four different engine speeds (1600-20002400-2800 rpm). The electron microscope image of CeO2 is shown in Figure 2. The accuracy and uncertainty values of the parameters obtained because of the experiments are shown in Table 5.
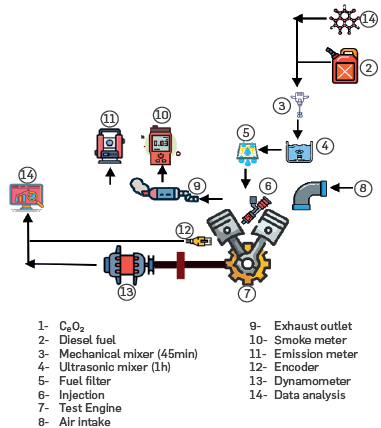
Table 1 Features of the test engine.
| Brand | Antor 3LD510 |
| Engine Type | CI, single-cylinder, four stroke |
| Number of cylinders | 1 |
| Stroke length | 90 mm |
| Stroke Volume | 510 cm3 |
| Cylinder Diameter | 85 mm |
| Compression Ratio | 17.5:1 |
| Maximum Torque | 32.8 Nm (1800 rpm) |
| Maximum Power | 12 kW (3000 rpm) |
| Injection angle | 126° |
| Number of injector holes | 4 |
| Max RPM | 3000 rpm |
Table 2 Bosch BEA070 technical specifications.
| Opacity | k value | |
|---|---|---|
| Measuring Range | 0-%100 | 0.1% |
| Absorption Coefficient (k) | 0-9.99 m-1 | 0.01 m-i |
| Measuring Chamber Length | 215 mm | |
| Application Range | +5 °C-+40 °C | |
| Ambient Relative Humidity | <%90 | |
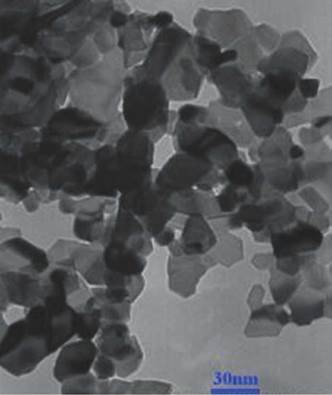
Table 3 Bosch BEA350 technical specifications.
| Measuring range | Accuracy | |
|---|---|---|
| CO | 0-10% vol | 0.001% vol |
| HC | 0-9999 ppm | 1 ppm |
| NO | 0-5000 ppm | <=1 ppm |
| CO2 | 0-18%vol | 0.01% vol |
| O2 | 0-22%vol | 0.01% vol |
Table 4 Properties of nanoparticles.
| Powder Size | 20 nm |
| Purity | %99.995 |
| Surface area | 20-50 m2/g |
| Density (Bulk) | 0,8-1.1 g/cm3 |
| Density (Real) | 7.132 g/cm3 |
Table 5 Measurement accuracy and uncertainties of calculated results
| Parameters | Accuracy (±) | Uncertainty (%) |
|---|---|---|
| Temperature (°C) | ± 1 (°C) | ± 0.1 |
| Time (s) | ± 0.1 s | ± 0.4 |
| Load(N) | ± 1 N | ± 0.25 |
| Engine speed (rpm) | ± 10 rpm | ± 0.2 |
| Fuel (g) | ± 0.1 g | ± 0.1 |
| Exhaust gas temperature (°C) | ± 1 (°C) | ± 0.1 |
| Encoder (°CA) | ± 1° | ± 0.3 |
| Cylinder Pressure Transducer (bar) | ± 0.1 bar | ± 0.1 |
| Brake Specific Fuel Consumption (g/kWh) | --- | ± 0.94 |
| Brake Thermal Efficiency (%) | --- | ± 0.76 |
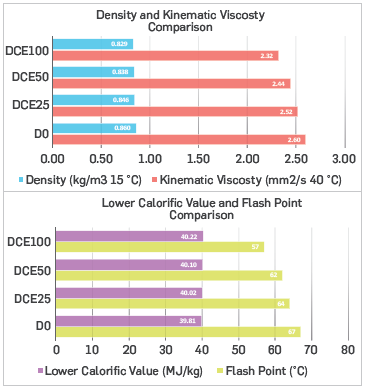
The experimental characteristics of the used fuels are presented in Figure 3. The physical and chemical properties of the fuel directly affect fuel injection atomization, air-fuel mixture formation, combustion, emission properties, and engine efficiency (Qian et al., 2018). Due to their high energy content and higher oxygen-giving ability in their crystal lattice structures, nanoparticles (NPs) cause an increase in the lower calorific values of the added fuels. NPs, which have higher surface area, heat transfer rate, and excellent physical-chemical properties, enable the added fuels to have lower viscosity and density (Bayindirli et al., 2023). Adding CeO2 nanoparticles to the fuel enhances its physical and chemical properties. As the nanoparticle concentration increases, the kinematic viscosity and density decrease. Meanwhile, the lower heating value increases with the CeO2 content, while the flash point decreases.
Brake specific fuel consumption (BSFC) is an essential metric for evaluating engine performance, especially in applications where fuel efficiency is crucial. Essentially, it measures the fuel efficiency of an engine by showing how much fuel is consumed to produce one unit of power in one unit of time. Specific fuel consumption is calculated using equations 1 and 2.
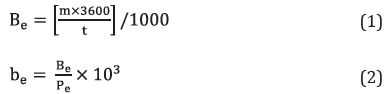
Brake thermal efficiency indicates the effective conversion of energy from fuel into mechanical energy during combustion. Engine design operating conditions, fuel properties, and maintenance status of the engine, among other factors, affect it. Increasing the brake thermal efficiency of diesel engines is economically and environmentally mportant because higher brake thermal efficiency means lower fuel consumption and less waste production. Brake thermal efficiency is calculated using equations 3 and 4.
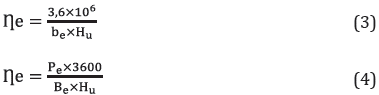
be brake specific fuel consumption (g/kWh)
Be fuel consumption (kg/h)
Pe effective engine power (kW)
Hu Lower heating value (kJ/kg)
USAGE OF RSM
Response Surface Methodology (RSM) is a mathematical modelling technique used to optimize input parameters, primarily in engineering applications and across various industries. This method involves creating and analysing multifactorial models using quantitative data from appropriate experimental designs. These models can be graphically presented as response surfaces, determining how different factors influence the response, explaining the relationships between variables, and revealing the combined effects of all factors on the response surface.
In RSM problems, the relationship between input and output parameters is typically expressed using a second-order polynomial equation, as shown in Equation 5 (Simseket al., 2022). This equation captures the complex interaction between variables and provides nsights into the optimum settings for the input parameters to achieve desired output responses.
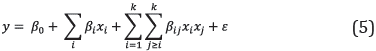
Here, β0 is the intercept, βi, and βij are the linear and interaction coefficients, respectively. Additionally, i represents the linear coefficient, and j represents the quadratic coefficient. Lastly, k ndicates the number of variables, y represents the predicted response, xi, and xj are independent variables, and s denotes the random error term (Yaman et al., 2022)
This analysis aims to validate the optimal engine speed and Ce02 concentration added to diesel fuel using Response Surface Methodology (RSM). Additionally, the objective is to determine the maximum brake thermal efficiency, power, engine torque, and minimum BSFC, CO, HC, NOx, and smoke levels associated with the optimal engine speed and Ce02 concentration.
3. RESULTS ANALYSIS
ANALYSIS OF THE MODEL
ANOVA is used to confirm the suitability of a model by providing numerical information about the p-value. It also provides insights into the effects of a selected variable, chosen as an input parameter, on the responses. In this study, which was conducted with a 95% confidence level, a p-value of less than 0.05 was statistically significant according to ANOVA.
Table 6 presents the p-values for individual factors, their squared terms, and interactive effects for each response. Based on the table, it is evident that both the engine speed and Ce02 concentration mpact all responses. However, it cannot be stated that their nteraction has an effect.
Table 6 P-values of the resulting model.
| Factors | C | V | C2 | V2 | C*V |
|---|---|---|---|---|---|
| Torque | 0.000 | 0.000 | 0.472 | 0.000 | 0.575 |
| Power | 0.000 | 0.000 | 0.153 | 0.000 | 0.956 |
| BSFC | 0.000 | 0.000 | 0.945 | 0.000 | 0.107 |
| BTE | 0.000 | 0.000 | 0.672 | 0.000 | 0.377 |
| CO | 0.024 | 0.000 | 0.598 | 0.010 | 0.919 |
| HC | 0.000 | 0.000 | 0.821 | 0.000 | 0.150 |
| NOx | 0.000 | 0.000 | 0.605 | 0.001 | 0.181 |
| Smoke | 0.000 | 0.000 | 0.175 | 0.380 | 0.484 |
(C: CeO2, V: Engine Speed, C2: CeO2*CeO2, V2: Engine Speed*Engine Speed, C*L: CeO2*Engine Speed)
The regression statistics (R2) values are presented in Table 7, and the regression equations obtained from ANOVA are shown in Table 8. R2 values close to 100% are desired and expected for good statistical fit. In this study, all R2 values greater than 97% and high adjusted R2 values reflect the success of the model and its good fit with the data.
Table 7 (Values of R2).
| Outputs | R2 | R2(adj) | R2(pred) |
|---|---|---|---|
| Torque | %97.82 | %96.73 | %93.22 |
| Power | %99.03 | %98.55 | %97.84 |
| BSFC | %96.98 | %95.47 | %93.65 |
| BTE | %95.68 | %93.53 | %90.09 |
| CO | %97.41 | %96.12 | %93.49 |
| HC | %99.31 | %98.97 | %98.29 |
| NOx | %98.26 | %97.38 | %93.18 |
| Smoke | %99.22 | %98.83 | %97.87 |
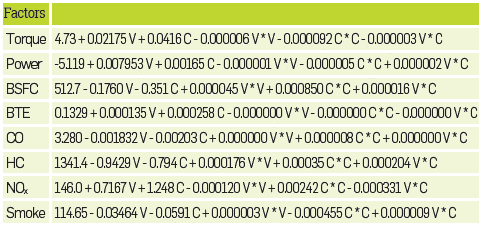
Table 9 Design matrix.
| Engine Speed | CeO2 | Engine Torque | Engine Power | BSFC | BTE | CO | HC | NOx | Smoke |
|---|---|---|---|---|---|---|---|---|---|
| 1600 | 0 | 24.076 | 4.112 | 345.964 | 0.261 | 1.013 | 287 | 977 | 67.2 |
| 1600 | 25 | 25.801 | 4.328 | 342.104 | 0.263 | 0.990 | 279 | 989 | 63.5 |
| 1600 | 50 | 25.851 | 4.379 | 331.502 | 0.271 | 0.979 | 264 | 1030 | 62.8 |
| 1600 | 100 | 26.763 | 4.568 | 324.105 | 0.276 | 0.946 | 238 | 1097 | 56.9 |
| 2000 | 0 | 24.520 | 5.205 | 339.391 | 0.266 | 0.812 | 149 | 1121 | 57.5 |
| 2000 | 25 | 25.970 | 5.303 | 330.023 | 0.273 | 0.724 | 143 | 1132 | 55.3 |
| 2000 | 50 | 26.095 | 5.437 | 324.929 | 0.276 | 0.705 | 132 | 1139 | 54.2 |
| 2000 | 100 | 27.932 | 5.852 | 313.306 | 0.286 | 0.654 | 123 | 1170 | 49.3 |
| 2400 | 0 | 22.625 | 6.071 | 349.549 | 0.259 | 0.450 | 99 | 1176 | 46.3 |
| 2400 | 25 | 23.775 | 6.402 | 348.822 | 0.258 | 0.383 | 93 | 1183 | 45.3 |
| 2400 | 50 | 23.850 | 6.497 | 338.291 | 0.265 | 0.335 | 86 | 1199 | 43.6 |
| 2400 | 100 | 25.058 | 6.895 | 330.261 | 0.271 | 0.300 | 77 | 1229 | 38.8 |
| 2800 | 0 | 19.643 | 6.351 | 373.600 | 0.242 | 0.312 | 83 | 1203 | 39.3 |
| 2800 | 25 | 20.018 | 6.622 | 364.478 | 0.247 | 0.296 | 75 | 1224 | 38.8 |
| 2800 | 50 | 20.693 | 6.697 | 357.357 | 0.251 | 0.280 | 69 | 1239 | 38.1 |
| 2800 | 100 | 21.857 | 7.087 | 350.799 | 0.255 | 0.255 | 58 | 1283 | 30.8 |
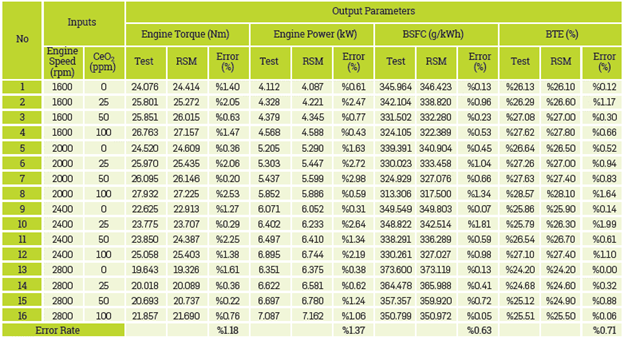
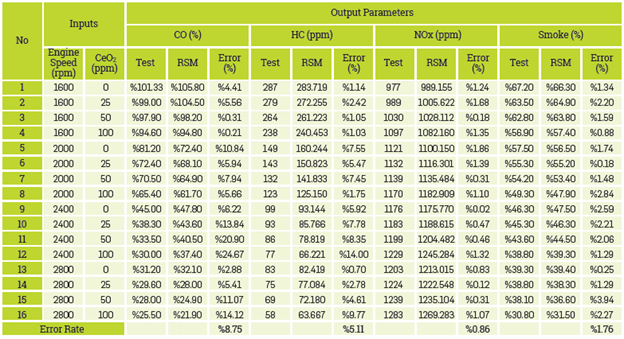
Table 9 displays the experiments and corresponding results of the Response Surface Methodology (RSM). These results were used to create tables and perform optimization.
PERFORMANCE AND EMISSION RESULTS
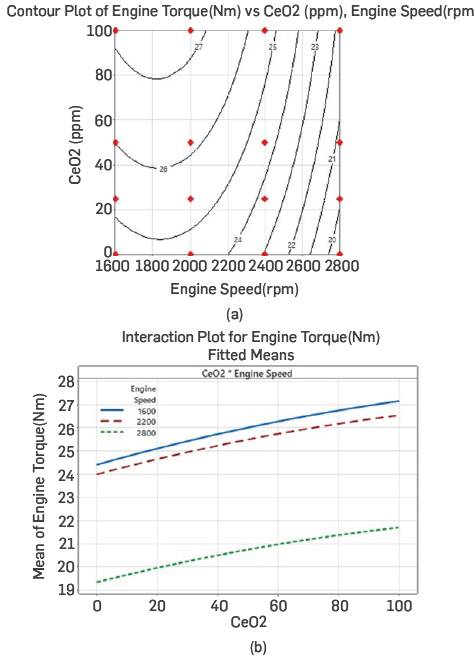
Engine torque, a measure of the engine's ability to perform work, is measured using a dynamometer connected to the experimental setup. Irregularities within the cylinder significantly affect this ability. Additionally, the air-fuel ratio also influences engine torque (Pulkrabek, 2004). The intake duration is shortened when operating at high speeds, leading to incomplete cylinder filling. Consequently, compression and combustion pressures decrease, resulting in a reduction in engine torque (Rao et al., 2015). As shown in Figure 4, an increase in CeO2 concentration is accompanied by an increase in engine torque. The highest torque, measuring 27.932 Nm, was observed at 2000 rpm with a CeO2 concentration of 100 ppm. This represents a 13.91% increase compared to D0 fuel at 2000 rpm.
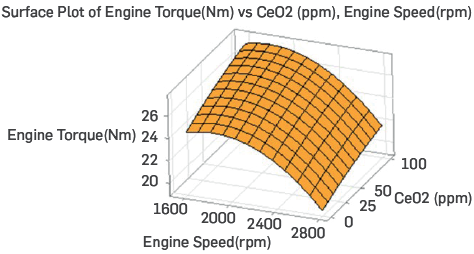
However, as depicted in Figure 5 (b), the interaction graph reveals that an increase in engine speed has led to a decrease in engine torque. The positive effect of CeO2 concentration is supported by the contour graph in Figure 5 (a). The presence of oxygen in CeO2 nanoparticles facilitates the access of fuel particles to oxygen, aiding in complete combustion. This positively affects engine torque (D'Silva et al., 2015; Sajeevan & Sajith, 2013).
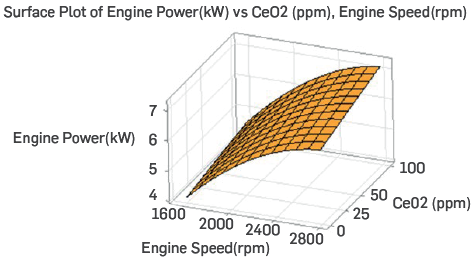
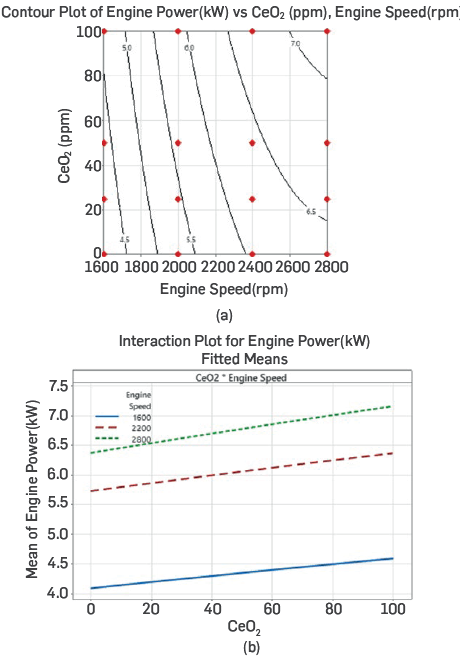
The parameter that determines the engine's ability to perform work is the engine power. It is a function of engine speed and increases with revolutions per minute (rpm). When power reaches its maximum and revolutions continue to increase, power decreases. One of the main reasons for this is the increase in friction losses at high engine speeds. Irregularities in cylinder pressures also influence power (Pulkrabek, 2004). Figure 6 illustrates that power increases with CeO2 concentration and engine speed. With an increase of 11.58%, the highest power was achieved at 2800 rpm with DCe100 fuel. The highest rate of increase in engine power, 13.57%, was measured at 2400 rpm with DCe100 fuel. Figure 7 (a) supports the notion that CeO2 concentration affects power. The addition of nanoparticles improves power by enhancing thermal conductivity (Alahmer et al., 2010). Mixing CeO2 nanoparticles with fuel has reduced fuel density and viscosity. This improvement in cylinder injection has enhanced atomization, improving air/fuel mixture and higher combustion quality. Additionally, it has increased the lower heating value, directly affecting power. Some studies have indicated that nanoparticle additives shorten ignition delay, slightly improve heat release during expansion, and thereby contribute to increased engine power (Hazar et al., 2016; Keskin et al., 2011).
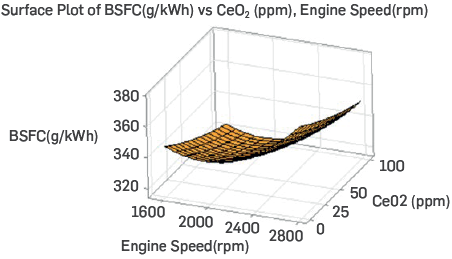
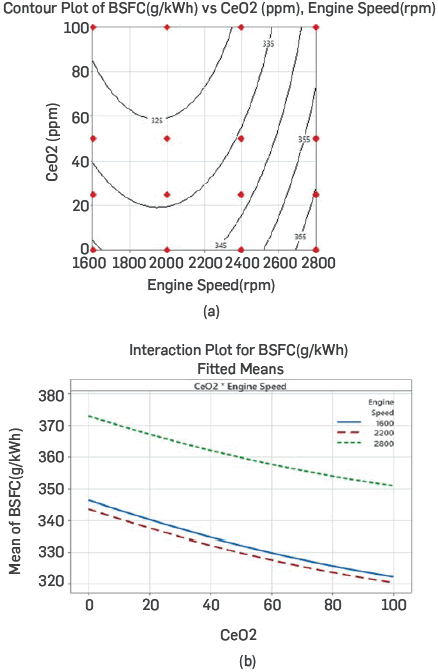
BSFC, a parameter that provides information about how efficiently the fuel supplied to the engine is converted into work, is crucial for engine performance. BSFC is commonly used to represent the fuel consumed per power unit in ICE. Moreover, it is directly related to the lower heating value (Çelik & Bayindirli, 2020). BSFC decreases with increasing engine speed, but after reaching its minimum level, it increases at higher speeds Pulkrabek, 2004). Figure 8 demonstrates a decrease in fuel consumption as CeO2 concentration increases. On the other hand, fuel consumption increases as engine speed increases, as shown in Figure 9 (b). The lowest fuel consumption of 313.306 g/kWh, a reduction of 7.69% compared to D0 fuel, was achieved at 2000 rpm with DCe100 fuel. Additionally, this rate represents the maximum reduction. Figure 9 (a) shows a reduction in fuel consumption towards the right corner of the graph. These are the regions where CeO2 concentration increases and engine speed decreases. The addition of nanoparticles to diesel fuel increases the Lower heating value and results in reduced fuel consumption Furthermore, an increase in the surface/volume ratio occurs (Arslan & Çelik, 2022).
Brake thermal efficiency i0 expressed by converting the heat energy produced by the engine into practical work at the end of the cycle. Heat losses occur during the cycle, with most heat energy generated during combustion being expelled through exhaust gases and cooling water (Arslan & Celik,2022; Pulkrabek, 2004). Figure 10 illustrates the influence of engine speed and CeO2 concentration on brake thermal efficiency. The highest brake thermal efficiency of 28.6% was achieved with DCe10 0 fuel at 2000 rpm. This represents a 7.25% increase compared to D0 fuel. As observed in Figure 11 (b), an increase in CeO2 concentration positively impacts brake thermal efficiency. However, increasing engine spe2d beyond a certain point decreases brake thermal efficiency. This is supported by the interaction graph in Figure 11 (b). Figure 11 (a) demonstrates that an increase in CeO2 concentration and lower engine speeds positively affect brake thermal efficiency. Adding nanoparticles to the fuel increases the lower heating value and improves the vaporization rate and thermal activity. This, in turn, leads to better combustion. The decrease in viscosity enhances chemical reactions and promotes the growth of fuel droplets' contact surface area. Hence, combustion improves, positively affecting brake thermal efficiency (D'Silva et al., 2015; Murugesan et al., 2020; Soudagar et al., 2018). The reduction in viscosity improves atomization, ensuring better mixing of air and fuel droplets, thereby increasing brake thermal efficiency (Geng et al., 2021).
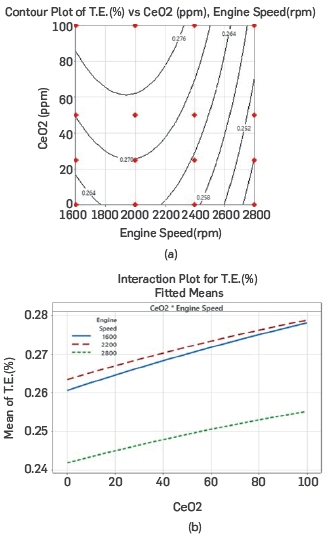
Figure 11 Contour (a) and interactive (b) plot of brake thermal efficiency versus engine speed and CeO2.
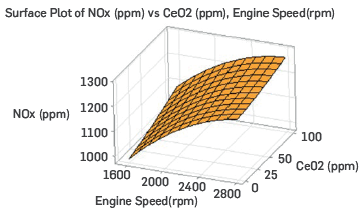
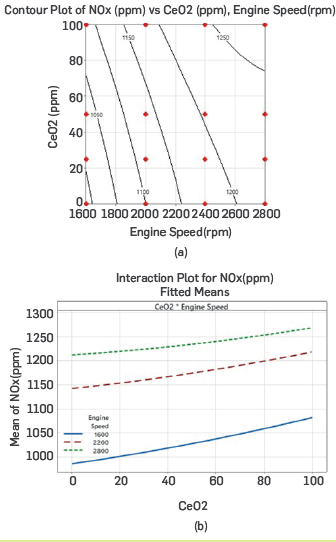
NOx emissions primarily consist of nitrogen molecules from the ambient air that react during combustion. When the temperature rises above 1800 °C during combustion, nitrogen and oxygen molecules react to form NO emissions, a process highly dependent on temperature (Bayindirli & Celik, 2019; Pulkrabek, 2004). As shown in Figure 12, an increase in CeO2 concentration is accompanied by an increase in NOx emissions. Furthermore, an increase in engine speed has a negative impact. The lowest level was observed in D0 fuel at 1600 rpm. The highest emission level was measured in DCe100 fuel at 2800 rpm, where the highest power was achieved. This increase is corroborated by Figure 13 (b) regarding nanoparticle concentration. CeO2 nanoparticles added to the fuel introduce additional oxygen molecules. The surplus oxygen molecules participating in the reaction raise the cylinder's internal temperature, triggering increased NOx emissions. Additionally, the increase in NOx emissions can be attributed to the improvement in brake thermal efficiency brought about by CeO2 nanoparticles (Arslan & Çelik, 2022; Chen et al., 2018; Hossain & Hussain, 2019; Pulkrabek, 2004).
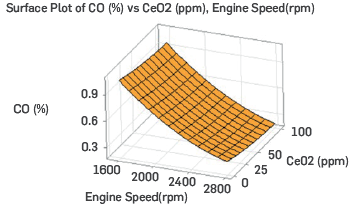
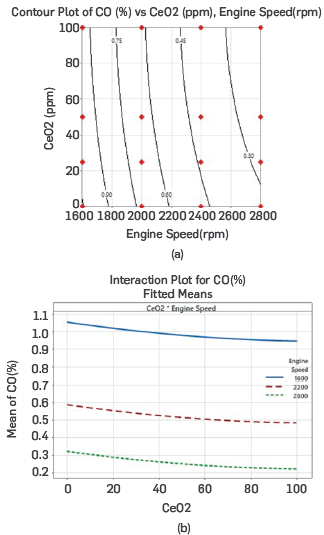
CO emissions are a tasteless, odourless, and colourless gas with poisonous effects. Inhaling excessive amounts can block the passage of oxygen-carrying haemoglobin in the blood. This prevents oxygen from reaching cells, leading to cell death. Factors such as insufficient O2, a non-homogeneous mixture, and shortened combustion duration can trigger CO emissions. A rich mixture inside the cylinder increases emissions during combustion (Dhanasekar et al., 2019; D'Silva et al., 2015). According to Figure 14, CO emissions decrease with an increase in CeO2 concentration and engine speed. The contour plot in Figure 15 (a) shows that increasing CeO2 concentration while keeping the engine speed constant visibly reduces emissions. The lowest rate, 25.5%, was achieved at 2800 rpm with DCe100 fuel. This represents an 18.27% decrease compared to D0 fuel. Figure 15 (b) also clearly demonstrates the impact of increased engine speed on emission reduction. The oxygen molecules introduced by CeO2 nanoparticles, which participate in the reaction, play a significant role in converting CO molecules into CO2. Elevated temperatures enhance combustion reduce emission (Mehregan & Moghiman 2014; Singh etat, 2021).
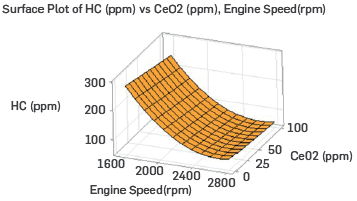
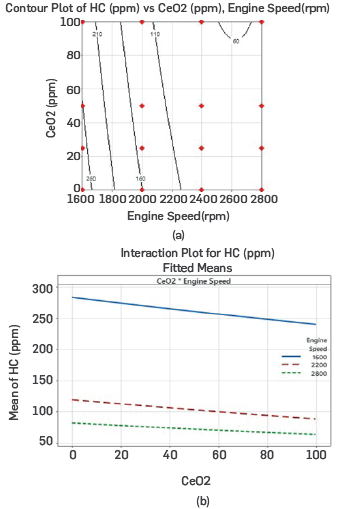
The incomplete combustion of fuel sprayed into the combustion chamber results in the formation of HC emissions. HC is produced when fuel droplets cannot reach oxygen. . As the amount of oxygen molecules taken into the cylinder increases, HC emissions decrease Kumar & Raheman, 2022; Kumar et al., 2019). Additionally, due to high pressure within the cylinder, fuel droplets are pushed into cracks in the segments, pistons, and cylinder walls. Unburned fuels in these areas are expelled through the exhaust without being reached by the combustion flame, leading to increased HC emissions (Favre et al., 2016; Pulkrabek, 2004). Figure 16 illustrates the effect of CeO2 nanoparticles on HC emissions. The lowest HC emission, a 30.12% reduction compared to D0 fuel at 2800 rpm, was measured as 58 ppm with DCe100 fuel. In Figure 17 (a), the contour plot shows that an increase in engine speed and CeO2 nanoparticle concentration positively affects HC emissions. Adding nanoparticles to the fuel increases its oxygen content, enhancing combustion quality. Improved combustion quality reduces HC emissions (Singh et al., 2018).
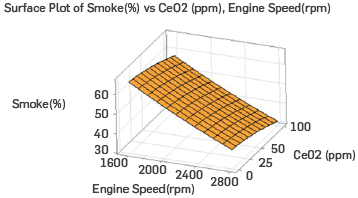
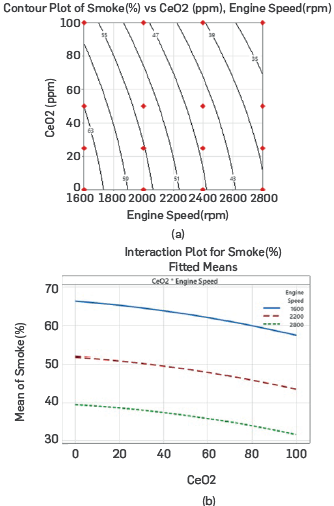
The primary molecules in smoke emissions are solid carbon molecules. Smoke emissions occur when molecules cannot reach oxygen. Generally, they occur in rich fuel regions during combustion (Seela et al., 2019). Figure 18 illustrates the effect of adding CeO2 nanoparticles to diesel fuel on smoke emissions. As can be observed in Figure 19 (a), there is a significant decrease in soot emissions towards the upper right corner of the graph, where engine speed and CeO2 concentration increase. Figure 19 (b) supports the idea that an increase in engine speed considerably affects smoke emissions. It can be concluded that an increase in engine speed and CeO2 concentration has a positive effect on emissions. The additional oxygen provided by CeO2 nanoparticles has a beneficial effect. Additionally, the reduction in density and viscosity translates into better mixing of air and fuel, decreasing smoke emissions (Babu et al„ 2015; Çelik & Bayindirli, 2020).
The response surface methodology (RSM) was used with engine speed and Ce02 nanoparticle concentration as input parameters: nvolving 16 experiments. Table 10 Lists the output parameters: which include engine torque, engine power, BSFC, and brake thermal efficiency as performance metrics. Table 11 shows the output parameters for N0X, CO, HC, and smoke emissions. Optimization was performed based on these experimental results.
4. OPTIMIZATION
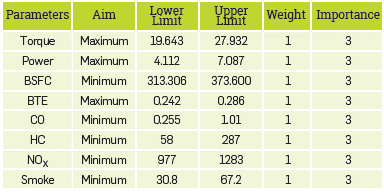
Optimization of the study was performed relying on the criteria shown in Table 12. For optimization purposes, the output performance parameters of engine torque, engine power, and brake thermal efficiency were maximized, while BSFC was minimized. Emission parameters were minimized. The input parameters were constrained within the minimum 0 ppm Ce02 range to maximum 100 ppm Ce02 and minimum 1600 rpm to maximum 2800 rpm
The generated model identified the optimum levels of input variables as CeO2 concentration at 100 ppm and engine speed at 2200 rpm. In Figure 20, the optimization results for performance output parameters are as follows: engine torque of 26.550 Nm engine power of 6.369 kW, BSFC of 320.461 g/kWh, and brake thermal efficiency of 27.90%. As for emissions, CO, HC, N0X, and smoke were recorded as 48.40%, 88.638 ppm, 1218.894 ppm, and 43.45%, respectively.
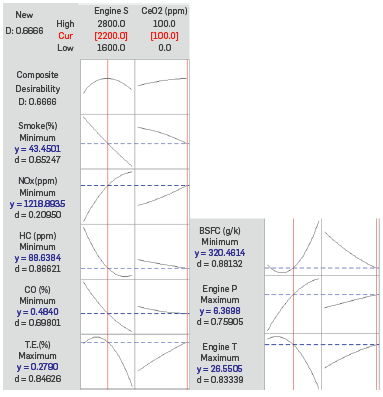
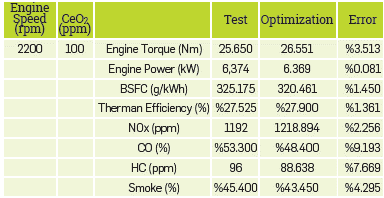
Table 13 compares the experimental results with the optimization results. Except for CO and HC emissions, all other outcomes are below 5%. This indicates the success of the response surface methodology in these parameters (Safieddin et al., 2020)
CONCLUSIONS
The practical application of computer-based learning methods helps to save time and avoid equipment, materials, and labour costs required for actual experiments. It also includes optimization methods for further simulation and prediction of control effects. This paper highlights the use of RSM, a more economical, fast, and effective method to optimize performance and emissions of ICEs, RSM has emerged as a valuable optimization technique for predicting engine performance and emissions. RSM requires the lowest time to complete the process by reducing the number of tests and creating appropriate matrices for testing. The practical application of computer-based learning methods, particularly RSM, plays a vital role in the engine industry by increasing innovative approaches and efficiency. These methods support efforts to improve engine performance and emissions, making it possible to work efficiently in terms of time and cost. The study required a comprehensive nvestigation in which factors such as fuel properties, fuel spray, combustion process, and pollutant formation were analysed to optimize the performance and emissions of internal combustion engines.
In this optimization study, the effects of adding different amounts of nanoparticles (25,50,100 ppm) to diesel fuel in a single-cylinder compression ignition engine were experimentally investigated at full load and four different engine speeds (1600, 2000, 2400, 2800 rpm), focusing on their impacts on performance and emission responses. Experimental data were used with the response surface methodology to prepare models and graphs. Optimization and predictions were performed within the established model's boundaries. The overarching research findings resulting from this study are summarized as follows:
 Experiments have demonstrated the positive effects of CeO2 nanoparticle material. It has positively influenced engine torque, power, BSFC, and brake thermal efficiency. However, a negative impact has been observed on NOx emissions, whereas favourable effects have been achieved on other emissions, including CO, HC, and particulate matter emissions.
 The experimental conditions were optimized using the DOE methodology with a CCD to minimize the number of simulations needed and determine their respective levels for constructing a RSM model.
Since the R2 values generated by the response surface methodology are above 90%, it can be inferred that the created model provides statistically significant results (Hussain et al., 2022).
Except for CO emissions, which deviate slightly, all other parameters are below 5% according to optimization and prediction. The model exhibits high reliability, alignment with experimental outcomes, and a promising predictive potential.
The optimization results of the response surface methodology yielded favourable outcomes with a desirability coefficient of 0.6666, achieved at a CeO2 nanoparticle concentration of 100 ppm and an engine speed of 2200 rpm.
The optimum responses were as follows: engine torque of 26.551 Nm, engine power of 6.369 kW, BSFC of 320.461 g/kWh, and brake thermal efficiency of 27.900%. Regarding emissions, the obtained values were as follows: CO at 48.40%, HC at 88.638 ppm, NOx at 1218.894 ppm, and particulate matter (PM) at 43.45%.
The response surface methodology has demonstrated its potential to approach the optimum outcome with fewer experiments. However, conducting a more extensive set of experiments could lead to improved data and analysis (Ghanbari et al., 2021; Uslu, 2020).
To conclude, the commercial application of the RSM method can provide great potential for predicting engine performance and emissions. This method offers a significant advantage by minimizing the number of tests with different fuel blends and reducing experiment costs and time. The accuracy and reliability of RSM's prediction capabilities can be further improved by utilizing an extensive data set for different engine types, fuel types, and operating conditions. This is important in extending the validity and usability of RSM for various fuel types, especially for the use of alternative fuels and fuel additives. Advanced computer-based modelling techniques can further enhance the predictive capabilities of RSM and model complex engine systems more effectively.
Our results highlight the need for more effective optimization in the future by performing more simulations and estimating control effects. This shows the importance of developments in the engine industry and minimizing environmental impacts. This study's findings are an important step toward making internal combustion engines more efficient, environmentally friendly, and economical. Future studies will further enhance knowledge and technology in this field.

