


 text in
  English (pdf)
 Article in xml format
 Article references
 Send this article by e-mail
 Cited by SciELO
  Cited by Google
  Similars in
SciELO
Similars in
SciELO  Similars in Google
 Permalink
INTRODUCTION
The winged oyster Pteria colymbus is a bivalve mollusk characterized by a "winged" shell, formed by an extension of the hinge out of the shell. Shell size of the adult individuals can reach 60-80 mm. normally they are attached to octocorals in the subtidal zone from North Carolina to southern Brazil, at water depths between 3 and 10 m (Díaz and Puyana, 1994; Lodeiros et al., 1999a). Winged oysters have a nearly continuous reproductive cycle in tropical waters (Urban, 2001). Studies related to ecophysiology and culture of P. colymbus conducted in the Parque Nacional Natural Tayrona, Colombian Caribe (Urban, 2001; Urban and Riascos, 2001; Velasco and Barros, 2010) and in the Gulf of Cariaco, Venezuela (Lodeiros et al., 1999b; Marques et al., 2000; Mengual et al., 2011; Freites et al., 2017) indicated this species has great aquaculture potential.
Bivalves, as poikilothermic organisms, are susceptible to fluctuations in environmental variables (Yukihira et al., 2000, 2006; Saxby, 2002). Relationships between temperature and food availability (phytoplankton origin and/or organic seston) with growth rate have been observed in bivalve species of temperate waters (Thompson and MacDonald, 1991; Pilditch and Grant, 1999; Freites et al., 2017). In general, a decrease in growth is associated with increasing depth due to environmental conditions becoming less favourable (Tomaru et al., 2002). However, using the culture depth as a strategy to generate environmental variability, low growth has been observed near the surface (MacDonald and Bourne, 1989; Román et al., 1999) while reduced growth has been reported below a critical depth where conditions of temperature, food availability and turbidity often exhibit a suboptimal vertical gradient (Frechette and Daigle, 2002).
Significant differences in the thickness of pearls in relation to culture depth have been demonstrated in the winged oyster Pteria penguin (Kanjanachatree et al., 2003), and that these differences were related to the increase in the availability of phytoplanktonic food at shallower depths. Therefore, understanding how environmental variables related to culture depth affect bivalve growth is critical to establish cultivation strategies in tropical areas, particularly in those with high environmental variability.
The Gulf of Cariaco, in northeastern Venezuela, displays marked variations in temperature and biomass phytoplankton throughout the water column due to the regime of trade winds that provoke periods of upwelling (Muller-Karger et al., 1994, 2013). This environmental variability has led to studies at different water depths with scallops of potential culture importance such as Nodipecten nodosus and Euvola ziczac that showed significant effects of depth on growth and reproduction (Freites et al., 1996; Lodeiros et al., 1998; Lodeiros and Himmelman, 2000). Here, the typical environmental variability in the column water in the Gulf of Cariaco would presumably also generate changes in the growth of other species, such as the winged oyster P. colymbus. The present study examines the influences of the culture depth and related environmental variables on growth of the winged oyster P. colymbus in suspended culture in the Gulf of Cariaco, Venezuela.
MATERIALS AND METHODS
Study area
The study was conducted from April 2013 to January 2014 at Turpialito site, Gulf of Cariaco (Figure 1), northeastern Venezuela (10° 27' 30" N, 64° 01' 52" W). Wild P. colymbus juveniles were harvested by hand from natural populations settled in nets of floating cages used for fish culture in the Charagato Bay, Cubagua Island, Nueva Esparta State, Venezuela (10° 49' 49,17" N; 64° 09'40,42" O). The pearl oysters were transferred to a research station in Turpialito in insulated containers packed with moistened foam layers to maintain a cool environment and limit stress.
Growth conditions
Juveniles oysters (29.03 ± 5.48 mm shell height (dorso-ventral axis) and 0.15 ± 0.05 g total tissues dry mass) were placed in cylindrical baskets made of 2 cm mesh size plastic net and 25 cm in height and 15 cm in diameter, with a total surface of 1531 cm2. They were suspended from a long line located at ~100 m offshore and 20 m depth, while baskets were deployed at 2 m depth for one week for acclimatization prior to the trials. The experiment began by placing 30 experimental baskets plus 5 substitution baskets by each at 2, 6 and 10 m culture depth (Figure 2).
Substitution baskets were placed to maintain the initial density throughout experimental period. Shell height did not significantly vary among the oysters at the three depths at the start of the experiment (Kruskal-Wallis; P = 0.935). Monthly, three baskets were collected from each culture depth to determine the number of living and dead individuals. In the rest of the experimental baskets, the dead oysters were counted and replaced by live specimens to maintain the initial population density and the baskets were cleaned to eliminate the biofouling. Shell axis height was determined with a digital caliper (± 0.01 mm). The fouling on the oyster shells was carefully extracted and weighed after drying. Soft tissues were removed from each oyster using dissecting equipment and separated to determine the dry mass of tissues and shell. These components were dried in an oven (60 °C, 48 h) to obtain dry mass values using an analytical balance (± 0.001 g).
The number of live oysters was recorded in each basket and total survival rate (%) was calculated at each sampling time as follows:
Survival rate = (Nt/No) x 100
Where,
Nt is the number of live oysters at time t.
No is the number of live oysters at the beginning of the experiment.
Environmental variables
Water temperature was monitored continuously at each water depth using electronic thermographs (Sealog-Vemco) with a periodicity of 30 min. Water samples were taken fortnightly using a Niskin bottle. One aliquot of each sample was carefully taken to avoid air bubbles for the determination of dissolved oxygen using the Winkler method within 6 h of sampling (detection limit 0.07 mg L-1). Water samples were transported to the onshore laboratory in an opaque plastic container for salinity determination with a refractometer Atago (one PSU precision). Salinity was determined with an Atago refractometer. Samples for phytoplankton biomass, determined as chlorophyll-a (Chl-a), and total seston were transferred on board to an opaque plastic bottle. All samples were transported to the laboratory in isothermal containers. Thereafter, two 1 L replicates were pre-filtered (153 𝜇m) to remove large particulate matter and zooplankton and then used to determine Chl-a and total particulate matter for each water depth. Seawater samples were filtered on pre-combusted and weighed GF/F 0.7 Lim filters (450 °C for 4 h) and rinsed with isotonic ammonium formate (0.5 M). Total dry mass was established after drying the filters to constant mass obtained at 60 °C (48 h). Particulate organic matter (POM) corresponded to the weight loss after ignition at 450 °C for 4 h in a muffle furnace. The phytoplankton abundance was estimated by determining the concentration of Chl-a by the spectrophotometric method following Strickland and Parsons (1972).
Statistical analysis
Overall statistical analysis on shell height and mass, tissues and biofouling mass, and survival of oysters were analyzed using the non-parametric Kruskal-Wallis test (KW), expressed graphically in box and whisker plots. The box-and-whisker plot shows the median, range, distribution of the data as well as serving as a graphical, nonparametric ANOVA. Biometric data of winged oysters and biofouling were transformed into Log10 and survival percentage was transformed to arccosine (Sokal and Rohlf, 1979). A probability of 0.05 was used for statistical analyses.
To establish the relationship between the environmental variables at each cultivated depth studied, a Principal Component Analysis was performed based on the correlation matrix. The variables considered were temperature, STDM, Chl-a and particulate organic matter, which occurred during the entire experimental period (Chatfield and Collins, 1980; Clarke and Warwick, 2001) In this regard, it is necessary to mention that dissolved oxygen was not considered because it did not show a previous correlation with any of the variables used in the analysis.
RESULTS
Shell size
The growth rate in the height shell axis of the oyster showed a progressive increment at three culture depths (Figure 3a), being more evident from April to the end of July 2013. Thereafter, the growth rates were slower but sustained, showing a lower slope until January 2014, when they attained shell heights of 69.76 ± 0.46, 68.19 ± 1.71 and 65.38 ± 1.58 mm at 2, 6 and 10 m, respectively, showing a narrow but inversely proportional relationship between growth and culture depth. However, at the end of the cultivation period, no significant differences (KW, P > 0.05) of the individuals grown in the three culture depths were observed (Figure 3b).
Figure 3 Variation of: a) height shell, c) soft tissues dry mass and e) shell mass of P. colymbus cultivated at the different depths studied and its respective Kruskal Wallis test figures b), d), f). Symbols and error bars represent mean monthly values plus the standard deviation, respectively. In box and whisker plots, the center horizontal line of the box is the median of the data, the top and bottom of the box are the 25 % and 75 % percentiles (quartiles), and the ends of the whiskers are the 5 and 95 % percentiles. The notch in the box is the 95 % confidence interval of the median. When notches between boxes do not overlap, the medians are considered significantly different (Briceño and Boyer, 2010).
Soft tissue mass
In May, June and July there was a marked increase in oyster mass grown at the three depths, but with lesser magnitude in the oysters grown a 10 m (Figure 3c). These trends were then reversed, with a marked fall during August by the oysters grown at 2, 6 and 10 m. Thereafter, there was an almost sustained recovery of the soft tissue mass. At the end of the experiment, individuals had a dry mass of soft tissues at 2 m (1.67± 0.14 g), 6 m (1.78 ± 0.15 g) and 10 m (1.55 ± 0.10 g), being the dry mass of the individuals grown at 10 m significantly lower (KW, P < 0.05), than those grown at 2 and 6 m (Figure 3d).
Shell mass
Similar to the described pattern of growth in shell height of oysters, the mass of the shell showed sustained growth throughout the study period (Figure 3e). At the end of the study, individuals had a maximum dry mass cultivated at 2, 6 and 10 m of 8.29 ± 0.60, 8.44 ± 0.40, 7.48 ± 0.67 g, respectively. Over the experimental period, significant differences (KW, P < 0.05) were only observed between individuals grown at 2 m with respect to those cultivated at 10 m (Figure 3f).
Biofouling mass
Dry mass of the biofouling settled on the individuals grown at the 3 depths showed a similar and moderate increase until July (Figure 4a), and then a greater and sustained increase until December and decline in January. At the conclusion of the experimental period, biofouling accumulation on individuals was not significantly (KW, P > 0.05) between the three depths (Figure 4b). This was attributed in part to the high biofouling mass variation from replicates at each culture depth.
Survival
Survival was 100 % in individuals grown at depths of 2 and 6 m until November, and above 80 and 93.3 % respectively, at the end of the experimental period (Figure 5a). In contrast, individuals grown at 10 m had a fall in the survival from October until the end of the study period, with a final percentage of slightly above 40 %. In consequence, at the end of the experimental period was observed a significantly higher survival (KW, P < 0.05) of individuals grown at 6 m than 10 m (Figure 5b).
Environmental variables
Dissolved oxygen concentration at the three experimental depths varied between 6 to 9 mg L-1 throughout the study period (Figure 6a). Two periods of sharp decline were observed, particularly at 10 m (April-May/2013, August-September/2013) with lowest values of ≈ 6.5 mg L-1, and two periods with increases at three depths (July-August/2013, December/2013-January/2014), where dissolved oxygen reached highest values (≈ 8.5 mg L-1). Dissolved oxygen showed significant differences (P < 0.05) between three depths (Figure 6b), with higher concentrations at lower depths.
Figure 6 Variation of environmental variables: a) dissolved oxygen; c) temperature; e) POM and g) Chl-a, at the different depths studied and its respective Kruskal Wallis test figures b), d), f), h). Symbols and error bars represent mean monthly values plus the standard deviation, respectively.
Temperature showed a clear increasing trend from April 2013 until September 2013 where maximum values exceeded 28 °C at the three depths (Figure 6c). Thereafter, a marked and sustained decline was observed until the end of the study, with values around 23 °C in the three culture depths. No significant differences (P > 0.05) were observed between the depth and temperature over the study period (Figure 6e).
In general, the trends in particulate organic matter (POM) at each depth showed similar trends as those described for the dissolved oxygen, reaching minimum values in July 2013 (Figure 6e), especially at 10 m (1.17 mg L-1), and a general increase until September 2013 to around 2.2 mg L-1. Finally, in January 2014, organic matter reached maximum values, especially at depths of 2 and 6 m (3.67 and 2.78 mg L-1, respectively). No significant differences (P > 0.05) were observed between organic matter concentrations at the three culture depths (Figure 6f). Chl-a was elevated for each water depth from April-July 2013 with values between 4.8 and 3.2 L-1 (Figure 6g), with the highest concentrations at 2 m, beginning in August and continuing through November, where Chl-a concentrations declined sharply between 0.2 to 1.2 𝜇g. Thereafter, Chl-a peaked from December 2013 until January 2014, with concentrations between 5.4 and 4.3 𝜇g L-1, respectively, and the highest values at 2 m. Over the study, Chl-a showed significant differences between depths (KW, P < 0.05), with an inverse relation with water depth, influenced by the higher concentrations observed between September and December at 10 m (Figure 6h).
Influence of environmental variables on the tissues mass
The PCA analysis resulted in equations that show a relationship between the different variables studied (STDM, Chl-a, POM and temperature), as follows:
a) 2 m = 0.375*STDM + 0.670*
Chl-a - 0.329*Temperature + 0.550*POM
b) 6 m = 0.052*STDM + 0.700*
Chl-a - 0.709*Temperature + 0.076*POM
c) 10 m = 0.477*STDM + 0.594*
Chl-a - 0.619*Temperature + 0.191*POM
The general equation that takes into account all variability in the three culture depth is:
d) 2-10 m = 0.253*STDM + 0.662*
Chl-a - 0.634*Temperature + 0.309*POM
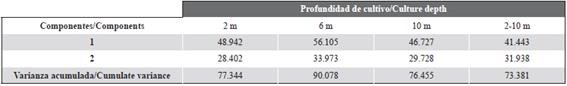
PCA between the different variables studied showed that the first two components explained a 77 % (2 m), 90 % (6 m), 76 % (10 m) and 73 % (2-10 m) of the variance observed, indicating that these are acceptable graphical representations (Table 1). In all equations, the variables that contribute to variance at 2, 6 and 10 m were Chl-a, STDM and POM with a positive correlation, all being inversely related to the temperature. Moreover, the relationship described previously for each culture depth was similar to the obtained at the 2-10 m water column interval (d).
DISCUSSION
The availability and quality of food can be considered an important factor that affects the physiological processes linked to growth (Bayne and Newel, l983). Suspended food particles for bivalves vary in quality and quantity and, in general, are composed of seston which itself is a complex mixture of pelagic organisms (principally phytoplankton) and suspended detritus, frequently positively associated with temperature (Navarro and Thompson, 1995; Cranford and Hill, 1999; Hawkins et al., 2001). In the study phytoplankton biomass (Chl-a) showed the highest values in the period April-May 2013 and January 2014 when the temperature was lower (1.85-2.78 𝜇g L-1), while low concentrations were observed during the highest temperature in September (0.79 𝜇g L-1). According to Lodeiros and Himmelman (2000), the inverse relationship between temperature and phytoplankton abundance in most studies agrees with the observed periods of coastal upwelling and water stratification established in the Gulf of Cariaco. Chl-a values reported by Mengual et al. (2011) in the nearby of Mochima Bay generally showed an inverse pattern to temperature as well, that is, Chl-a was below 1 mg L-1 when maximum temperature was recorded. However, the trends of POM showed no definite pattern, with values generally above 1.5 mg L-1. These values are similar to those reported by Prieto et al. (2001) and Villarroel et al. (2004) in the Gulf of Cariaco. Higher concentrations of POM observed in the last three months of study (2-3.7 mg L-1) coincided with an increase in soft tissue mass. Therefore, Cranford and Grant (1990) reported that, although phytoplankton is an important food source for bivalves, organic detritus can contribute to energy uptake in periods when phytoplankton concentrations are too scarce to satisfy energy demands. Similar results have highlighted the importance of POM concentration in comparative trials to test for differences between culture locations of some bivalve species, such as: Corbicula japonica (Kasay and Nakata, 2005), Chlamys islandica (Blicher et al., 2010), Crassostrea gigas (Beninger et al., 2008), Perna canaliculus (Gardner and Thompson, 2001), Chlamys farreri (Zhang et al., 2010), Nodipecten nodosus (Freites et al., 2003) and Moerella rutile (Kang et al., 2006).
In this study, the different equations (A, B, C) obtained from the PCA showed that the variables that participated in the variance observed were POM, Chl-a, temperature and STDM of the oysters. These results agree with other studies carried out in the Gulf of Cariaco, where it was demonstrated that the influence of the environmental variables associated with the culture depth can influence the growth of some species of marine bivalves (Lodeiros et al., 1998; Acosta et al., 2009; García et al., 2016).
The shell lengths attained in ten months by the winged oyster grown at three depths were 69.76 mm (2 m), 67.19 mm (6 m) and 65.38 mm (10 m), while their relative average increase reached 118, 112 and 104 %, respectively (initial height ≈ 32 mm). This growth differs markedly from the results obtained by Gaytan-Mondragon et al. (1993) who found an increase of ≈ 144 % in the dorsal-ventral height of P. sterna in 10 months. A similar size increment was obtained for P. colymbus (Lodeiros et al., 1999b) in 8 months (≈ 94%).
Our results imply feasibility of cultivation of winged oyster at the Turpialito site, where Lodeiros et al. (2002) also reported increases of 100 % in the shell growth of the pearl oyster Pinctada imbricata. The values found for the length axis in this study were higher than those showed by Mengual et al. (2011), who cultivated P. colymbus in Mochima Bay and showed a smaller growth increase of length axis of 68 %, with a similar size and initial culture period. Six months into the experimental period, individuals obtained a shell height increment of 58, 54 and 52 % at depths of 2, 6 and 10 m, respectively. These values are higher than the increment (41 %) observed over the same culture time in the winged oyster Pteria hirundo (initial size of 39.40 mm) cultured in Brazil at 1-2 m depth (Albuquerque et al., 2012).
Dead individuals were only observed in the last sampling, which may be related to the presence of two gastropods species of the Rannellidae family (Linatella caudata and Monoplex pilearis). These snails are also responsible for the mortality of commercially important pearl oysters Pinctada martensis (Zhou and Pan, 1999), P. margaritifera (Aji, 2011) and P. imbricata (Malavé et al., 2012).
Decreases in soft tissue mass in the August-September period for the oysters grown at the three depths could be related to spawning, as shown by Marquez et al. (2000) who observed a peak in the spat recruitment of P. colymbus at the same site and annual period of the present study. However, from October until the end of the culture period, the tissue mass increased in individuals grown at the three culture depths, which is consistent with a previous gonadal mass prior to the main spawning peak shown by Marquez et al. (2000) in December.
At the end of the experimental period, our results showed a higher growth of the soft tissue biomass of individuals grown in shallower waters (2 and 6 m) than in deep waters (10 m). This agrees with the results by Smitasiri et al. (1994) and Kanjanachatree et al. (2003) who reported a higher growth of Pteria penguin individuals cultivated in shallow waters (2-5 m depth) than in deep ones (15 m depth). These authors attributed this difference to higher food availability at the shallow depth. Furthermore, Sims (1994) and Lee et al. (2008) also observed higher growth of Pinctada margaritifera and P. maxima juveniles, respectively, when cultivated in shallow waters. Taking into account the results obtained in the performance (growth/survival) of the individuals of the winged oyster P. colymbus, we recommend carrying out their culture between 2 and 6 m water depth.

