


 text in
  English (pdf)
 Article in xml format
 Article references
 Send this article by e-mail
 Cited by SciELO
  Cited by Google
  Similars in
SciELO
Similars in
SciELO  Similars in Google
 Permalink
INTRODUCTION
Marine aquaculture has grown steadily and can meet an important part of the increasing demand for fishes. In particular, marine species in controlled environments have been an effective alternative to purely extractive fishing. Every year an increasing number of species with potential use in the aquaculture industry are studied, and Rachycentron canadum (Linnaeus, 1766), commonly known as cobia, is one of them (Franks et al., 1999; Liao et al., 2004; Sun et al., 2006; Holt et al., 2007; Mosqueira et al., 2011).
This species has gained importance due to its economically feasible production due to characteristics such as tolerance to a wide range of temperature (between 16.8 - 32.2 °C) and salinity (between 5.0 - 44.5 ups), good adaptation to confined spaces (e.g., floating cage culture), high growth rates (average weight of 6 kg in the first year of culture), excellent food conversion rate, meat of good nutritional quality and good acceptance by consumers due to its appearance and organoleptic characteristics, and reproduction relatively easy at two years of age (Flores, 2017; Carmona et al., 2019).
Compared to closed water bodies, floating cage culture is friendly to the environment since the open sea can assimilate high pollutant loads and have high availability of good quality and well-oxygenated water. Likewise, once the infrastructure is implemented, in many cases, it allows for a reduction in the costs of food and its transport, which is why different cultivation experiences have been carried out in Caribbean countries such as Colombia and Cuba (Flores, 2017; Carmona et al., 2019).
In cage cultures, where the animals are very close together, the implementation of monosex cultures is widely used in the aquaculture industry (Franks et al., 1999; Franks and Brown-Peterson, 2002; Dutney et al., 2017). Budd et al. (2015) summarize some of the advantages of this type of cultures, they allow: the use of differential growth rates and/or economic value between sexes to maximize profits; reduce variation in fish size at harvest time; achieve a higher average growth rate by reducing sexual/territorial behavior; to reduce the impact on the product quality, for example, as the females reach sexual maturity they divert energy (e.g., lipids); increase the stability of mating systems; and to reduce the risk of environmental impact resulting from the escape of exotic species. Special mention needs the reduction of precocious maturation, which leads to slow growth as energy is diverted into reproduction, creates a large variance in product size at harvest, and results in overpopulation of cages and, therefore, an inability to control animal densities and feeding rates (Budd et al., 2015).
Sexual development in fishes is a complex process result of the interaction between genes involved in sexual development (genetic and epigenetic characteristics) and the mechanisms by which environmental modifiers can induce phenotypic changes. It often depends on species-specific processes and the culture system. Therefore, technological innovations that successfully control sex in one species are certainly not guaranteed to work in another. As a result, the first approach is manual or automatic sex detection and selective removal of individuals. The second step is the successive research on various technological approaches to produce monosex populations for culture (e.g., exogenous hormone treatment, chromosome ploidy manipulation, molecular tools, or hybridization) (Budd et al., 2015).
None evident sexual dimorphism has been discovered in the cobia culture, and early sexual maturation in floating cages is a problem as it reduces the feed conversion rate and generates an additional cost (Fontaine et al., 1997; Leclercq et al., 2010; Cerviño, 2014). In this species, and in others that are yet to reach industrial-scale production, elucidation of sex differentiation remains a key area of applied research (Budd et al., 2015).
Morphometry is the description, analysis, and quantitative interpretation of the shape and its variation between samples (Adams et al., 2004; Zelditch et al., 2004), whose results can be interpreted in terms of geometry, morphology, sexual dimorphism, environment, genetic differences, and/or microevolution, among others (Hammer, 2002; van de Wouw et al., 2003).
Traditional morphometric is the study of shape based on lengths and angles on individual specimens, whereas geometric morphometric is based on anatomical landmarks. An anatomical landmark is a reference point that can be recognized in all the specimens to be compared. They are located in a way that is easy to recognize (e.g., on the juxtaposition of tissues, demarcating conspicuous internal structures, or maximums of curvature), and describe the shape of the structure to be compared, avoiding the overinfluence of any of them (Bookstein, 1991). Morphological landmarks are placed on digitalized images of specimens and transformed into coordinates in a two-dimensional plane using mathematical algorithms. Hence, any variation related to the position, orientation, and scale of the image, is eliminated by computer software. Differences can be found with regards to the shape of the organisms or between averages of different groups (Kendall, 1989; Rohlf, 1990; Marcus et al., 1993; Adams et al., 2004; Zelditch et al., 2004; Calle et al., 2008). This research aimed to determine the sexual dimorphism of R. canadum using traditional and geometric morphometry.
MATERIALS AND METHODS
The biological material was growing at the Colombian Center of Investigation for Aquaculture (CENIACUA), located in the Bolivar department, Colombia (10°34’16.7”N 75°30’40.6”W). In total, 57 healthy fish randomly selected from the culture were used. They were sacrificed by asphyxia, removing the oxygen supply from the tank in which they were being kept, and then were preserved in a refrigerator at -20º C. The average fork length was 45.78 cm (Min = 28.4 cm; Max = 71.9 cm.), with a minimum age of four months and a maximum of twelve months. Four samples were excluded due to shape compromised by external factors.
Traditional morphometric
The morphometric variables used were based on Gandhi et al. (2013) and escalated by dividing each variable by the standard length of each fish. The variables measured were (Figure 1): fork length (Fl), standard length (Sl), length of ventral (VF) and pectoral (PF) fins, eye diameter (Ed), separation of nostrils (nn), distance between the cleft of the upper lip (uL) and insertion of the caudal fin (CF), distance between uL and the mouth anterior end (Ma), separation between uL and the inferior insertion of the pectoral fin (iPF), distance between uL and superior insertion of the pectoral fin (sPF), distance between iPF and sPF (isPF), distance between the nostril (n) and uL, length from VF to Ma, distance between posterior insertions of the ventral fin (ppVF), distance between the insertions (posterior and anterior) of one VF (paVF), distance between the head dorsal insertion (Hd) and anterior insertion of the dorsal fin (aDF), and distance between the eye (E) and sPF. In the operculum, three anatomical semi-landmarks were selected, Op 1 , Op 2 and Op 4 . Based on these, the distances between Op 4 and uL, Op 4 and sPF, Op 4 and Hd, Op 2 and uL, Op 1 and uL, Op 1 and sPF and Op 1 and iPF were analyzed.
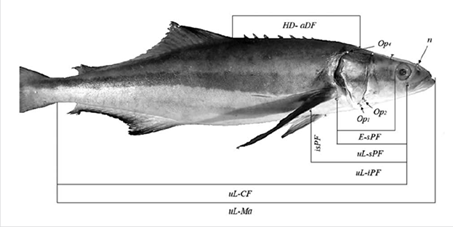
Figure 1 Seven of the 24 measurements and four points taken from the specimens used in this study. In the figure the abbreviations are uL: cleft of the upper lip; Ma: mouth anterior end; CF: Caudal fin; iPF: inferior insertion of the pectoral fin; sPF: superior insertion of the pectoral fin; E: eye; PF: distance between iPF and sPF; Op1, 2, 4: cleft near to the operculum; n: nostrils, HD: head dorsal insertion, aDF: anterior insertion of dorsal fin.
Geometric morphometric
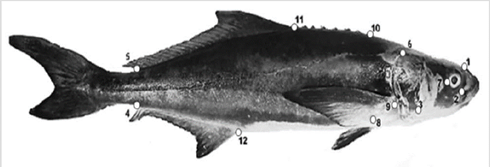
The anatomical landmarks were chosen following the criteria of Corti and Crosetti (1996) and Zelditch et al. (2004). In total, 12 landmarks were placed on: the nostrils (L 1 ), cleft of the upper lip (L 2 = uL), second cleft near to the operculum (L 3 = Op 2 ), posterior insertion of anal fin (L 4 ), posterior insertion of dorsal fin (L 5 ), fourth cleft near the operculum (L 6 = Op 4 ), insertion of the ventral fin (L 8 ), superior insertion of pectoral fin (L 9 = sPF), first spine of the dorsal region (L 10 ), and anterior insertion of dorsal and anal fins (L 11 , L 12 ). A pseudo-landmark was located on the intersection between the posterior margin of the eye and the cross-line between L 1 and L 3 (L 7 ) (Figure 2). These landmarks were digitalized and converted to coordinates on a two-dimensional plane using tpsDig software by Rohlf (available in https://life.bio.sunysb.edu/ee/rohlf/software.html).
For images, specimens were fixed using pins and positioned on the same side so that all fins were extended and the mouth was closed. Approximately ten pictures were taken per specimen, with only small changes in fin position and the head and abdomen’s inclination. All images of the same individual were compared, and those demonstrating identical positioning were chosen for inclusion.
A Generalized Procrustes Analysis (GPA) was used to process the coordinates matrix of the landmarks, superimposing all individuals’ configurations adjusted to the size of the centroid (square root of the sum of the distances, squared, from each landmark to the centroid). The GPA uses the minimal squares criteria to obtain the optimal superimposition, avoiding the variations not related to the form. The superimpositions were used to calculate the relative warps components used in the statistical analyzes. GPA also calculate a consensus (average) configuration that resume all landmarks configurations’, allowing to describe and compare the average form of the specimen and/or groups of them (Rohlf, 1990; Adams et al., 2004; Zelditch et al., 2004; Calle et al., 2008). This analysis was performed using Rohlf’s TpsRelw software (available on https://life.bio.sunysb.edu/ee/rohlf/software.html).
Sex determination
The specimens were sexed by direct observation of the gonads (Holden and Raitt, 1974). An L-shaped incision was cut between the anus and ventral and pectoral fin; the tissue was stretched up until the gonads were observed from the insertion of the dorsal fin and over the intestine. Fish with small gonads and tubular appearance were considered male, and those with larger, wide, and flat ones were considered females.
Statistical Analysis
In the case of traditional morphometry, for each sex, the data´s normal distribution was proved by Kolmogorov-Smirnov’s test (p < 0.05), the independence of variables by plotting each pair of variables to each other, and the homogeneity of variances were verified by Levene’s test (p > 0.05). A Student’s t-test for independent samples (p ≤ 0.05) was used to determine significant differences between sexes. Each biometric variable was deemed as independent, and sex as a dependent variable. A linear correlation was calculated, and discriminant analysis was made using the variables with significant differences and without cross-correlation. The discriminant analysis was cross-validated, and the discriminant linear functions, the squared distance between groups, and the percentage of proper classification were calculated.
In geometric morphometry, the GPA data were used to identify which anatomical landmarks give more information on Cobia’s form and make a second discriminant analysis using the relative warps as independent variables. The percentage of proper classification was calculated, and each coordinate of the landmarks was transformed into a single value multiplying them to each other. A correlation between the discriminant function and landmarks transformed was calculated, and the landmarks with the highest correlation with the function were analyzed. The sexual dimorphism was expressed as a linear equation of biometric variables and an image of the geometric ones’ vectors.
RESULTS
Traditional Morphometry
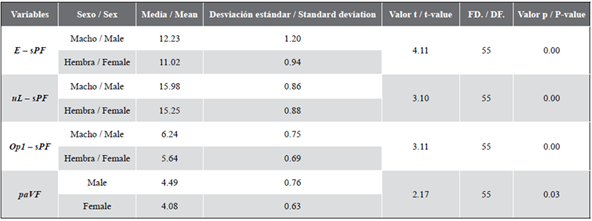
Based on direct observation of gonads, 56.14 % of individuals were identified as females and 43.86 % as males. After corroborating the independence of variables, normality, and homoscedasticity (p > 0.05), the Student’s t-test showed that E - sPF, paVF, uL - sPF, n - uL, sPF - Op 1 , and paVF were significantly different between sexes (p < 0.05; Table 1). These variables summarize information about the eyes, mouth, operculum, pectoral, and ventral fins, and did not correlate with each other (p < 0.05), being eligible for the discriminant analysis.
Table 1 Descriptive statistics and probabilities from Student’s t-test (n = 57). See Figure 1 for the full description of the variables.
The discriminant analysis cross-validated with biometric variables correctly grouped 75.4 %, it has a squared distance between groups of 2.18. As long as the value of the first discriminant function (I) is lower than the second one (II), the individual will be classified as male, and if it is greater than II, as a female.
Discriminant functions:
Geometric morphometry
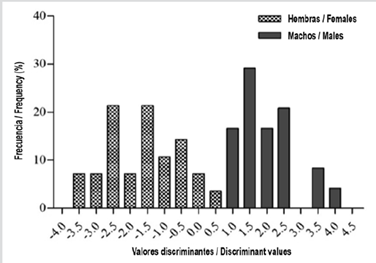
Generalized Procrustes analysis calculated 20 relative warps of shape-variation. The landmarks 7.2, and 9 contributed higher to relative warps: 29 % of the contribution for the landmark 7.22 % for landmark 2, and 15 % for landmark 9. The discriminant analysis cross-validated based on the principal axes of shape variation (relative warps) grouped 82.7 % of individuals correctly (Figure 3). The transformed variables (the product of each landmark’s two-dimensional coordinates) explained the 97.6 ± 0.01 % of its variation.
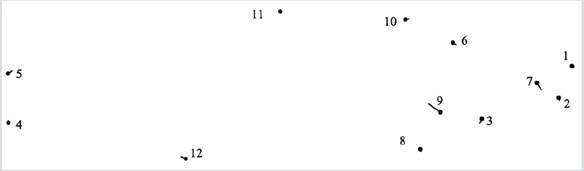
Figure 3 Variation vectors’ of females’ shape with respect to the consensus configuration of males. Lines represent the position of the landmarks in the consensus configuration of females.
Landmarks 9 and 7 had higher combined intragroup correlations with the discriminant function than the other landmarks. Aligning the males’ consensus with the females’ and analyzing the variation of shape, L 9 is the landmark with a higher difference between sexes (Figure 4). Females have an angle of 135.35 ± 7.01 ° and males 141.92 ± 8.60 ° between L9 and L7 with origin in L3. The difference between these angles is significant (p = 0.004), indicating that the eye and pectoral fin positions are important for sexual dimorphism in Cobia.
DISCUSSION
The studied morphological relations allowed to assign the sexes correctly in 75 % of the analyzed specimens. There are individuals in natural populations whose characteristics are very similar to the opposite sex, or there are little differences between sexes, causing the percentage of correct assignation in discriminant analyses rarely reach 100 %. This could be because of the phenotype of the individuals being dependent on their sex and environmental, genetic, and social factors (Márquez, 1995; Sanabria et al., 2011; Peckmann et al., 2015; U-Yong et al., 2015; Jónsdóttir et al., 2016).
In geometric morphometrics analyses, the 23 % not accounted for by sex could also result from an error in the position of the fish when taking the images. However, because the covariance - variance matrix is equal through the groups, the analysis does not lose validity. The percentages of correct assignation in the discriminant analysis based on distances (75.4 %) and geometric morphometrics (82.7 %), in addition to the lack of a disturbing effect of age used in this research (4 - 12 months), makes this technique useful in the aquaculture of cobia and other species (Bonino and Donadio, 2010; Peckmann et al., 2015; U-Yong et al., 2015; Jónsdóttir et al., 2016).
The landmarks located on the cobia can be used for sexing individuals based on recognizing algorithms in fish. Currently, a way to determine a certain fish like Sebastes constellatus, S. levis, S. miniatus, S. rubrivinctus, and Prognathodes falcifer is being developed the automatized analysis of photographic capture. However, it is not yet clear which algorithms are best, and there is no database with enough information to make it (Dujardin et al., 2010; Matai et al., 2012; Williams et al., 2012; NOAA, 2013; Dujardin et al., 2014). The amount of information necessary to differentiate species is larger than that needed to separate one species’ sexes. Therefore, developing this type of technique for sexing individuals is certainly achievable and should not be complicated.
The level of sex separation obtained in this study could increase the efficiency of monosex marine aquaculture of cobia in cages in the Colombian Caribbean, increasing their profitability.
CONCLUSION
The biometric variables that can be used as sexual dimorphism are E - sPF, VF, and Op 4 - Hd. Landmarks on the eye and pectoral fin are the most accurate sources to extract information about the sexes. Visually the difference between sexes can be seen as narrower heads and larger space and the narrower angle between the eyes and pectoral fin for females

