


 text in
  English (pdf)
 Article in xml format
 Article references
 Send this article by e-mail
 Cited by SciELO
  Cited by Google
  Similars in
SciELO
Similars in
SciELO  Similars in Google
 Permalink
INTRODUCTION
Sandy beaches comprise more than two thirds of the ice-free coasts of the world, providing a wide variety of ecosystem services that support human well-being at coastal areas (McLachlan and Defeo, 2018). Beaches are highly dynamic and primarily defined by the interaction between wave energy, tides and wind regimes (Barnard et al., 2015; McLachlan et al, 2018), which translates into strong variation patterns of ecosystem area (Short, 1999). High variability makes beach ecosystems particularly vulnerable to physical modifications, armoring structures and other urban-associated alterations, which jeopardize ecosystems area, reduce biodiversity and alter sediment budget cycles, accelerating erosion rates (Short, 1999; Defeo et al., 2009). Coastal ecosystems worldwide face a “triple whammy” given by increases in urban and industrial development, use of resources, and the effects of climate change (Defeo and Elliot, 2020). Natural and anthropogenic stressors imposed on sandy beaches have led to widespread erosion and degradation of these complex ecosystems with consequences for both social and ecological components (Amyot and Grant, 2014; Luijendijk et al., 2018).
The mitigation of beach ecosystem degradation is a complex task that requires morphological estimations to assess drivers and trends (Barnard et al., 2012). On-site coastal monitoring programs are expensive and often sparse (Splinter et al., 2013; Vos et al., 2019). This is especially problematic, as robust long-term data sets are required before meaningful trends emerge (Short and Jackson, 2013). Multi-decadal analysis of coastal vulnerability has shown oscillation patterns and correlations to global and regional climatic indices, in combination with predominant wave climate and sea level (Barnard et al., 2015; Orlando et al., 2019). This climate-driven dynamic supports the shared concern about the potentially critical effects of climate change at coastal areas, reinforcing the need for long-term coastal databases.
Satellite imagery provides useful data for studies of nearshore morphodynamics (Harris et al., 2011; Short and Jackson, 2013) and has been used for shoreline and coastal monitoring at global (Luijendijk et al., 2018; Vos et al., 2019) and local (Cifuentes et al., 2017) scales. The Landsat satellite collection has spatial, spectral, and radiometric resolution that, along with their temporal continuity, have proven well suited for beach erosion monitoring (Luijendijk et al., 2018, Orlando et al., 2019; Vos et al., 2019). The application of an automated shoreline detection method to the Landsat collection has produced a global dataset of shoreline change rates for a 33-year period, indicating that 24% of the world’s sandy beaches are eroding at rates exceeding 0.5 m/yr, while 28% are accreting (Luijendijk et al., 2018). Random forest classification, applied to Landsat images at the Montevideo coast, allowed to estimate beach area and establish long-term trends describing a 27-year cycle with well-delimited quasi-decadal erosion and accretion phases related to climatic configurations (Orlando et al., 2019).
This study presents an open access methodology to estimate beach area with the objective of strengthening coastal management capacities by providing a low cost remote sampling procedure. Unlike studies that measure the shoreline position (Harley et al., 2010; Luijendijk et al., 2018; Vos et al., 2019) this approach focuses on beach area determination, an informative variable that can help explain coastal dynamics (Short and Jackson, 2013; Orlando et al., 2019), ecosystem attributes (Takimoto and Post, 2013) and touristic potential (Mclachlan et al., 2013). Sand and vegetation cover are considered, sand detection is achieved through a Random Forest semi-automated classification, while vegetation area is estimated by applying a threshold to the normalized difference vegetation index (NDVI). As a case study, calibration of the estimation parameters is performed for the Montevideo coast by testing results against independent estimations of beach area based on aerial and satellite imagery (Gutiérrez et al., 2016). Then, using the best performing parameters, beach area is estimated for 20 beaches of the coast of Montevideo for the 1984-2019 period. To ensure replicability and encourage the use of this methodology all information produced as well as the scripts are shared through on-line repositories.
STUDY AREA
Uruguay is located in the southeastern coast of South America, with a total area of approximately 176,000 km2 (Fig. 1). Montevideo is the administrative department that holds the capital city and main port, its coast is characterized by sandy beaches interrupted by rocky heads, with a semidiurnal tidal regime of microtidal amplitude (ca. 0.5 m) (Lercari and Defeo, 2015). The Rio de la Plata system has a major freshwater input from Parana and Uruguay rivers, from the west, forming a shallow (up to 15 m) coastal-plain estuary (Lercari and Defeo, 2015). A strong turbidity front is located around Montevideo city, which constitutes the surface indication of the transition between fresh and saline waters (Sepúlveda et al., 2004). In this estuary, variability of water characteristics (salinity, temperature and turbidity) are mainly forced by winds (Simionato et al., 2010), strong winds also produce short-term increases in sea level. The frequency of storm surges greater than 200, 250 and 280 cm above mean sea level has increased and is attributed to changes on wind regimes (Verocai et al., 2015). Sandy beaches along this coast behave as intermediate to dissipative, with a dominance of fine sediment fraction (García-Alonso et al., 2016). The range of salinity variations and urbanization are the principal drivers explaining sandy beach species richness at this coast (Orlando et al., 2020). Numerous alterations related to hardening and urbanization are present at Montevideo, such as: coastal squeezing, modification of sediment and water flows by infrastructure and introduction of exotic species (Gutiérrez et al., 2015; Delfino et al., 2011).
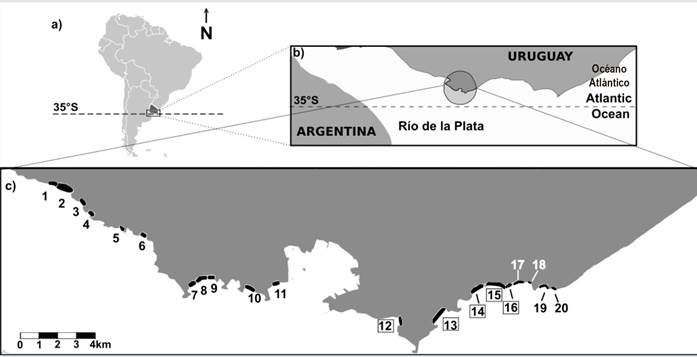
Figure 1 a) Location of study site on South America. b) Rio de la Plata, the circle indicates the location of Montevideo. c) The 20 beaches selected as study sites. From left (west) to right (east): 1) Punta Espinillos, 2) Mailhos, 3) Rocha, 4) La Colorada, 5) Juan Torora, 6) Pajas Blancas, 7) Punta Yeguas chica, 8) Punta Yeguas grande, 9) Santa Catalina, 10) Del Nacional, 11) Cerro, 12) Ramírez, 13) Pocitos, 14) Buceo, 15) Malvín, 16) Brava, 17) Honda, 18) Ingleses, 19) Verde, 20) La Mulata. Squares enclosing beach numbers indicate locations that were used for the calibration procedure.
MATERIALS AND METHODS
The area of the emerged fraction of beach ecosystems (Beach area) was estimated yearly from 1984 to 2019 for 20 beaches of the Montevideo coast (Fig.1c), beaches are referred by common name and were selected, not as an exhaustive list but, to cover the geographical range of this coast. The Landsat 5 and 7 satellite imagery collections were analyzed through Google Earth Engine (GEE) (Gorelick et al., 2017), this cloud-based platform for geospatial analysis uses a WGS84 projection and allows accessing an extensive data collection, including the Landsat project. The platform includes a JavaScript console where data can be analyzed remotely using Google´s computation infrastructure, thus reducing the hardware requirements for the analysis and avoiding the storage of images (Gorelick et al., 2017).
The Landsat satellite series has a temporal granularity of 16 days, Landsat 5 has been active from 1984 to2012, comprises 7 spectral bands with a maximum spatial resolution of 30m, covering different wavelengths from the blue range (0.45-0.52 µm) to the shortwave infrared (2.08-2.35 µm) (Ozturk and Sesli, 2015). The Landsat 7, comprises 8 spectral bands ranging to blue (0.45-0.52 µm) to shortwave infrared (2.08-2.35 µm) with a panchromatic band (0.52-0.90 µm) and a maximum spatial resolution of 15m (Gorelick et al., 2017).
The methodology proposed combines photo interpretation with machine learning algorithms which classify land cover. The detailed explanation of the methodology applied is referred to Figure 2. Each numbered paragraph refers to a box representing a stage of the process. When applies, below the numbered paragraphs there is information on the particular case for the Montevideo coast.
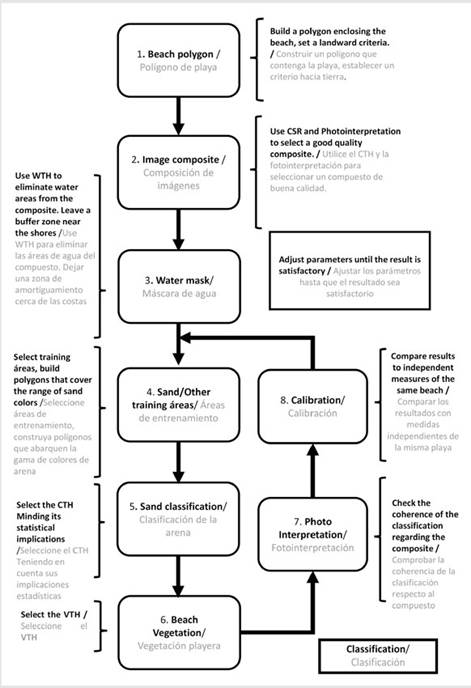
Figure 2 Workflow of the methodological approach applied to measure the area of sandy beaches. Each box represents a step with referenced additional information. CSR is the cloud score range, WTH is the water threshold, CTH is the classification threshold and VTH the vegetation threshold.
Beach polygon. A polygon enclosing each of the beaches was constructed based on Quickbird satellite images from Google Earth (dated 9 July 2009, 2.5 m spatial resolution), and used to obtain measures for each beach. The seaward limit of the polygon should be able to capture area variations and different beach profiles without having to be modified (Fig. 3). The landwards limit in urban beaches is set by hard structures and seldom changes. On beaches with no consolidated supralittoral, the limit was set where vegetation fully covered the sand. This polygon establishes the maximum landward limit of the beach, therefore has to be adjusted to the oldest reference in the database, and should be modified if alterations of the landward limit happen, such as those generated by constructions (Fig 3).
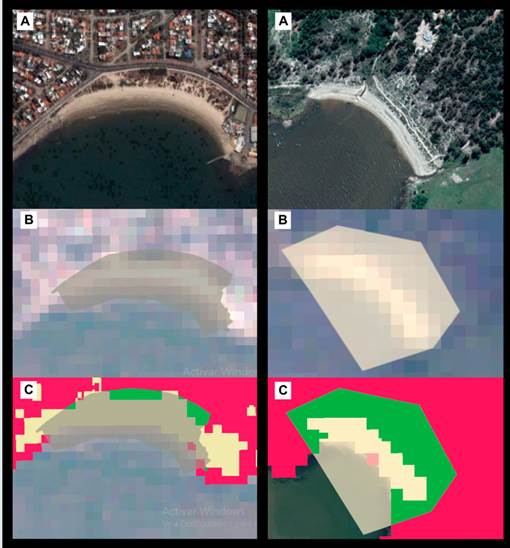
Figure 3 Diagram showing examples of the classification procedure for an urban beach (Verde) on the left and a beach with no with no consolidated supralittoral (Rocha). A) Shows the Google Earth high-resolution imagery (July 9 of 2009), which was used as reference to construct beach polygons. B) Shows two inputs for the classification procedure, a 30m resolution Landsat 7 composite of the year 2009 with the geo-located Beach-polygon superimposed. C) Shows the classification output with yellow pixels indicating sand, red indicating “other” and green, beach-vegetation. The total area of the beach is equal to the areas in yellow and green under the polygon.
2. Image composite. Landsat images were converted to top of the atmosphere (TOA) reflectance and a median based composite was constructed from non-cloudy pixels applying the Landsat Simple Composite built-in function of GEE using all available bands. This function computes a Landsat composite from a collection of raw Landsat scenes; it applies a standard TOA calibration and assigns a cloud percentage to all pixels on each image. Then, a median-based value per band is computed for every pixel with a range of clouds lower than the selected cloud score range (CSR), generating the composite. The CSR was used to control the percentage of clouds per pixel, adapting the value until a clear true color visualization based on red, green and blue, was obtained (Fig 3).
For the Montevideo coast, beach area was estimated yearly using all the available standard Level 1 Terrain-corrected orthorectified images from Landsat 5 (L5) (1984-2011) and Landsat 7 (L7) (2004-2019). L5 had an average of 15 images per year with a minimum of 6 (1985 and 1985) and a maximum of 31 (2004), while L7 had an average of 33 images per year with a minimum of 28 (2010) and a maximum of 41 (2019) (Table 1). For overlapping years (2004-2011), areas were measured through both Landsat collections and averaged.
Table 1 Characteristics of the image collections used for the construction of the Landsat 5 and 7 composites to estimate beach area on the Montevideo coast, the number of images (n) is informed and the minimum and maximum date are provided, as day/month, for each year.

For the Montevideo coast the 7(8) spectral bands of Landsat 5(7) were considered as classification variables, 100 training points were randomly extracted from the training areas of each category.
3. Water mask. In order to reduce the area of classification and limit the number of categories, the water layer was removed by applying a normalized diference water index (NDWI) (Gao, 1996) mask with different water thresholds (WTH), combined with photo interpretation. This step does not seek to set the coastline, so a buffer zone of water-sand interface must remain for the algorithm to classify the cover.
4. Sand/Other training areas. The spectral signal at training areas acts as seed information for the developing of the Random Forest classification algorithm. For the sand category, training polygons were distributed along the coast covering the range of sand colors present on each composite. The category “other” was formed by polygons that comprised all non-sand cover, including urban, rocky and rural cover. Random selection of sampling points within training areas was implemented to reduce spatial autocorrelation and classification errors (Millard and Richardson, 2015), considering that the number of training points should be at least 10 times the number of variables used in the classification (Jensen, 2005).
5. Sand classification. Random Forest procedure (Breiman, 2001) was applied due to its high classification accuracy (Brieuc et al., 2018). This algorithm builds several classification trees and then decides each pixel class by the majority vote of all trees (Breiman, 2001). To provide an adjustment for the sand classification, different threshold of the majority vote (CTH) were tested. All pixels within the beach polygons with a vote greater than the CTH were considered as sand. Following this procedure, 1000 decision trees were constructed for each year. For the Montevideo coast, sand area estimations were made with CTH of 0.35, 0.50 and 0.65 in order to try different decision thresholds.
6. Beach vegetation. To account for vegetation growing at the beach, all pixels within the beach polygons classified as “other” and with a normalized diference vegetation index (NDVI) greater than the vegetation threshold (VTH) were considered as beach vegetation. Beach area was estimated adding sand area and vegetation area within each beach polygon.
Estimations of beach vegetation area were taken with VTH of 0.15, 0.25, and 0.35 to test the behavior of different vegetation thresholds.
7. Photo interpretation. The coherence of the classification and the adequacy of the beach polygon were visually analyzed comparing the spatially explicit results to the original composite (Fig. 3).
8. Calibration. To approximate the best model parameters (CTH and VTH), estimated beach area was compared to independent measures, considering the possible sources of error due to the different approaches.
Gutiérrez (2010) and Gutiérrez et al. (2016) present area measurements for 5 of the 20 beaches covered in this study (Ramírez, Pocitos, Buceo, Malvín, Brava). This independent information was obtained through manual measuring of satellite and aerial imagery covering a larger time period than the analyzed here, including two different methodologies for beach measuring, the previous high tide high water level (PHTH) (Buceo, Malvín and Brava) and the wet/dry line or run-up maxima (WDL) (Ramírez and Pocitos) (Boak and Turner, 2005). A total of 39 independent measures overlap with the period and sites covered in this study and were compared to the corresponding yearly total area estimate obtained using this methodology. Despite the differences in the acquisition procedures the independent information served as reference to calibrate the method parameters for the Montevideo coast.
Data analysis and results plot were performed using R software (R Development Core Team, 2012). Wilcoxon’s Signed-Rank Test and Pearson’s correlation coefficient were applied to analyze differences between independent and estimated data without assuming normality; estimations were compared with and without discriminating by the methodology of the independent information. Using the best performing classification parameters (CTH and VTH) total beach area was estimated for 20 beaches on the Montevideo coast. Results were standardized to facilitate visualization and allow comparisons of area variations between beaches of different size and make evaluations at coastal level. The standard score for a given beach was obtained by subtracting the mean beach area in the entire period to the area on a year and dividing by the standard deviation for the whole period (standard score beach(Y) = (area(Y)-mean area)/standard deviation, where Y is the year).
RESULTS
Wilcoxon’s paired test did not reject the equivalence of the estimated and independent medians of sandy beach area when it was performed with CTH=0.50 (Fig. 4). Correlation between the two approximations was high, with a maximum Pearson’s score of 0.80, corresponding to CTH=0.50 and VTH=0.15 (Fig. 4).
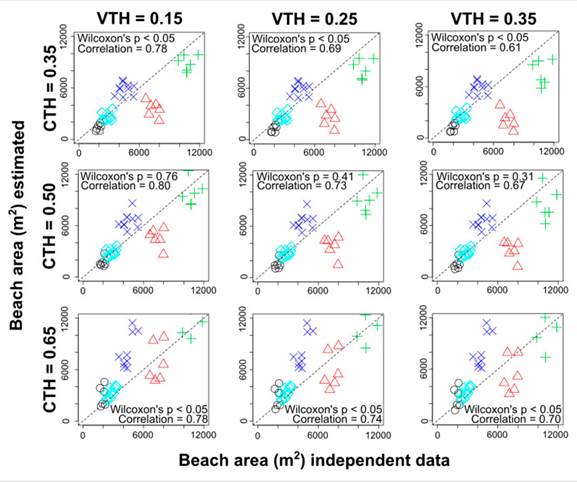
Figure 4 Scatter plots of the calibration for beach area estimated considering different classification thresholds (CTH) and vegetation thresholds (VTH). At each scatterplot, the p-value of the Wilcoxon’s Signed-Rank Test and the Pearson’s coefficient of correlation with paired samples are shown. Each of the compared beaches is shown with a different shape: circles (black) correspond to Brava, rotated squares (sky-blue) to Ramírez, exes (blue) to Pocitos, triangles (red) to Buceo, crosses (green) to Malvín.
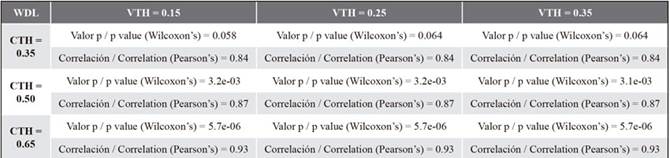
When independent measures were discriminated by methodology an interesting pattern emerged, PHTH estimations were better correlated to measures obtained with CTH = 0.65 (Table 2). While WDL was non-discriminated from measures with CTH = 0.35 (Table 3). No major differences associated to the different VTH were registered at this stage of the analysis.
Table 2 Comparison of estimated areas with independent measures taken with the previous high tide high water level (PHTH) methodology. Wilcoxon’s p-value and Pearson’s correlation index are given for the comparisons with combinations of vegetation threshold (VTH) and classification threshold (CTH) values.
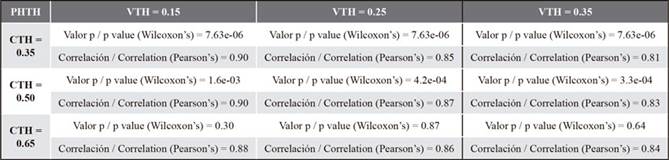
Table 3 Comparison of estimated areas with independent measures taken with the wet/dry line (WDL) methodology. Wilcoxon’s p-value and Pearson’s correlation index are given for the comparisons with different combinations of vegetation threshold (VTH) and classification threshold (CTH) values.
The best adjustment on pooled independent data were obtained with CTH =0.50 and VTH = 0.15. The measurements obtained with these parameters showed high p-value and the best correlation with the independent information. Yearly sand and vegetation estimation for 20 beaches on the Montevideo coast for the period 1984-2019 were obtained applying these values (Fig. 5), the resulting database and the GEE scripts are openly available at: http://doi.org/10.5281/zenodo.4327667 (Orlando, 2020). The pattern arising on standardized beach area (Fig. 5A.2 and 5B.2) shows a similar behavior of beach area variations for the Montevideo coast suggesting the existence of common drivers.
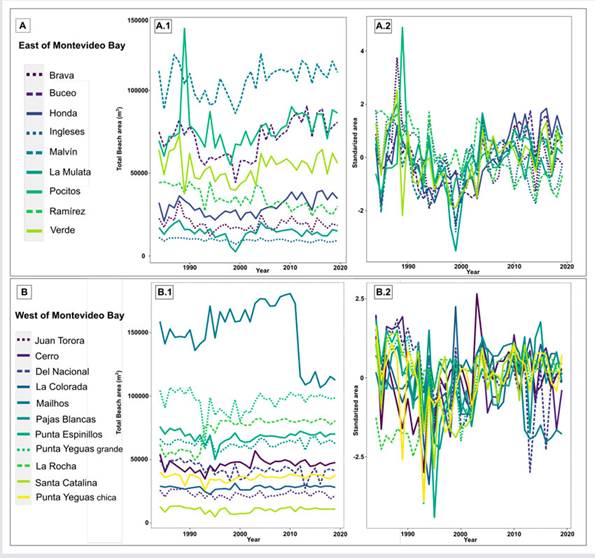
Figure 5 Beach area estimations for 20 sites analyzed in the 1984-2019 period. For visualization purposes beaches were divided geographically: Panel A shows information for beaches 12 to 20, located at the east of Montevideo Bay; Panel B shows beaches 1 to 11, located west of Montevideo Bay. In A.1 and B.1 the total beach area in square meters is shown, A.2 and B.2 show the standardized beach area variation for each portion of the coast.
DISCUSSION
This study describes and test a methodology for estimating beach area, allowing single site studies as well as large scale coastal monitoring and the reconstruction of past information at a low operative cost. Mitigation of climate change effects and the sustainable use of sandy beach ecosystems is constrained by the available information (Harley et al., 2010). The estimations obtained through the methodology proposed here would allow a better, more informed, coastal management by: 1) detecting erosive patterns or hotspots, 2) fostering an improved understanding of the relationship between climate drivers and coastal change, 3) allowing quantified estimations of landscape attributes, such as vegetation, and 4) estimating recreational carrying capacity.
The methodology produces yearly measures, which reduce variability due to the time of the year or short-term climatic conditions by integrating year-round variations into a single image. This, together with the time span of the Landsat collection, makes this approach suitable as a standardized source of information for detecting erosive tendencies. However, the temporal scale is only constrained by the quality and quantity of available satellite images and can be selected depending on the objectives, for example, studies on a seasonal scale could analyze intra annual accretion/erosion cycles by comparing beach area on summer and winter.
A systematic analysis of the relationships between beach area and climatic variables can help elucidate the drivers behind beach area, and their sensitivity to climate change. For example, standardized information of beach area on the Montevideo coast has been related to variations on the climatic configuration (Orlando et al., 2019) with well-delimited quasi-decadal erosion and accretion phases. Beach area, at Montevideo, was negatively affected by sea level increase and positively correlated with sea surface temperature anomalies and offshore winds (which push the water away from the coast, decreasing wave energy and favoring accretion). Erosion was correlated with onshore winds (which increase aerial loss of sediment to the land and wave energy) and intense El Niño Southern Oscillation events (Orlando et al. 2019). Further, and more detailed, studies on this subject could analyze relationships between morphological characteristics and resilience to climate or urban forcing.
Vegetation area is an informative landscape variable complementary to sand area, essential for the acknowledgment of sandy beaches as ecosystem and not only sand and sea spaces. Analysis of the relationships between beach landscape attributes and expert opinion on conservation and recreational value have found beach vegetation to be positively related to expert-based conservational value and negatively to the recreational value (Orlando et al., 2021). A main issue related to beach vegetation is the introduction of invasive alien species (César de Sá et al., 2017), although this methodology is unable to discriminate exotic and native vegetation, the evolution of vegetation area can be used to detect growth patterns associated with invasive exotic species.
Sandy beach recreational carrying capacity relates to the length and width of the beach and especially the extent of the subaerial beach above the high water mark, a zone that is available for beach-users at all times (McLachlan et al. 2013). Sand area estimations are a proxy for this feature relevant to management that could help select different uses that balance conservation and recreation objectives in a region or a reserve network.
No significant differences were found between independent area measurements and estimations with CTH=0.5, even though the independent information (Gutiérrez et al., 2016) was based on snapshots taken on different times of the year and associated with good weather conditions (aerial photography or single satellite pictures). Regarding water and sand boundaries the results suggest that the automated method gives an intermediate measure between WDL and PHTH techniques, WDL estimates a higher beach area as it depends on the water sand interface at the current time, while PHTH relies on the previous high tide. In Figure 3, the independent WDL measures of beaches are above the 1:1 line, while PHTH measures are below, a pattern supported by the results of Wilcoxon’s p-value and Pearson’s correlation. However, due to the spatial resolution of the Landsat series fine scale features such as this should be addressed carefully, the pattern found here could be influenced by tide range and other local conditions.
The exploratory analysis conducted in this work indicates that the methodology provides the necessary basis for quantifying sandy beach area, a major variable of sandy beach management and ecology. Furthermore, the temporal span of the Landsat collection allows to reconstruct beach area for over 30 years, this amount of previously unavailable information has the potential of improving knowledge on coastal dynamics and planning. The scripts are available (http://doi.org/10.5281/zenodo.4327667), the GEE platform is open and the Landsat collection has worldwide coverage, meaning that this methodology can be applied anywhere, allowing an increase on quality and quantity of the information critically needed for coastal management at a low operational cost.

