




 text in
  English (pdf)
 Article in xml format
 Article references
 Automatic translation
 Send this article by e-mail
 Cited by SciELO
  Cited by Google
  Similars in
SciELO
Similars in
SciELO  Similars in Google
 Permalink

INTRODUCTION
The Humboldt Current System (HCS), situated along the west coast of South America, stands out as one of the four most significant upwelling systems along the eastern edges of the major oceans (Chávez and Messié, 2009). This system undergoes both multi-decadal (El Viejo/La Vieja) and interannual (El Niño/La Niña) climatic variations, influencing upwelling, temperature, and production dynamics (Harrison and Chiodi, 2015). These variations have profound effects on the distribution and abundance of small pelagic populations (Alheit and Ñiquen, 2004; Bertrand et al., 2004; Ñiquen and Bouchon, 2004; Canales et al., 2018; Hernández-Santoro et al., 2018; Ortiz, 2020; Castillo et al., 2021). HCS supports the world’s largest anchovy (Peruvian anchoveta, Engraulis ringens Jenyns, 1842) population (Gutiérrez et al., 2017; Báez et al., 2021), one of the most productive small pelagic fish species, distributed from northern Perú to southern Chile (Alheit and Niquen, 2004). Administratively, along the coasts of Chile, there are three Peruvian anchoveta fishery units: The North Fishery Unit (Arica and Parinacota - Antofagasta Regions), the North Central Fishery Unit (Atacama - Coquimbo Regions), and the South-Central Fishery Unit (Valparaíso-Los Lagos Regions) (Garcés et al., 2019). The fishery operates primarily in the coastal zone, with significant catches recorded between 1997 and 2016 (Hernández-Santoro et al., 2019).
Acoustic surveys play a crucial role in the management of small pelagic fish, such as anchovy in the HCS (Hilborn and Walters, 2013; Ganias, 2014). Assessing fish size is a key component in both acoustic evaluations and fisheries management strategies (Hilborn and Walters, 2013). Traditionally, lengths have been visually measured using manual methods and metric boards (Øvredal and Totland, 2002), as well as through semi-manual and automatic approaches utilizing optical equipment (Gibson et al., 2016). These methods are effective when fish are close to optical measuring devices or fishing vessels with associated gear. However, challenges arise in specific or unfavorable circumstances where fish behavior is influenced by environmental conditions, making it impractical to conduct the fishing set (Øvredal and Totland, 2002; Kubilius et al., 2023). The inaccessibility of fishing nets to anchovy shoals is a common occurrence during fishing seasons and in certain situations during acoustic surveys (such as when Peruvian anchoveta schools are very close to the coast or near the bottom) (Ñiquen and Bouchon, 2004; Yáñez et al., 2004; Gutiérrez et al., 2007; Bertrand et al., 2008; Hernández-Santoro et al., 2018). Fishery acoustics emerge as a valuable tool for estimating fish size (Simmonds and MacLennan, 2005).
The conversion of acoustic measurements to estimate fish length involves analyzing individual targets on echograms (Simmonds and MacLennan, 2005). Several publications provide comprehensive insights into the fundamental principles of this methodology (Kubilius et al., 2023; Palermino et al., 2023) and demonstrate a strong correlation between TS and fish length. The relationship between TS and length (L; cm) can be estimated as TS= 20log10(L) - b20 (dB re 1 m2), where b20 is a genus or species-specific parameter (Simmonds and MacLennan, 2005). Research has shown that the TS can be used to estimate fish length through regression equations. One of these factors is the target strength (TS) of Engraulis mordax, estimated at −45.3 dB (sd = 5.7) for a mean length of 12.1 cm (sd = 1.1), which corresponds to a b20 value of 67.3 dB (Zwolinski et al., 2017). These equations allow researchers to convert TS measurements into estimates of fish length. Target strength (TS, dB re 1 m2) (MacLennan et al., 2002) serves as a reliable proxy for fish size in underwater acoustics, provided that species-specific relationships and influencing factors are carefully considered. Accurate TS measurements enable effective fish size estimation, biomass calculation, and species discrimination, which are essential for sustainable fisheries management and ecological studies (Hinchliffe et al., 2025).
The Peruvian anchoveta fishery in the Atacama Region of Chile is a complex system influenced by environmental, economic, and social factors. Effective management requires a comprehensive understanding of these dynamics and the implementation of sustainable practices to mitigate the impacts of climate change and overexploitation. The status of Peruvian anchoveta along the Atacama Region waters be assessed using models, which need an index of abundance and catch time series data to estimate stock and related fisheries references points. In recent years, no Peruvian anchoveta landings have been reported in the Region, creating a significant gap in both biological and fisheries data (IFOP, 2025). This lack of information hinders reliable estimates of fish stock size, productivity, and sustainable catch levels, which are crucial for effective fishery management. Additionally, the inaccessibility of Peruvian anchoveta shoals to fishing nets is a common issue in the coastal zone during acoustic surveys. This is largely due to oceanographic conditions that cause the anchovies to retreat closer to the coast, making harder to reach them with standard fishing nets. This difficulty reduces the accuracy of abundance measurements, further complicating the assessment of the species’ population dynamics and undermining the quality of the data necessary for informed decision-making in fisheries management. Likewise, estimating fish size without the need for biological sampling proves crucial for stock assessment and research, particularly when employing acoustic surveying platforms that cannot sample the surveyed species (Kubilius et al., 2023). In the present study, we aimed to estimate Peruvian anchoveta length distribution in Atacama Region, Chile using acoustic methods and algorithms within the framework of the “Incorporation of Peruvian anchoveta monitoring associated with the artisanal fishing fleet of the Atacama Region, Chile, year 2023” project.
MATERIALS AND METHODS
Study area and sampling design
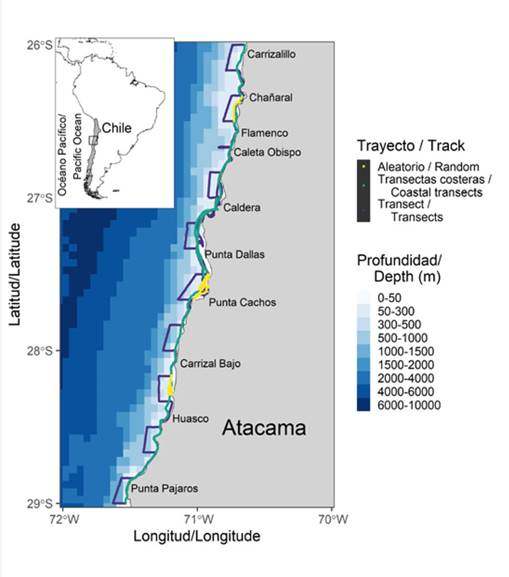
The acoustic survey was conducted during July 12 to 27, 2023, using the artisanal vessel “Don Pancracio” to obtain the distribution of Peruvian anchoveta schools living in the coastal waters of Atacama Region, Chile. The survey transects totaled approximately 2780 km (1501 nmi), including 19 west-east and 16 north-south transects spanning an area from the northern tip of Carrizalillo (26°S) to southern Punta Pájaros (29°S), including random sampling in coastal areas. The transects were approximately 13 to 18.5 km (7-10 nmi) long and were 18.5 km apart (Figure 1). The combination of random and systematic acoustic sampling in coastal areas enhanced the spatial and temporal resolution of the acoustic Peruvian anchoveta survey.
Acoustic data
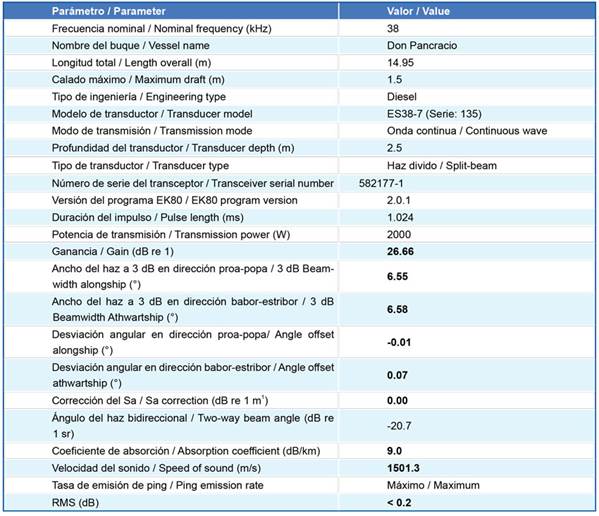
Acoustic narrowband data (Sv, dB re 1 m−1) at 38 kHz were recorded continuously with a calibrated (Foote, 1987; Demer et al., 2015) mounted on a support pole EK80 echosounder (SIMRAD Kongsberg Maritime AS, Horten, Norway) over the starboard side of the survey vessel and positioned to project vertically at a depth of ~1 m below the water surface. The 38 kHz echosounder calibration was performed before the survey in Caldera, Atacama, using a 38.1 mm tungsten carbide sphere and following the procedures described by Foote (1987). The acoustic mean volume backscattering strength Sv (in dB re 1 m−1) was calculated as Sv=10log(sv), with svthe volume backscattering coefficient in m−1(MacLennan et al., 2002). With the aim of measuring Target Strength (TS, dB re 1 m2) and tracking individual detections, the ping rate was set to ‘maximum’ for a maximum acquisition range of 150 m. Vessel speed was 13 km/hr during acquisition of acoustic data. The acoustic system configuration is detailed in Table 1.
Table 1 Main characteristics of the Don Pancracio artisanal purse seiner vessel and specifications of the EK80 (38 kHz) scientific echo sounder configuration during the Peruvian anchoveta acoustic survey in 2023. The highlighted text in bold corresponds to the results obtained during the calibration of the echosounder.
The raw acoustic data were pre-processed using open-source software Echo Sounder Package (ESP3) version 1.46.0 (https://sourceforge.net/p/esp3/wiki/ESP3/ESP3 Wiki on SourceForge) developed by NIWA (National Institute of Water and Atmospheric Research, Wellington, New Zealand) (Ladroit et al., 2020). Processing steps included a bottom detection with manual correction, removal of transient or attenuated signal (mostly caused by signal blocking due to harsh weather conditions or vessel movement), impulsive noise (instantaneous and sharp signals mainly caused by interference from other acoustic or electrical systems) and background noise (De Robertis and Higginbottom, 2007; Ryan et al., 2015) before the detection of individual fish traces (Soule et al., 1997).
Data processing and analysis
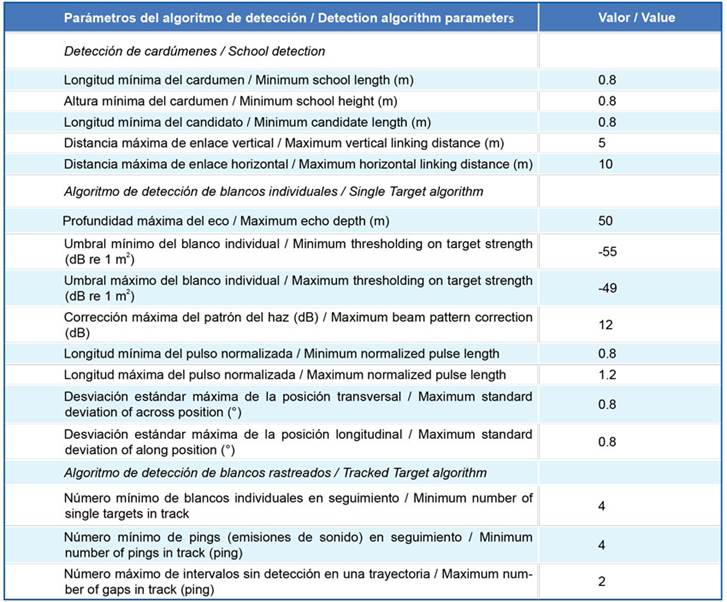
Peruvian anchoveta schools underwent identification and classification through meticulous manual examination by expert analysts, considering morphology, density, and behavior (Robotham et al., 2009; Korneliussen, 2018, Castillo et al., 2022). Two algorithms were employed for Peruvian anchoveta identification: Single Target (ST) (Ona, 1999; Balk and Lindem, 2000) and Tracked Target (TT) or Fish Tracking (FT) (Reid, 2000) (Table 2). The equations used align with documented standards for Echoview (Echoview Software Pty Ltd., Hobart, Australia). TS could be filtered based on minimum or maximum threshold values for any target property. TS echogram underwent reimportation and analysis using fish tracking techniques to discern fish behavior, including speed and depth changes.
Table 2 Settings for school detection, Single Target detections and Target Tracking algorithms in ESP3 acoustic software.
TS is a logarithmic function of the backscattering cross-section (; m2) that depends primarily on the internal physiology (mostly the presence and the shape of the swim bladder) and body orientation of the fish with regard to the transmitted sound beam (Hazen and Horne, 2003; Simmonds and MacLennan, 2005). TS measurements require the extraction of acoustic single targets (resolvable single echo traces using ST algorithm). And to increase the robustness of the results, single successive echoes of each individual fish were tracked to determine the mean fish TS over a range of pings (TT or FT algorithm) (Figure 2).
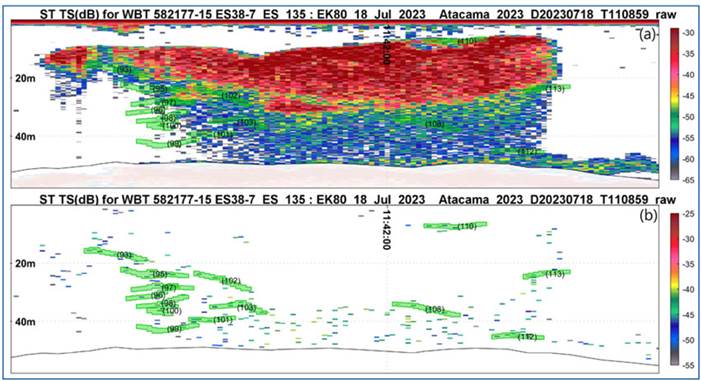
Figure 2 (a) The echogram (Sv) shows the presence of an Peruvian anchoveta school. The continuous black line indicates the exclusion zone (seafloor). (b) The Single Target algorithm detects individual fish in the echogram, represented in dB. Additionally, the Target Tracked algorithm of the ESP3 program allows for continuous tracking and identification of insonified fish, indicated by the green regions.
All TS measurements were compensated for the position of the detected target in the beam. Only tracks encompassing a minimum of four pings were retained. The cohesiveness of the selected tracks was inspected visually within a checking tracks tool developed in ESP3. The mean TS of each fish track was calculated in the linear domain (Equation 1).

Fish size estimation through acoustic approaches is well established in fisheries science (Love, 1971; Simmonds and MacLennan, 2005). TS is an indicator of fish size (Simmonds and MacLennan, 2005) but is also influenced by species, due to differences in ratios of body size to bladder size (Simmonds and MacLennan, 2005), and swimming behavior (e.g. tilt angle) of the species or individual (Nielsen et al., 1999). To translate TS into more intuitive length measurements (cm) than the decibel (Boswell et al., 2007) it is converted using empirical TS-length relationships, which often exist for specific species (Simmonds and MacLennan, 2005; Castillo et al., 2022). The calculation is based on the inverse of the following equations:

Here, L represents the total length of the fish (cm), TS is the Target Strength, and f is the sound transmission frequency (38 kHz). The values b (71.352) and m (18.134) are specific parameters for Peruvian anchoveta (Castillo et al., 2022). Reformulation of equation (2) to gain unknown lengths from known TS therefore becomes:

Frequency distributions of target lengths were exported (Excel) from the echogram and categorized into length (0.5 cm size classes). To ensure accurate estimates, the bootstrap re-sampling method with 1000 repetitions was employed (Hesterberg, 2011). The R programming language facilitated the bootstrap analysis, involving the creation of a function for computing the statistic of interest and using the boot() function from the boot library (Witten and James, 2013). A summary of the Peruvian anchoveta size distribution was calculated from the survey data based on the different algorithmic methods used. To compare length data between the different algorithms (ST and TT algorithms), Kruskal-Wallis test were used. All statistical analyses were conducted using RStudio (RStudio et al., 2020).
RESULTS
Spatial distribution and size estimation of Peruvian anchoveta
Spatially, the Peruvian anchoveta was observed shoaling from Chañaral to the area north of the port of Huasco. Echograms primarily revealed low-density aggregations, with a notable concentration of high-energy signals between Carrizal Bajo and Huasco, as well as dense aggregations near the seabed. A total of 318 TS-Length data points were extracted, 294 from the Single Target echo-counting algorithm and 24 from the Tracked Target algorithm. These TS values were then transformed using the TS-Length equation, allowing for the calculation of the corresponding Peruvian anchoveta lengths (Figure 3).
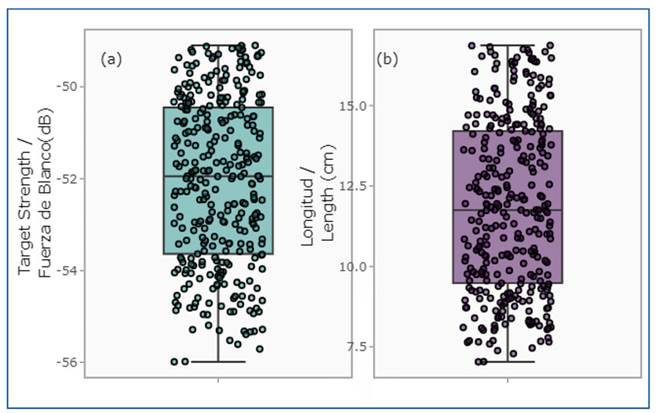
Figure 3 (a) Boxplot showing the distribution of Target Strength (TS, dB) values for Peruvian anchoveta, highlighting the range, median, and variability of TS values across the entire study area. (b) Boxplot showing the distribution of Peruvian anchoveta lengths (cm) obtained using the acoustic algorithms
The Target Strength (TS) ranged from a minimum value of -55.99 dB to a maximum of -49.1 dB, with a median of -51.95 dB. This indicates a relatively symmetric distribution, with values concentrated near the lower end of the range. The standard deviation of 1.81 suggests moderate variability in the data. For length, the minimum value was 7.03 cm, the maximum was 16.87 cm, and the median was 9.5 cm, with a mean of 11.75 cm. The distribution of Peruvian anchoveta length shows a more pronounced spread, with most values falling in the lower to middle range, although some larger values contribute to the higher mean. The standard deviation of 2.67 reflects greater variability in the length data compared to TS, indicating a wider spread.
Depth and size distribution of anchovies
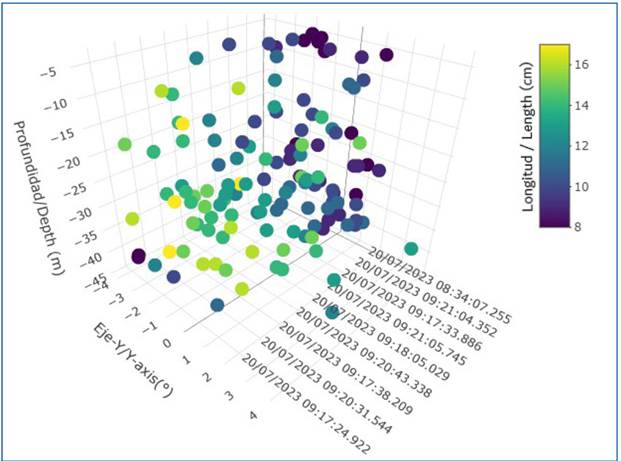
The depth of the echoes ranged from 3.92 to 43.95 m. This variability in depth, combined with the transformation of acoustic echoes into size data, reveals that longer Peruvian anchoveta are capable of inhabiting deeper coastal regions, highlighting a potential physiological adaptation to these environments (Figure 4).
Peruvian anchoveta size distribution and algorithm comparison
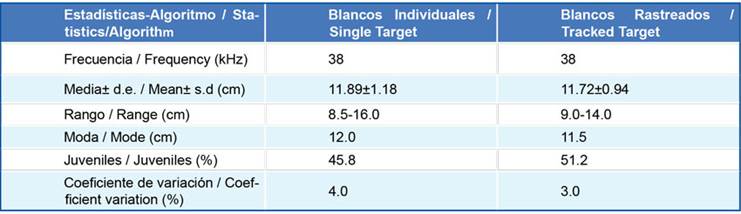
The size structure of anchovies, estimated through acoustics using the Single Target algorithm, exhibited a unimodal distribution, with fish ranging from 8.5 to 16 cm and a mean size of 11.89 ± 1.18 cm (CV: 4.0%) (Figure 5). In contrast, the Tracked Target algorithm identified anchovies within a narrower range of 9 to 14 cm, with a mean size of 11.72 ± 0.94 cm (CV: 3.0%). Notably, more than 70% of the acoustic echoes corresponded to fish sizes between 8.5 and 14.5 cm. Statistical analysis revealed no significant difference in the mean size estimates between the two algorithms (Kruskal-Wallis Test, p-value > 0.05).
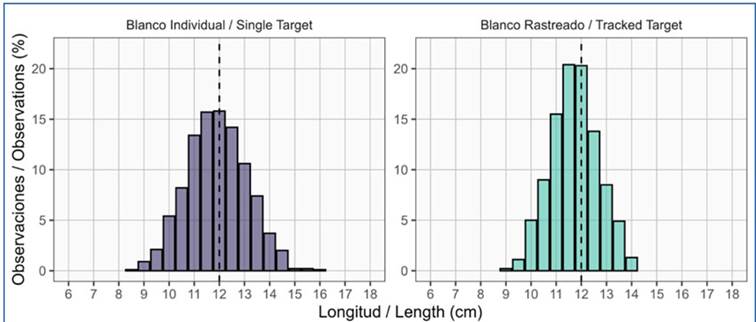
Figure 5 Histograms showing the echo length of Peruvian anchoveta derived from the single target (ST) and tracked target (TT) algorithms. Dashed lines represent the mean maturity size (juvenile) (< 12 cm total length). The data were bootstrapped with 1000 simulations.
Table 3 presents a summary of the length distribution of Peruvian anchoveta estimated using acoustic methods. The data, obtained from 1,000 bootstrap simulations per algorithm, allow for a comparison between two different approaches: the single target algorithm and the tracked target algorithm.
DISCUSSION
A large school of Peruvian anchoveta was encountered during the random sampling acoustic, this stochastic event created a significant outlier in the data (increasing mean acoustic density). Likewise, there are many difficulties in calculating TS estimates for dense schools due to sound attenuation (Simmonds and MacLennan, 2005). Therefore, we excluded this event from all subsequent analyses to avoid bias in our estimates of fish density (Sawada et al., 1993; Gauthier and Rose, 2001). The simplest dispersion model for a group of fish (or any group of identical dispersers) assumes that the fish are sufficiently spaced so that multiple scattering and attenuation are not factors causing incoherent responses (Love et al., 2016).
TS as proxy for fish size
Target Strength (TS) is a critical parameter in fisheries acoustics, often used to estimate fish size, density, abundance, and biomass. TS reflects the acoustic properties of a fish, which vary with factors such as fish size, orientation, species, and environmental conditions (Simmonds and MacLennan, 2005). The relationship between TS and fish length (L) is commonly modeled using the equation TS = m log10(L) + b, where m and b are species-specific constants that help establish the relationship between the two variables. This modeling approach allows for the estimation of fish size from acoustic measurements. In the present study, the Peruvian anchoveta-specific parameters b = -71.52 and m = 18.134 play a fundamental role in the accuracy of the model used to estimate fish length (L) from TS. These constants, derived specifically for Engraulis ringens from empirical data (Castillo et al., 2022), are crucial in ensuring the reliability of fish size estimates based on acoustic measurements at 38 kHz. However, it is important to note that this model is species-specific and must be recalibrated for other species to ensure accurate size estimations.
While TS is a valuable proxy for fish size in pelagic species, its accuracy is influenced by various species-specific factors, measurement techniques, and environmental conditions. Understanding and addressing these variables is essential for obtaining reliable acoustic survey data and making effective fisheries management decisions. On the other hand, TS comes with several limitations that can introduce variability and potential bias in the measurements. For instance, factors such as fish attributes (orientation, maturity, physiological condition, swim bladder presence), species-specific differences (unique TS-length relationships), environmental conditions (depth, pressure, mixed species assemblages), measurement techniques (echo overlap, type of acoustic equipment), and behavioral factors (swimming patterns, schooling behavior) all play a role in TS accuracy (Simmonds and MacLennan, 2005; Doray et al., 2016; Castillo et al., 2022). However, it is important to note that these factors were not analyzed in the present study, which may have introduced a bias in the results.
These limitations underscore the complexity involved in using TS as a proxy for fish size. To ensure more accurate estimates, it is necessary to carefully consider these factors and often recalibrate the model for specific species and environments. Furthermore, incorporating additional variables such as length-weight relationships, depth, and other environmental conditions into management strategies can enhance the precision of biomass and distribution estimates, ultimately contributing to more sustainable fisheries management practices.
Challenges and advancements in acoustic fish size estimation
Estimating fish size using acoustic methods presents several significant challenges, which can be categorized into technical, biological, and environmental factors: (i) The accuracy of fish size estimation heavily relies on the Target Strength (TS), which is influenced by fish physiology, orientation, and depth. Variations in TS due to these factors can lead to significant biases in size estimation. It is essential to correctly calibrate the acoustic instruments. Calibration methods, such as the use of metal spheres and hydrophones, have shown variability in results due to environmental conditions and the properties of the sphere materials (Knudsen, 2006). (ii) High species diversity, especially in tropical regions, complicates the conversion of echo intensities to biomass density. Different species and sizes reflect sound differently, and mixed species assemblages require careful consideration of species-specific TS-Length relationships. Fish orientation and swimming patterns can significantly impact the accuracy of acoustic measurements. For instance, fish swimming close to nets in circular motions can lead to underestimation of their length (Letessier et al., 2021). (iii) Variations in water temperature, salinity, and other hydrographic conditions can affect the acoustic properties of the medium, influencing the accuracy of size estimates (Knudsen, 2006).
However, advancements in fisheries acoustics are continuously addressing these challenges, with evolving technologies that offer significant improvements in species identification and size classification (Chu, 2011). The introduction of multiple frequencies represented a qualitative step in marine community studies, facilitating the differentiation of acoustic targets into categories based on relative frequency responses (Korneliussen, 2018). These advancements, including the use of broadband technology (Demer et al., 2017), are particularly promising for enhancing species discrimination and improving the classification of fish size classes (Simmonds and MacLennan, 2005; Benoit-Bird and Waluk, 2020). Broadband technologies, with their wide frequency spectrum, have proven effective in distinguishing between species and accurately classifying fish sizes (Stanton et al., 2012; Bassett et al., 2018; Kubilius et al., 2020, 2023; Hasegawa et al., 2021; Loranger et al., 2022). These technological improvements offer valuable potential to overcome some of the limitations in fish size estimation and contribute to more precise and reliable acoustic surveys.
Our study provided valuable insights into the fish size distribution across different sites within the study area. By utilizing acoustic narrowband data, we were able to estimate fish sizes with accuracy, shedding light on fish density and size variability. This study highlights the critical role of acoustic technology in obtaining essential fish population data, especially in situations where biological sampling is difficult or impractical. As a non-invasive and effective method, hydroacoustics offers a timely and reliable alternative for fish population assessment in contemporary research, helping to address the limitations of traditional sampling methods.
CONCLUSIONS
This study demonstrates the viability of directly converting acoustic signals into fish length estimates. By employing fish identification algorithms alongside an acoustic energy-to-length conversion model, we successfully estimated the length distribution of anchovies. The data derived from the Single Target algorithm revealed a distribution of anchovies ranging from 8.5 to 16 cm, with a mode of 12.0 cm, while the Tracked Target algorithm identified a length range of 9 to 14 cm, with a mode of 11.5 cm. These findings highlight the effectiveness of hydroacoustic methods in estimating fish size distribution, particularly in areas where traditional biological sampling with fishing nets is not feasible. Moreover, this study provides valuable insights into the distribution patterns of Peruvian anchoveta sizes, laying the groundwork for future surveys and enhancing our understanding of fish population dynamics in environments where direct sampling is challenging.

