




 text in
  English (pdf)
 Article in xml format
 Article references
 Automatic translation
 Send this article by e-mail
 Cited by SciELO
  Cited by Google
  Similars in
SciELO
Similars in
SciELO  Similars in Google
 Permalink

INTRODUCTION
Hydroacoustic cruises play a fundamental role in the assessment of pelagic species, such as the Peruvian anchoveta Engraulis ringens Jenyns, 1942 (Hilborn, 2003; Robotham et al., 2010), in the Humboldt Current System (HCS) (Ganias, 2014). This species is key in one of the most productive fisheries in the world, whose distribution covers coastal upwelling areas along an extensive latitudinal range, from northern Peru (04°S) to southern Chile (42°S) (Alheit and Ñiquen, 2004; Ganias, 2014). In recent years, the Peruvian anchoveta fishery production reached 4.9 million tons (FAO, 2024); however, this population is influenced by phenomena such as El Niño and other variations in oceanographic (FAO, 2024) conditions. In the HCS, off the northern coast of Chile, Peruvian anchoveta is the main fishing resource for the industrial purse seine fleet, accounting for approximately 80% of the annual landings (Armas et al., 2024). Administratively, along the coasts of Chile, there are three Peruvian anchoveta fishery units: the Northern Fishery Unit (Regions of Arica and Parinacota to Antofagasta), the Central-Northern Fishery Unit (Regions of Atacama to Coquimbo), and the Central-Southern Fishery Unit (Regions of Valparaíso to Los Lagos) (Garcés et al., 2019). These units reflect differences in population dynamics, fishing pressure, and management strategies, and constitute a relevant framework for the design of monitoring and acoustic evaluation strategies in different areas of the country. The evaluation of this resource is carried out through scientific cruises led by the research vessel (RV) Abate Molina, in continuous operation since 1991, which has allowed for the generation of a long-term time series for monitoring the state of the stock. This vessel is equipped with an EK60 echo sounder and a midwater pelagic trawl net (Engel model) (IFOP, 2025). These cruises have allowed for biomass estimates in large areas, where the abundance of Peruvian anchoveta is influenced by environmental factors such as sea surface temperature (SST) and chlorophyll-a (Chl-a) (Cerna et al., 2022). Various studies have shown that an increase in SST and a decrease in Chl-a can result in a reduction of Peruvian anchoveta populations, due to changes in primary productivity and the availability of suitable habitat (Alheit and Ñiquen, 2004; Bertrand et al., 2004; Ñiquen and Bouchon, 2004; Silva et al., 2016; Canales et al., 2018; Hernández-Santoro et al., 2019; Ortiz, 2020). Armas et al. (2024) reported that during La Niña events (2007, 2013) the Peruvian anchoveta moved westward; whereas, in El Niño 2015 its distribution was restricted to a narrow coastal strip (10 nmi). The exception was La Niña 2020, when the highest probabilities of capture were once again concentrated near the coast, due to unfavorable oceanographic conditions. Similarly, off the coast of Peru, a strong response of the Peruvian anchoveta was observed under warm and anoxic conditions (P. Castillo et al., 2025), which also favored its concentration in shallow areas. In response to these fluctuations, various artisanal purse-seine vessels (EACs) have been incorporated, equipped with a portable Simrad EK80 echo sounder, to assess biomass in areas close to the coast, mainly within 5 nautical miles (Ñiquen and Bouchon, 2004; Canales et al., 2018; Hernández-Santoro et al., 2019; P. Castillo et al., 2022; P. Castillo et al., 2025).
The Simrad EK60 scientific echosounder (Simrad Kongsberg Maritime AS, Horten, Norway), commercially available since 2001, has been used for decades in hydroacoustic assessment cruises of pelagic resources (Andersen, 2001). In 2016, the EK80 model was introduced, which can be configured to operate similarly to the EK60, ensuring consistency in abundance estimates over time (Macaulay et al., 2018; De Robertis et al., 2019). These calibrated echo sounders allow for the measurement of the reflectivity of fish schools, generating biomass indicators (Simmonds and MacLennan, 2005, Demer et al., 2015). The hydroacoustic assessment cruises for Peruvian anchoveta recruitment in Chile must be conducted in short periods, covering the entire distribution area of the target species. In these studies, the participation of multiple vessels is essential, as each one contributes to the evaluation of different areas of the stock. This requires comparing and evaluating the acoustic data generated by each platform (Simmonds and MacLennan, 2005), with the aim of reducing spatial and temporal variability in stock estimation (Simmonds et al., 1998). In this context, it is necessary to determine whether the acoustic densities of Peruvian anchoveta schools, recorded both with the main vessel (equipped with an EK60 echo sounder) and by artisanal boats (equipped with an EK80 echo sounder), are consistent and can be integrated without introducing significant biases in the estimates of biomass and population abundance. The precision and reliability of acoustic data is a key factor for fisheries management, as these measurements form the basis for estimating fish abundance indices (MacLennan, 1990; Koslow, 2009).
This study is based on the hypothesis that the distribution and behavior of Peruvian anchoveta are not significantly altered by the differences between observation platforms (research vessel and artisanal purse-seine boats), nor by the technological differences between their echo sounders (EK60 and EK80). If this hypothesis is validated, the acoustic data generated by both platforms could be robustly integrated, allowing for a more precise and efficient joint estimation of abundance.
The integration of these data would contribute to optimizing monitoring and fisheries management strategies, allowing for the adaptation of sampling designs in hydroacoustic surveys and extending coverage towards more coastal areas, with key implications for resource assessment. The objective of this study is to evaluate the acoustic measurements obtained with scientific echosounders through an intercalibration analysis between the main vessel (RV Abate Molina), equipped with an EK60 echosounder, and artisanal purse-seine vessels (EACs), equipped with EK80 echosounders. Likewise, the aim is to determine the effect of intercalibration adjustments on biomass estimates, in order to validate the joint use of multiple research platforms in assessment cruises.
MATERIALS AND METHODS
Study area
The present study was conducted off the coast of Chile in the regions of Arica and Parinacota-Antofagasta and Atacama-Coquimbo, aboard the research vessel (RV) Abate Molina (AM) and various artisanal purse-seine boats (EACs). The intercalibrations were conducted during four hydroacoustic assessment cruises for Peruvian anchoveta recruitment, carried out between 2022 and 2024 in the Northern Fishery Units (18° 25’ S - 24°30’ S) and Central Northern (25° 00’ S - 32° 10’ S) (Figure 1; Table S1, Supplementary Material).
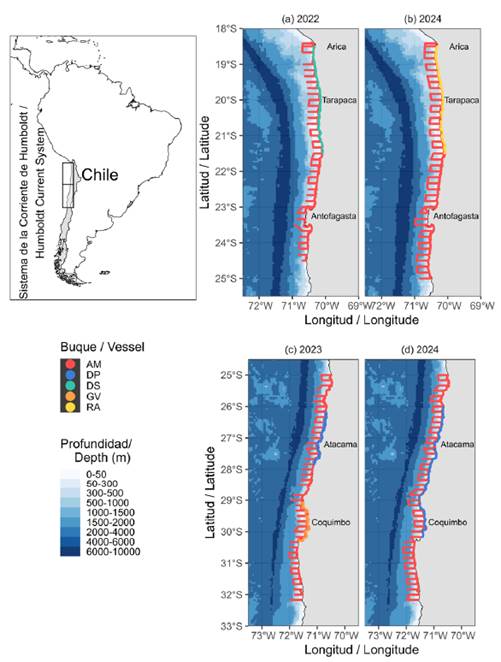
Figure 1 Study area for acoustic comparisons between the RV Abate Molina (AM), equipped with an EK60 echo sounder (main frequency: 38 kHz), and the artisanal purse seine vessels (EACs: Don Pancracio (DP), Don Sergio (DS), Garota V (GV), and Ragnar (RA)) equipped with EK80 echo sounders also operating at 38 kHz. (a) study area corresponding to the 2022 AM-DS (Don Sergio) cruise, (b) study area corresponding to the 2024 AM-RA (Ragnar) cruise, ( c) study area corresponding to the 2023 AM-DP (Don Pancracio) and AM-GV (Garota V) cruise, (d) study area corresponding to the 2024 AM-DP (Don Pancracio) cruise.
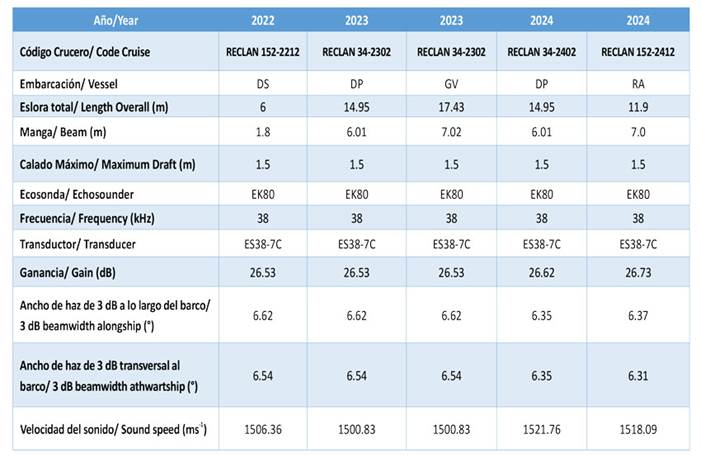
The scientific echosounder EK60 of the RV Abate Molina was configured to conduct acoustic sampling with a maximum sounding rate at a frequency of 38 kHz, in continuous wave mode, with a pulse duration of 1.024 ms and a power of 2000 w. The EK80 echo sounders installed in the EACs were configured with the same parameters to ensure comparability (Table 1). The echo sounder of the RV Abate Molina was calibrated with a standard tungsten sphere (WC/38.1 with 6% cobalt binder) (Foote et al., 1987; Demer et al., 2015), following the protocol of Foote et al. (1987). The calibration was applied to the transceiver (General Purpose Transceiver, GPT) using the Simrad ER60 v.2.4.3 software. The data were generated in .raw format (SIMRAD) (Demer et al., 2017) and stored externally.
Acoustic intercalibration design
The acoustic intercalibrations were carried out with a separation of 100 m between vessels, navigating at ~6.5 knots, representative of the operational speed of the EACs. The EAC maintained a south or north course while coordinating with the RV Abate Molina via VHF radio, which stands for Very High Frequency. Each transect lasted from 15 to 30 minutes, covering diverse acoustic conditions (Figure 2). The EK60 echo sounder of the RV Abate Molina was taken as the standard reference (MacLennan and Pope, 1983). The environmental conditions were favorable (wind ≤ 6 knots, wave height ≤ 2.3 m), which allowed for measurements with minimal acoustic and environmental disturbance.
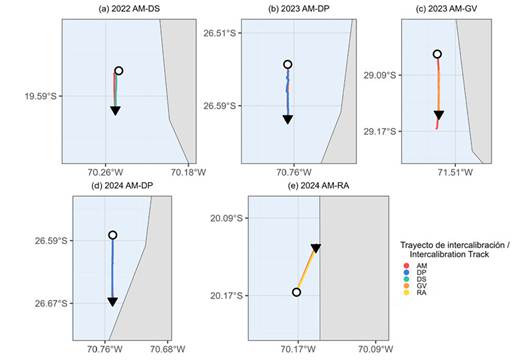
Figure 2 Trajectories of acoustic intercalibrations between the RV Abate Molina (AM) and the artisanal purse-seine vessels (EACs: DP, DS, GV, RA) during the hydroacoustic assessment cruises of Peruvian anchoveta between 2022 and 2024. The circle marks the starting point and the arrow indicates the direction of the navigation route. (a) acoustic intercalibration 2022 AM-DS (Don Sergio), (b) acoustic intercalibration 2023 AM-DP (Don Pancracio), (c) acoustic intercalibration 2023 AM-GV (Garota V), (d) acoustic intercalibration 2024 AM-DP (Don Pancracio), (e) acoustic intercalibration 2024 AM-RA (Ragnar).
Data processing and analysis
ESP3 software version 1.52.0 (Ladroit et al., 2020) (ESP3 / Wiki / ESP3 (sourceforge.net)) was used to explore, analyze, and export the acoustic data. The echograms were synchronized and segmented into horizontal layers of 100 pings and vertical sections of five meters. Concentrations of macrozooplankton, fish, and seabed were identified for comparative analysis between platforms with the aim of analyzing different levels of signal intensity (Zhu et al., 2024). This strategy allowed for a more robust evaluation of the functionality, sensitivity, and detection capability of the EACs.
Generalized Least Squares (GLS) model
To quantitatively evaluate the relationship between EAC measurements and RV, a Generalized Least Squares (GLS) model was applied, incorporating spatial autocorrelation with an exponential structure (corExp), considering the position variable as a proxy for dependency. The formulation was:
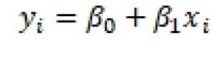
Where represents the acoustic density observed by the RV Abate Molina , is the density observed by an EAC, and and correspond to the intercept and the slope of the model, respectively. This approach is more robust than simple linear regression by considering spatial/temporal dependence, and it has been widely applied in comparative studies of research platforms (Foote et al., 1987; Simmonds et al., 1998; Simmonds and MacLennan, 2005; Massé et al., 2018). The models were fitted in R using the gls() function from the nlme package (Pinheiro and Bates, 2000; R Core Team, 2024), and the results were summarized using the modelsummary package (Arel-Bundock, 2022).
Analysis of ratio and intercalibration factor
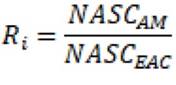
A complementary approach was applied based on the ratio between NASC values (Nautical Area Scattering Coefficient, m²nmi-²; (MacLennan et al, 2002)) recorded by the RV AM echo sounders and the EACs. From these values, the individual quotient was calculated:
The intercalibration factor Fint was defined as the median of the Ri, a robust measure against outliers (Massé et al., 2018). The median of the absolute deviation (MDAint) and the coefficient of variation (CV) were calculated as:
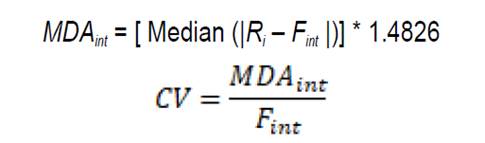
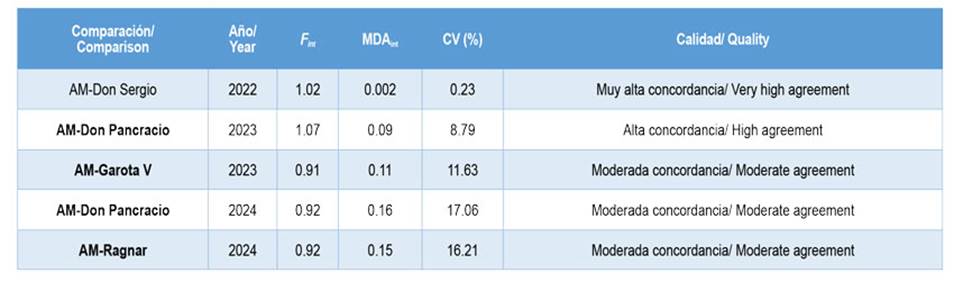
Where the factor 1.4826 adjusts the MDA to make it comparable to the standard deviation under a normal distribution (Adekeye, 2013). The quality of the agreement was classified into four categories according to the CV: very high agreement for values below 5%, high agreement for values between 5% and 10%, moderate agreement for values between 10% and 20%, and low agreement for values above 20%.
Estimation of biomass and adjustment for intercalibrations
Based on the acoustic data, the density (Sv: Volume backscattering strength, dB re 1 m-¹; (MacLennan et al, 2002) was estimated, and subsequently the NASC. To convert to fish density, the equation of the TS-Length relationship was applied J. Castillo et al. (2022):

The fish density was estimated as:

The total biomass (in tons) was calculated by multiplying the distribution area and the average individual weight estimated from the fishing hauls of the RV Abate Molina. The uncertainty was estimated using bootstrap (Robotham and Castillo, 1990). The NASC values of the EACs were then corrected by applying the F int factor, and with these, the adjusted biomass and its CV were recalculated, also estimating the percentage of variation with respect to the original value. All statistical analyses were performed with R (R Core Team, 2024).
RESULTS
Precision of the EK60 scientific echosounder calibrated with a standard sphere
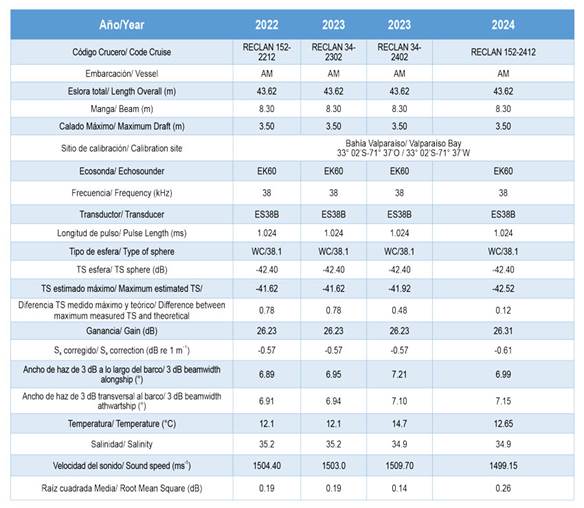
In this study, the sound speeds of the RV Abate Molina calibrations ranged between 1499.15 and 1509.70 ms-1, calculated from the temperature and salinity of the water during 2022-2024 (Table 2). The maximum TS observed from the calibration sphere were -41.62, -41.92, and -42.52 dB, measured at a depth of ~15.3 m. Using the standard Target Strength calculator of the National Oceanic and Atmospheric Administration (NOAA), the theoretical TS of the tungsten calibration sphere for 38 kHz, calculated from the temperature and salinity of the water measured in the study, was -42.40 dB. Therefore, the difference between the measured and theoretical values was less than 1 dB. The values obtained were consistent with a root mean square deviation (RMS, expressed in dB), between the adjusted acoustic beam model and the theoretical one, below the maximum value recommended by the manufacturer (RMS <0.4 dB), which translates into acceptable results (Table 2).
Intercalibration of EK60 and EK80 scientific echosounders
The echograms presented in Figure 3 allow for a visual observation of the structure of the aggregations detected by each platform. In general, the echograms were composed of weak echo densities, mostly associated with macrozooplankton layers (Sv values less than -60 dB). In most cases, the seabed is observed delineated by a continuous black line, corresponding to Sv values around -25 dB.
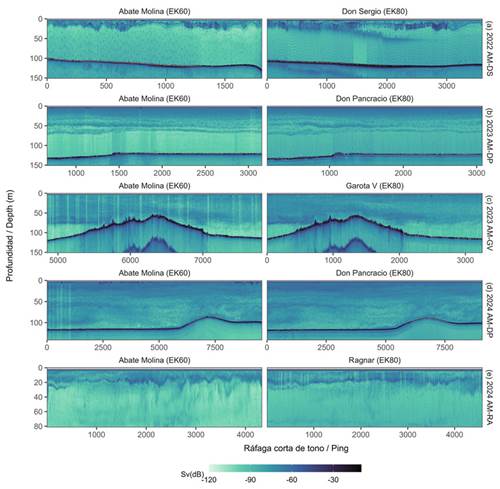
Figure 3 Echograms at 38 kHz recorded by the RV Abate Molina (AM), equipped with an EK60 echosounder, and by artisanal purse-seine vessels (EACs: DS, DP, GV, RA) equipped with EK80 echosounders. (a) 2022 AM-DS acoustic intercalibration (Don Sergio), (b) 2023 AM-DP acoustic intercalibration (Don Pancracio), (c) 2023 AM-GV acoustic intercalibration (Garota V), (d) 2024 AM-DP acoustic intercalibration (Don Pancracio), (e) 2024 AM-RA acoustic intercalibration (Ragnar).
To quantitatively evaluate this concordance, GLS models with spatial autocorrelation were applied between the acoustic measurements recorded by the AM and the different EACs. Figure 4 shows the scatter plots of acoustic densities (NASC, m²nmi-²) observed by each EAC compared to those of the RV Abate Molina, along with the fitted line derived from the GLS model for each case.
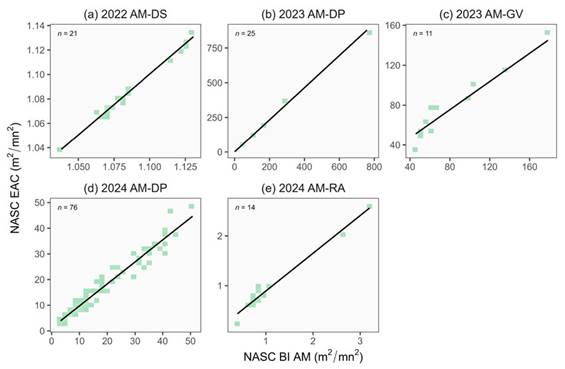
Figure 4 Comparisons of the observed eco-integration (m2nmi-2) between the RV Abate Molina (EK60) and the EACs (EK80): Dispersion of the acoustic densitiesrecorded by both platforms, with a fitted line obtained through the GeneralizedLeast Squares (GLS) model. (a) 2022 AM-DS acoustic intercalibration (DonSergio), (b) 2023 AM-DP acoustic intercalibration (Don Pancracio), (c) 2023 AM-GV acoustic intercalibration (Garota V), (d) 2024 AM-DP acoustic intercalibration (Don Pancracio), (e) 2024 AM-RA acoustic intercalibration (Ragnar).
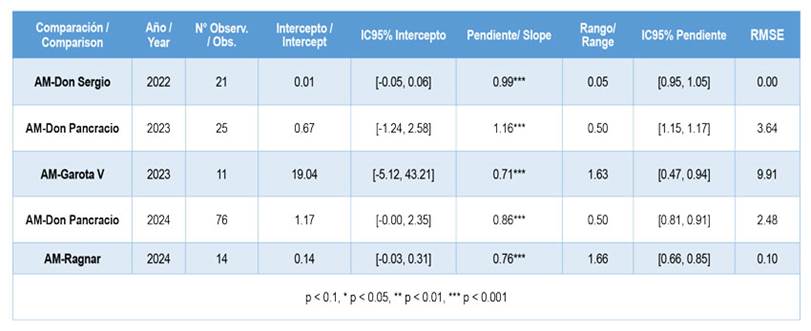
The adjusted models show different degrees of agreement between platforms depending on the year and the vessel involved (Table 3). On the 2022 cruise, the vessel Don Sergio showed the greatest correspondence with the research ship, with a slope practically equal to 1 (0.99) and a zero residual error (RMSE = 0.00), indicating high precision and absence of systematic bias in the measurements. In 2023, significant differences were observed: Don Pancracio showed a slope significantly greater than 1 (1.158), indicating a systematic overestimation in the estimation of the EAC, with a moderate residual error (RMSE = 3.64); whereas Garota V presented a slope less than 1 (0.71) and a high intercept, suggesting a systematic underestimation and an additional bias, as well as greater unexplained variability (RMSE = 9.91). By 2024, Don Pancracio showed an improvement in concordance compared to the previous year, although still with a slope less than 1 (0.86) and a lower residual error (RMSE = 2.48), indicating a moderate underestimation. For his part, Ragnar showed a good match with the research vessel (slope = 0.76) and a very low residual error (RMSE = 0.10), which reflects minimal variability in the measurements. The spatial autocorrelation parameters (range) estimated in the models varied between 0.05 and 1.66, reflecting different levels of spatial dependence between consecutive measurements along the transect. This correlation structure was key to improving the accuracy of the estimates compared to a simple linear model, by adequately capturing the spatial structure inherent in the acoustic data.
Table 3 GLS model results for the intercalibrations between the RV Abate Molina (AM) and the EACs at 38 kHz. CI: Confidence Interval, RMSE = Root Mean Square Error.
Based on the described methodology, it was decided to apply the ratio approach in order to obtain an intercalibration factor (F int ), which would allow for adjusting the values recorded by the EACs. This adjustment was essential to standardize the acoustic measurements between platforms and ensure a more accurate estimation of Peruvian anchoveta biomass. The results obtained (Table 4) show different levels of agreement between the platforms and the years evaluated. For example, very high concordance was observed for Don Sergio (2022) and high concordance for Don Pancracio (2023); whereas, in other cases, such as Garota V (2023), Don Pancracio (2024), and Ragnar (2024), the concordance was moderate, highlighting the importance of applying the F int factor before the final biomass calculation. This factor was subsequently used to directly adjust the acoustic data of the EACs, thus allowing their contribution to be coherently integrated into the global stock estimation.
Evaluation of variation in estimated biomass after intercalibration adjustments
The results show that adjusting the NASC values using intercalibration factors (F int ) between platforms did not generate significant differences in the final estimates of Peruvian anchoveta biomass, suggesting a high consistency between the acoustic measurements taken from artisanal purse-seine vessels (EACs) and the research vessel (Table 5).
Table 5 Comparison of estimated Peruvian anchoveta biomass with and without adjustment for intercalibration, considering size, average weight, and platforms used per cruise. AM: Abate Molina.
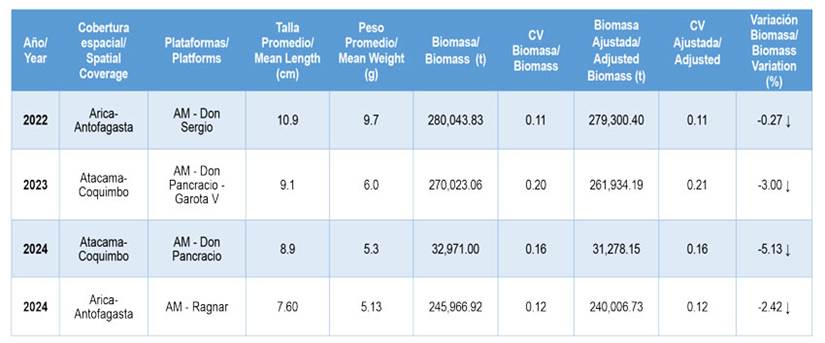
In the four cruises analyzed between 2022-2024, the percentage variations between the originally estimated biomass and the adjusted biomass were low and negative in all cases, with values of -0.27% in 2022, -3.00% in 2023, -5.13% in 2024 (Don Pancracio), and -2.42% in 2024 (Ragnar). These differences remained within acceptable margins, indicating that the application of the F int did not introduce significant biases and allowed the robustness of the biomass estimates to be maintained.
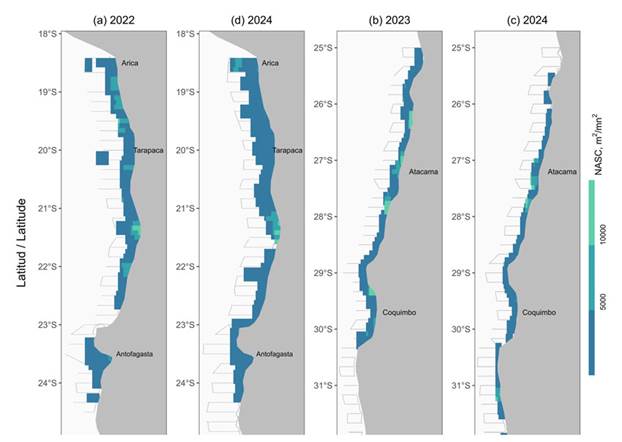
Likewise, the coefficients of variation (CV) of the adjusted biomass were practically equal to the original values, which reinforces the reliability of the intercalibration procedure applied. Consequently, the integration of artisanal vessels represents a viable and technically sound strategy to strengthen the acoustic assessment programs for the Peruvian anchoveta resource (Figure 5).
DISCUSSION
Intercalibration between sampling platforms: a strategy to expand coverage without compromising quality
The need to perform acoustic intercalibrations between platforms has been highlighted by various authors as an essential element to ensure the consistency and comparability of results over time (Simmonds and MacLennan, 2005). In line with this vision, the International Council for the Exploration of the Sea (ICES, 2015; Doray et al., 2021) has published specific guidelines recommending the periodic planning of intercalibration exercises between vessels and acoustic equipment, in order to minimize potential biases and ensure methodological consistency in fisheries assessment cruises. In this study, the need for intercalibration between sampling platforms has been addressed when comparing and adjusting observations obtained by artisanal vessels with those generated by a scientific research vessel. The incorporation of portable scientific echosounders EK80 of 38 kHz in artisanal purse-seine vessels (EACs), and their comparison with the EK60 echosounder installed on the research vessel Abate Molina, has been a key component in the hydroacoustic assessment cruises of Peruvian anchoveta recruitment conducted between 2022 and 2024 in the Northern and North-Central Fisheries Units of Chile. This strategy has allowed for a significant expansion of the spatial coverage of the cruises without compromising the quality of the data. Intercalibration, in this context, ensures that the data generated by these platforms and adapted maintain levels of accuracy and consistency equivalent to those obtained by the research vessel, allowing for the robust integration of information collected in different sectors of the ecosystem.
Are there differences in the performance of echo sounders?
Hydroacoustic surveys are key tools for estimating the abundance and biomass of fishery resources (Simmonds and MacLennan, 2005). To evaluate the performance of different echosounders, it is necessary to conduct intercalibrations between research platforms using robust statistical models, such as generalized least squares (GLS) models, which allow capturing the spatial autocorrelation inherent in acoustic data. The results show that, despite expected differences due to operational or installation conditions, the EACs were able to consistently reproduce the acoustic density patterns observed by the research vessel. For example, Don Sergio (2022) presented a slope close to 1 (0.99), while other vessels, such as Garota V (2023), showed greater deviations, which were corrected by applying intercalibration factors (F int ). Similar results were reported by other authors, with comparison ratios ranging from 0.99 to 1.15, and linear regression slopes between 1.00 and 1.02, reflecting a high consistency in the measurements obtained across different platforms (Macaulay et al., 2018; Massé et al., 2018). Consistently, other studies have also reported differences of less than 10% when comparing echo sounders across different platforms. For example, a high degree of agreement has been observed between an unmanned surface vehicle (USV) and a research vessel (Swart et al., 2016; De Robertis et al., 2019), between different vessels (De Robertis and Handegard, 2013), as well as between different instruments installed on the same vessel (Macaulay et al., 2018). These background factors support the validity of the range observed in this study and reinforce the applicability of the intercalibration process to maintain the comparability of acoustic measurements. The intercalibration of echo sounders does not aim to calibrate the data itself, but to adjust the measurements from different platforms to make them comparable. In some cases, due to adverse weather conditions or logistical restrictions, it was not possible to perform direct calibrations at the EACs, which underscores the importance of the subsequent intercalibration process (Gutiérrez et al., 2016).
Precision of EK60 and EK80 echo sounders: possible biases in acoustic comparisons
The differences between the EK60 and EK80 echo sounder models are considerably smaller than those arising from other sources of bias in acoustic surveys and stock assessment processes (Simmonds and MacLennan, 2005). Therefore, when using the EK60 and EK80 echo sounders, with the appropriate configuration and data processing, there should not be a significant change introduced in the abundance estimation in a time series assessment (Macaulay et al., 2018). In an ideal intercalibration, it is expected that both echosounders observe the same target under similar conditions. However, in practice, this rarely happens. Relative bias, defined as the systematic difference between the reference echosounder and the secondary one, can be due to equipment as well as operational, environmental, or biological conditions (Chander et al., 2013). The results of this study showed differences of less than 1 dB between the theoretical Target Strength (TS) value and the maximum value observed during calibrations with a standard sphere, which is within the acceptable range (Demer et al., 2015). This indicates a good calibration of the main equipment and, in turn, provides a reference framework for evaluating the relative performance of the echo sounders installed on artisanal vessels.
A relevant aspect is the equivalent beam angle (EBA), especially when the fish are located at greater depths (>80 m), as occasionally happens with Peruvian anchoveta (Hernández-Santoro et al., 2019; Caballero et al., 2024). In this study, background signals (100-150 m) were also considered, allowing for the evaluation of the effect of EBA on the performance of echo sounders. Moreover, comparisons between scientific equipment such as the WBAT and the Signature100 have shown differences in the detection of aggregations, attributable to noise treatment and sensitivity, highlighting the importance of careful evaluation even among instruments designed for similar purposes (Annasawmy et al., 2024). Regarding the avoidance of sampling volume, although horizontal avoidance has been documented in some pelagic species (e.g., jack mackerel, herring) (De Robertis and Handegard, 2013), in the case of Peruvian anchoveta, studies by Gerlotto et al. (2004) suggest that avoidance is predominantly vertical. These findings confirm that, with appropriate configurations, EK80 equipment installed in EACs can offer levels of accuracy comparable to standard echo sounders like the EK60.
Intercalibration of platforms: relevance and limitations
Commercial fishing vessels have been recognized as complementary platforms for the collection of scientific data, especially in oceanography and fisheries monitoring. Its wide geographical coverage and frequency of operation allow access to areas where traditional scientific vessels rarely operate, thus improving the spatial and temporal representativeness of the data obtained (Melvin et al., 2016; Gawarkiewicz and Malek Mercer, 2019; Manso-Narvarte et al., 2024). This integration has opened new opportunities to increase efficiency and reduce costs in long-term marine monitoring programs.
The ratio between NASC values recorded by the EACs and the main vessel was used to derive intercalibration factors (F int ) that would allow for the adjustment of measurements from the complementary platforms. In most cases, the coefficient of variation (CV) associated with F int was low (<10%), indicating good agreement. However, vessels like Garota V (2023) or Don Pancracio (2024) showed greater variability, highlighting the importance of applying this type of correction to ensure the consistency of global estimates.
It is worth noting that the comparison intervals were relatively short (between 15 and 30 minutes), so while the results are consistent, their applicability to longer time scales should be interpreted with caution (Carrera, 2015). It is suggested to complement these comparisons with longer duration experiments in future studies. The central objective of these intercalibrations is to ensure that the differences observed between research platforms do not create biases in the estimation of abundance and biomass (Simmonds and MacLennan, 2005; ICES, 2015). In this study, the application of F int generated minor adjustments in the estimated biomass (<5.5% in all cases), without significant changes in the coefficients of variation, which supports the robustness of the procedure. For the correction of acoustic biomass estimates between vessels, the average ratio of acoustic densities (Rᵢ) was chosen, due to its direct interpretation as an adjustment factor, as well as its lower relative variability (CV) compared to the error of the GLS model (RMSE). This approach allows for consistent and reproducible corrections to be applied to the biomass estimates obtained by the EACs, ensuring a high concordance with the reference values of the RV Abate Molina.
Implications for acoustic survey cruises and fisheries management
The intercalibration between vessels is an essential step to ensure the comparability of acoustic data, especially when seeking to integrate information obtained from different platforms over time. Various studies have shown that when acoustic systems are equivalent and proper intercalibration is performed, it is possible to combine the data without introducing significant biases (Røttingen, 1978; MacLennan and Pope, 1983; Simmonds et al., 1998; Cotter, 2001; Leonori et al., 2012; Carrera, 2015; Macaulay et al., 2018; Massé et al., 2018). A notable example is found in the Adriatic Sea, where the comparison between two research vessels did not show statistically significant differences in the acoustic data collected, thus validating their joint use in future biomass assessments (Leonori et al., 2012). Similarly, in acoustic survey targeting pelagic species, the intercalibration between the research vessels Miguel Oliver and Thalassa showed comparable efficiencies for both platforms, with no differential effects on fish behavior or acoustic abundance estimates (Carrera, 2015). However, intercalibration exercises remain essential to assess the potential impact of changing vessels in a time series, as well as to ensure methodological consistency in the combination of data from multiplatform cruises (Simmonds and MacLennan, 2005; ICES, 2015; Doray et al., 2021).
The results of this study support the feasibility of integrating artisanal platforms equipped with EK80 scientific echosounders in hydroacoustic assessment cruises. Although differences between vessels were identified, the application of intercalibration factors allowed for the harmonization of measurements and the obtaining of robust estimates of Peruvian anchoveta biomass. These findings reinforce the need for periodic intercalibrations, particularly when aiming to maintain the comparability of time series or incorporate new observation platforms.
CONCLUSIONS
The acoustic measurements obtained by artisanal vessels equipped with EK80 echo sounders were comparable to those of the research vessel Abate Molina (EK60), with differences of less than 5.5% after applying intercalibration factors. The use of the mean acoustic density ratio (Rᵢ) allowed for consistent adjustments with low variability. These results support the integration of artisanal platforms in hydroacoustic cruises, expanding monitoring coverage without introducing significant biases in biomass estimation.

