




 text in
  English (pdf)
 Article in xml format
 Article references
 Automatic translation
 Send this article by e-mail
 Cited by SciELO
  Cited by Google
  Similars in
SciELO
Similars in
SciELO  Similars in Google
 Permalink

INTRODUCTION
The level of microplastics (MPs,<5 mm) in our oceans is set to grow 50-fold by the end of the century raising the risk of widespread extinction of marine life in the most polluted areas (Tekman et al., 2022). Microplastics, due to their nature, play a very important role as vectors for a wide variety of chemicals of known toxicity that adhere to their surfaces (Andrady, 2011; Koelmans et al., 2016; Acosta-Coley et al., 2019). After their introduction into ecosystems, they bioaccumulate through their ingestion by different organisms in the food chain, constituting a threat to all biota (Vital et al., 2021; Miller et al., 2023).
Although awareness of plastic debris into marine life is increasing, knowledge of the abundance and size distribution of plastic debris in Marine Protected Areas (MPA) is still very low (Béraud et al., 2022). Those areas do not escape from the pollution problem, and many species are already considered vulnerable to plastic contamination (Deakin et al., 2024). The Rosario and San Bernardo Archipelagos are an important Marine Protected Area in the southwestern Caribbean, comprising three protected areas: 1) Corales del Rosario y San Bernardo National Natural Park, 2) El Corchal “El Mono Hernández” Fauna and Flora Sanctuary, and 3) Corales de Profundidad National Natural Park. That MPA exhibits a higher risk of degradation of coral reefs due to its level of exposure (concentration and duration) to continental fluxes from the Magdalena River, main contributor of terrestrial fluxes into the Caribbean Sea (Restrepo et al., 2016). These activities may be significantly correlated with the increased presence of plastic debris of any size on the coasts, estuaries, and bays (Tosic et al., 2019). There is therefore concern over the potential additional threats that plastic pollution may pose to Rosario and San Bernardo Archipelago species through physical harm, life cycle alterations and as a vector for pathogens, invasive species and chemicals.
The precarious basic sanitation structure, urban planning, waste management, combined with the extensive network of navigable waters, are aggravating factors for the increase in plastic pollution in the region (Acosta-Coley et al., 2019; Garcés-Ordóñez et al., 2021; La Daana et al., 2022). It is necessary to increase research investment on the topic, considering microplastics quantification, impacts and the relationship with the oceanographic dynamics of the Caribbean Sea. The creation and enforcement of laws that minimize the accumulation of these materials is emerging, besides the development of the bioeconomy and sustainable proposals to minimize plastic pollution in the MPA.
Previous data collected in 2020 along the Caribbean coast using plankton nets (60 and 500 μm mesh size) towed at the sea surface, revealed microplastics present in high quantities in the area, mainly close to the larger population centers like Cartagena, which have the highest production of wastewater and solid waste (Garces-Ordoñez et al., 2021). Around Cartagena there is a high industrial development, including the production of plastics, and part of its coast is influenced by the discharge of continental waters through the Canal del Dique, an artificial arm of the Magdalena River, which emits an estimated load of 16,700 tons of plastics per year into the Caribbean Sea (Lebreton et al., 2017). This localised hotspot of sea surface microplastics can be one of the main sources of plastic pollution to the MPA.
Despite growing plastic production and discharge into the environment, researchers have faced difficulties in detecting the expected rise of small microplastics (<1 mm) on marine surfaces and within the subsurface waters. Various types of plastic polymers have densities higher than seawater, which should logically lead to sinking. Even the most abundant polymers, such as polyethylene (PE), polypropylene (PP), and certain forms of polystyrene (PS), which are less dense than seawater, may sink when contaminated by biofouling due to increased density, or when incorporated into fecal pellets after ingestion and into marine snow. However, several factors in these processes remain uncertain, and the amount of microplastics exported from surface waters to subsurface wates through sinking is still unclear (Abayomi et al., 2017; Erni-Cassola et al., 2019).
A large number of plastic debris items are usually collected during the sampling process. Given the high volume of data, it is necessary to reduce the number of final spectra to be compared with pristine polymer spectra by applying clustering models. These statistical approaches are crucial to reduce dimensionality, decrease computational complexity, eliminate redundant information, and enhance data interpretability. Among them, k-means is widely used due to its simplicity and guaranteed convergence (Zhou, 2021). When applied in combination with ATR-FTIR spectra expressed in principal component space (PCA), this method efficiently removes redundancy and produces clustering schemes adjusted to performance indices. However, considering the massive datasets generated in microplastic monitoring of marine environments, more advanced approaches based on neural networks have been developed to further improve clustering accuracy and computational performance (Phan and Luscombe, 2023).
Our current understanding of the threat of seawater microplastic pollution to Rosario and San Bernardo Archipelagos fauna is based on limited field sampling from the studies on the Caribbean coastline. The aims of this study were as follows: 1) evaluate the occurrence and microplastics characteristics (shape, color, and size) in MPA during 2022, 2) to determine if the abundance of microplastics changed between trawls (surface water and subsurface water), seasons (dry and rainy seasons) and stations (nearshore and offshore), 3) to use a clustering model to reduce the number of final spectra to be compared with pristine polymer spectra, and 4) to document the type of polymers identified. This study contributes to quantifying plastic pollution levels in the Greater Caribbean and assessing continental inputs in the southwestern region
Study Area
The Corales del Rosario and San Bernardo National Natural Park (PNNCRSB) and the Corales de Profundidad National Natural Park (PNNCPR) are part of the Rosario and San Bernardo Archipelagos MPA located in the Colombian Caribbean region, located within the coordinates 9°35’- 10°15’ N and 75°30’ - 76°17’ W offshore from the departments of Bolívar.
The PNNCRSB is located in the western Caribbean basin, 23 km south of the city of Cartagena de Indias in the Punta Gigante and 35 km northeast of the town of Santiago de Tolú, and includes the submarine platform and coral reefs to the west of Barú Island, the reefs of the Rosario and San Bernardo archipelagos and the submarine platform between these two archipelagos, with the presence of diverse ecosystems such as mangroves, seagrasses, and coral reefs (Rangel-Buitrago, 2011).
The PNNCPR is located to the west of the San Bernardo archipelago, 32 km from Punta Barú (Alonso et al., 2015; Marrugo-Pascuales and Martínez-Ledesma, 2016). It is a geomorphological unit characterized by a mesophotic environment with high water transparency, which differs highly from other mesophotic coral reefs in the Caribbean and other reef areas formally described for Colombia (Alonso et al., 2015; Morales-Giraldo et al., 2017) (Figure 1). The abundance of the species Madracis myriaster and the high diversity of invertebrates associated with this species of coral stand out (Alonso et al., 2015).
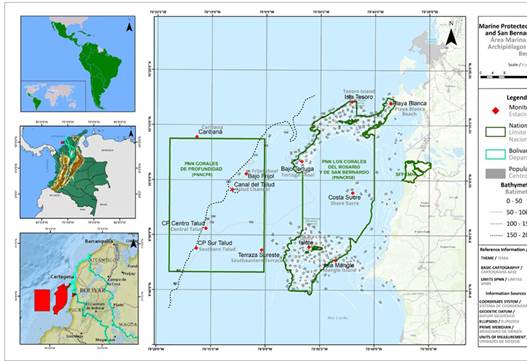
Figure 1 Map of the study area showing all sampling stations. The green area on the left represents PNNCPR (offshore stations), and the green area in the center represents PNNCRSB (nearshore stations) within the MPA of the Rosario and San Bernardo Archipelagos. Map created by PNN.
From the oceanographic point of view the areas are influenced by the Caribbean Current, the Panama Countercurrent, the Panama-Colombia Cyclonic Gyre, and the Guajira upwelling system, which modulate the climatology throughout the year (Lozano Duque et al., 2010). Similarly, there is a current generated by fresh waters, heavily laden with sediments that leave the Dique Channel through the Lequerica and Matunilla Canals, which reach Barbacoas Bay and, depending on the time of year, may reach the PNNCRSB (Lozano-Duque et al., 2010). The fluvial contribution of the Sinú River and the Pechelín Creek, among others, create freshwater masses that play a significant role in the conformation of the hydrological and hydrodynamic fields of the area (Giraldo et al., 2009).
Sample Collection
Two sampling campaigns were carried out March, 2022, dry season, and 3-7 October 2022, rainy season. One surface water and one subsurface water tows were performed of the twelve sites in the MPA, six of which were in PNNCRSB and corresponding to nearshore stations, and six in PNNCPR corresponding to offshore stations (Figura 1). GPS coordinates were recorded at the start and end of each tows. Surface water horizontal tows were undertaken using a Manta net 65 cm wide and 30 cm high, with a 300 µm mesh with a cod end and flow meter, General Oceanic flowmeter (Model No. 2030R) attached to the net enabling an accurate calculation of the volume of water sampled during with a 30-minute run parallel to the coastline at a speed of 5.5 km/h. Viršek et al. (2016), . For subsurface water, oblique tows were undertaken using a Mini-Bongo Net 30 cm diameter, with 200 and 500 µm meshes with cod end and flow meter, Hydrobios flowmeter (Model No. 438115) run stop attached at the mouth of the 200 µm mesh to calculate the volume of filtered water during 2-10 min, with a boat speed of 0.9-2.7 km/hr. Following each trawl, seawater was used to concentrate the sample to the cod end, which was subsequently removed, and contents were poured into a 500 ml glass bottle pre-rinsed with seawater. The surface water samples were fixed in 70% ethanol and subsurface water samples were fixed in 4% buffered formaldehyde, preparing samples for transport back to the laboratory.
Laboratory Analysis
Isolation and physical microplastics identification
Glassware and metalware were used throughout the process to avoid cross-contamination. Each sample was divided into two fractions using a Motoda chamber. The first fraction was stored in the hydrobiological collection of the Universidad Industrial de Santander (Bucaramanga, Colombia), while the second fraction was used for the isolation and physical characterization of the putative microplastics. Each sample was analyzed by transferring small amounts of it into a glass Petri dish, until processing the entire sample following the protocol of Viršek et al. (2016). Plastic particles were later sorted and classified according to their color and shape characteristics and measured using a Zeiss Discovery V12 stereoscope with an AxioCam ERc5s Zeiss coupled camera (20-80x zoom). Samples were stored in slide glass for further processing.
Particle characteristics/FTIR analysis
After visual identification, all microplastic particles (≥ 15 μm) were identified by Thermo Scientific Nicolet iS50 ATR-FTIR WI, USA Fourier transform infrared spectroscopy. The spectrum ranged from 4000 - 500 cm-1 (mid-infrared MIR) equipped with diamond crystal for attenuated total internal reflection (ATR) (one step and refractive index 2.4). The repeatability was determined by calculating the standard deviation for the absorbances measured at wave numbers 2924 cm-1 and 1462 cm-1 in 10 spectra acquired on a sample. For the recording of each spectrum, 128 scans were performed, with a moving mirror speed of 0.4 cm/s and a spectral resolution of 4cm-1. These parameters achieved an average signal-to-noise ratio of 27.4 (arbitrary units). Before saving the spectra, a baseline correction was performed with OMNIC software and normalization of the area under the spectral curve.
Quality assurance and quality control
All containers, including glass Petri dishes, steel conical bottles and glass plates, were washed at least three times with Milli-Q water before use to avoid atmospheric MP pollution. A stereomicroscope for visual classification was placed on a glass Petry, and both hands entered from the operating hole during microscopy. Procedural blanks were collected and treated synchronously with the field samples to correct for and evaluate background pollution. Procedural blanks for seawater samples were obtained by replacing seawater with Milli-Q water. The abundance of microplastics in seawater was corrected for procedural blanks. Nitrile gloves and cotton lab coats were worn during the sampling and experimental processes.
Statistical analysis
To analyze the basic variables (minimum, maximum, median, and mean) and their proportionality, descriptive statistics were used for the putative microplastics characteristics (shape, color, and size). To determine the separate effect of the stations (nearshore/offshore), season (rainy/dry) and trawls (surface water/ subsurface water) on putative microplastics concentration a Kruskal-Wallis analysis was performed after verifying the assumptions of normality and homoscedasticity of the data, using the Shapiro-Wilk test (Shapiro and Wilk, 1965). Additionally, the Dunn post hoc test (Dinno, 2015) was applied to compare the medians of the data groups. Statistical analyses were performed in the R version (R Core Team, 2024). All tests were performed with a 95% confidence level.
To reduce the number of samples analyzed with ATR-FTIR (2345 samples), a clustering model was developed. A principal component analysis (PCA) was performed using the NIPALS (Nonlinear Iterative Partial Least Squares) algorithm (Otto, 2007). After the PCA analysis and given the large number of microplastics found in the sampling process, a clustering model was developed using the k-means strategy that allows for obtaining an average spectrum per cluster, thus reducing the number of final spectra compared with the databases. The silhouette value validated the number of clusters and their conformation.
RESULTS
Physical microplastics identification
Across the twelve sites, a total of 2,345 microplastic particles were isolated, of which 97.9% were confirmed as microplastics, and 2.1% as natural or aragonite particles. In marine trawls, the median microplastic concentration in surface water was 0.022 items/m³, ranging from 0.002 to 0.251 items/m³, whereas in subsurface water, the median concentration was 0.089 items/m³, with values ranging from 0 to 7.466 items/m³. A significant difference was observed (Kruskal-Wallis test, p < 0.001), with the highest abundance of microplastics found in subsurface water samples.
Regarding seasonal variation, the median microplastic concentration during the dry season was 0.050 items/m³, ranging from 0.002 to 2.136 items/m³, while during the rainy season, the median increased to 0.083 items/m³, ranging from 0.000 to 7.466 items/m³. A significant difference was observed (Kruskal-Wallis test, p < 0.001), with the highest abundance of microplastics recorded during the rainy season (Figure 2).
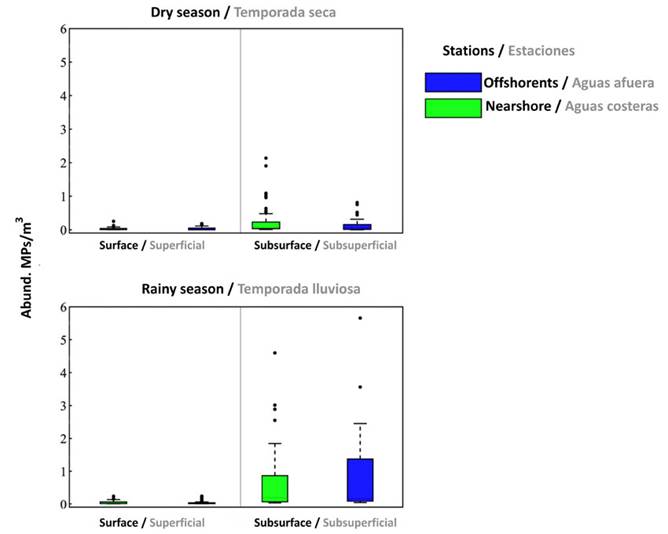
Figure 2 Boxplot of microplastic particle abundance at offshore and nearshore stations, for surface and subsurface waters, during the dry and rainy seasons in the MPA of the Rosario and San Bernardo Archipelagos.
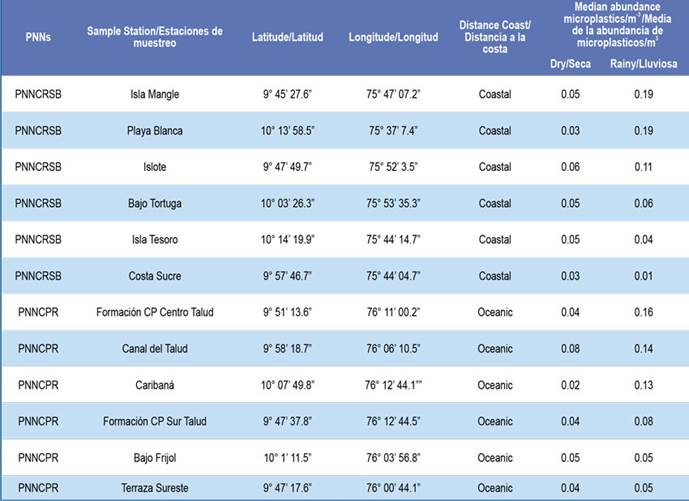
For spatial distribution, the median microplastic concentration at nearshore stations was 0.058 items/m³ (range: 0.002-7.466 items/m³), while at offshore stations, the median was 0.055 items/m³ (range: 0-135.657 items/m³). No significant differences were found between nearshore and offshore stations. The ranking of median microplastic concentrations at nearshore stations, from highest to lowest, was: Playa Blanca > Islote > Isla Mangle > Isla Tesoro > Bajo Tortuga > Costa Sucre. For offshore stations, the ranking was: Canal del Talud > CP Centro Talud > CP Sur Talud > Terraza Sureste > Caribaná > Bajo Frijol (Table 1).
Physical characterization
Five distinct morphological forms of microplastics were identified and quantified: fibers (92.65%), fragments (7.13%), films (0.17%), foams (0.04%), and pellets (0.02%). The pellet morphology was exclusively found at the Playa Blanca station during the rainy season, while foam particles were also detected during the rainy season at two stations, Isla Tesoro and CP Sur Talud stations.
In marine trawls, the median length of microplastics in surface water was 1780.8 µm, while in subsurface trawls it was 1276.8 µm. A significant difference was observed (Kruskal-Wallis test, p < 0.001), with larger microplastics found at the surface. Regarding seasonal variation, the median length of microplastics during the dry season was 1386.4 µm, while during the rainy season it was 1552.1 µm. A significant difference was observed (Kruskal-Wallis test, p < 0.001), with larger microplastics found during the rainy season. In terms of spatial distribution, the median length of microplastics at nearshore stations was 1478.3 µm, while at offshore stations it was 1398.2 µm. No significant differences were found between nearshore and offshore stations (Figure 3)
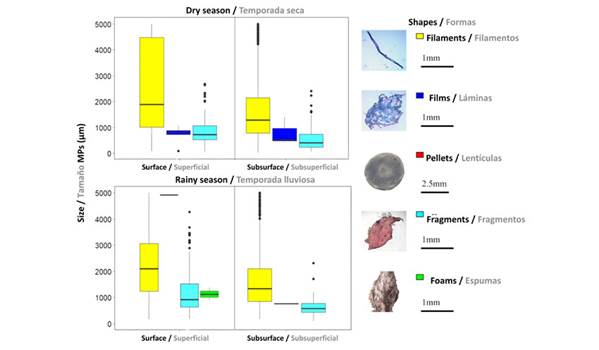
Figure 3 Microplastic distribution during the dry and rainy seasons, categorized by mesh size of depth used (surface, subsurface) and by particle shape: fiber, film, pellet, fragment, and foam.
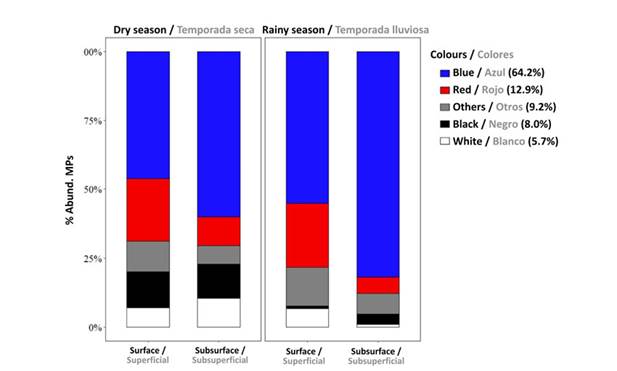
Respecting the color, blue showed the highest relative abundance (64.2%), followed by red (12.9%), other colors (9.2%), including purple, fuchsia, and green, black (8.0%), and white (5.7%). Across all trawls, the abundance of every color was higher at the surface than in the water column, with significant differences (Kruskal-Wallis test, p <0.001). In terms of seasonal variation, a greater abundance of blue and other colors was observed during the rainy season compared to the dry season, with significant differences (Kruskal-Wallis test, p <0.001). For spatial distribution, no significant differences were found in color abundance between nearshore and offshore stations (Figure 4).
Particle characteristics/FTIR analysis
A total of 2,345 putative microplastics were analyzed from marine trawls: 1,191 from surface samples and 1,154 from subsurface samples. Seasonally, 844 putative microplastics were collected during the dry season, and 1,501 during the rainy season. Spatially, 1,345 putative microplastics were found in nearshore areas and 1,000 in offshore areas. Following the exclusion of 49 items (2,1%) of natural origin (identified as calcium carbonate-aragonite), 2,296 particles (97,9%) were confirmed as plastic, effectively corresponding to microplastics.
Principal component analysis (PCA) was performed separately by season due to the higher variability observed in the data. Seven principal components were identified, explaining 89.44% of the variance for the dry season and 90.96% for the rainy season (see Graph S1). After obtaining the spectra (eigenvectors) in the principal component space, k-means clustering was applied. The Dunn Index (Zhou, 2021) and Silhouette Value (Lenssen and Schubert, 2022) were used to determine the optimal number of clusters. The best clustering was obtained with five clusters: Dunn Index = 0.94 (dry season) and 1.02 (rainy season). The silhouette profiles are shown in Figure 5.
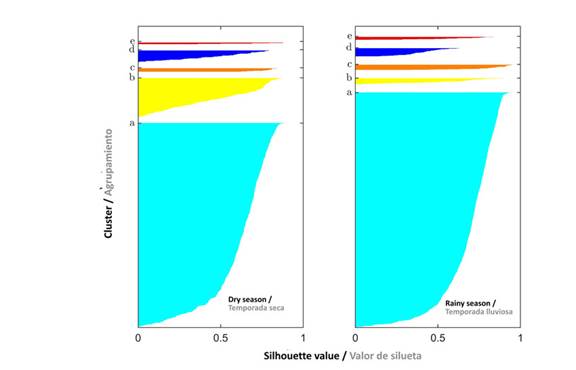
Figure 5 Silhouette values for the clusters suggested by the model, corresponding to the average absorbance spectra shown in Table 2 (a-e).
Each cluster was represented by an average spectrum (Figures 6a-6e ), compared with the KnowItAll database (Bio-Rad/Wiley). In some cases, spectra reflected polymer mixtures, indicating microplastics composed of multiple polymer types. Although the spectra were not obtained from pristine polymers, polymer types were identified using the High-Quality Index (HQI), yielding four main categories: Cluster a: 2:1 cotton-polyester, Cluster b: Polyethylene terephthalate (PET), Cluster c: Calcium carbonate-aragonite (natural origin), Cluster d: Polyethylene, Cluster e: mixture of polypropylene, polyethylene, polyacrylic acid. Table 2 summarizes these classifications. The distribution of microplastics by season, sampling station, and net type is detailed in Supplementary Table S2.
Table 2 Comparison of average spectra obtained through the k-means method (k = 5) with the KnowItAll polymer database
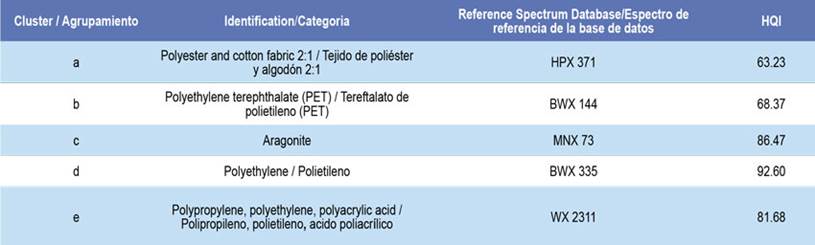
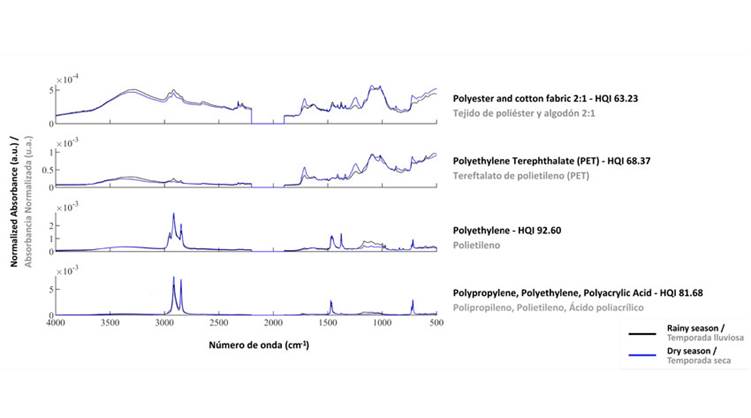
Figure 6 Average ATR-FTIR spectra of microplastics derived using the k-means method. A High-Quality Index (HQI) > 60 was accepted as a polymer match.
In marine trawls, 49.8% of microplastic spectra came from surface samples. Among them, polyester-cotton (75.2%) was predominant, followed by PET (14.3%), polyethylene (7.6%), and a polymer mixture of polypropylene, polyethylene, and polyacrylic acid (2.9%). Subsurface trawls accounted for 50.2% of the spectra, with polyester-cotton (92.9%) as the most abundant, followed by PET (4.2%), polyethylene (2.8%), and the already mentioned polymer mixture (0.2%).
By season, 36.1% of spectra were obtained during the dry season, where polyester-cotton (74.8%) was most common, followed by PET (18.1%), polyethylene (6.0%), and the polymer mixture (1.1%). In the rainy season (63.9%), polyester-cotton (89.4%) dominated, with smaller proportions of PET (4.2%), polyethylene (4.7%), and the mixture (1.8%).
At nearshore stations (57% of the spectra), polyester-cotton (81.4%) was the most frequent polymer, followed by PET (10.2%), polyethylene (6.3%), and the polymer mixture (2.1%). Offshore stations (43%) showed polyester-cotton (87.7%) as predominant, followed by PET (7.9%), polyethylene (3.6%), and the mixture (0.8%).
DISCUSSION
This study highlights significant microplastic pollution in a Marine Protected Area located in the Rosario and San Bernardo Archipelagos, in the southwestern Caribbean. The microplastics are mainly characterized by blue fibers, which are larger at the surface than in the subsurface. The fibers correspond to polyester-cotton, that are a common type of microplastic derived from clothing manufacturing and from tools such as fishing nets, ropes, and lines (Gago et al., 2018). Currently, the majority of textile products are made from polyester fibers (approximately 70%) and cellulosic fibers (approximately 20%). Therefore, most research on fiber fragment release has focused on these two types (Periyasamy and Tehrani-Bagha, 2022). Although polyester is a plastic with a higher density than water, when blended with cotton it becomes more hydrophobic and tends to remain on the surface for longer periods (Béraud et al., 2022).
Microplastic distribution shows significant differences in abundance between depths, as well as between seasons. However, no heterogeneity was observed between station distributions. This pattern is likely influenced by Caribbean Sea currents and the proximity of anthropogenic activities, as seen in other areas in Caribbean Colombian coast (Garcés-Ordóñez et al., 2022).
The Panama-Colombia countercurrent actively transports sediments and potentially other non-nutrient materials, particularly affecting areas outside the offshore MPA (PNNCPR). This gyre flows counterclockwise along the southern coastal zone of the Colombian Caribbean and Central America, intensifying during the dry season and forming cyclonic and anticyclonic gyres (Andrade et al., 2001; Lozano-Duque et al., 2010; Criales-Hernández et al., 2021). These dynamics were particularly evident at the Canal del Talud offshore station, which recorded the highest microplastic abundance during the dry season.
During the rainy season, the Magdalena River, one of the world’s most plastic-polluted streams, discharges large volumes of sediment and waste via the Canal del Dique, affecting nearshore zones (Lebreton et al., 2017). This sediment plume has been documented to affect nearby areas (Mejía-Echeverry et al., 2018), particularly the nearshore stations like Playa Blanca and Isla Mangle. Seasonal flow variations, linked to hydroclimatic cycles, also contribute to coral degradation and pollutant dispersion (Restrepo et al., 2016; Zarza-González, 2011; Restrepo et al., 2016; Mejía-Echeverry et al., 2018; Vargas, 2021;). Additionally, chronic anthropogenic pressures such as untreated sewage, industrial runoff, poor waste management, and mass tourism further degrade the MPA year-round (Löhr et al., 2017; Orona-Návar et al., 2022).
The abundance of microplastic particles recorded in the Rosario and San Bernardo Archipelagos are within the range reported for other areas of the Colombian Caribbean, where values range from 0.01 to 8.96 items/m³ in coastal zones (Garcés-Ordóñez et al., 2021). In Colombia, most records have focused on estuarine environments; for example, Cispatá Bay shows abundances ranging from 13 to 123 items/m³ (Garces-Ordóñez et al., 2022), while the Ciénaga Grande de Santa Marta reports values between 0 and 300 items/m³ (Garcés-Ordóñez et al., 2022). In the Seaflower Biosphere Reserve, specifically near Albuquerque Island, concentrations between 0.009 and 0.244 items/m³ have been documented (Portz et al., 2020). Our results showed substantial differences in the abundance of microplastics in the ocean surface layer (0-5 m depth). However, the values obtained remain well below the unacceptable ecotoxicity levels proposed for marine organisms, with a median Predicted No-Effect Concentration (PNEC) of 1.21 × 10⁵ MP m-³ (95% CI: 7.99 × 10³ MP m-³ - 1.49 × 10⁶ MP m-³) (Everaert et al., 2020).
In other parts of the Caribbean, higher surface water microplastic abundances than those reported in this study have been recorded. For instance, around San Blas Island (Panama), values range from 0.1 to 5.09 items/m³, with an average of 1.56 ± 2.36 items/m³ (Courtene-Jones et al., 2021). Although the highest value found in the studied MPA (7.46 items/m³) exceeds the San Blas maximum, its average (0.264 ± 0.698 items/m³) is considerably lower. Other Caribbean sites show lower abundances overall: Bonaire (0.05-0.1), Aruba (0.12-0.2), and Antigua and Barbuda (0-0.5 items/m³) (Courtene-Jones et al., 2021). In contrast, the Gulf of Mexico reports much higher levels (4.8-18.4 items/m³), largely influenced by Mississippi River discharges (Di Mauro et al., 2017). However, recent studies suggest that plankton nets may underestimate plastic concentrations (Nunes et al., 2023). Globally, MPAs generally exhibit better environmental conditions with respect to microplastic pollution, as observed in the site studied here, even considering the values reported in surface and subsurface waters. A relevant finding of this study was the higher abundance of microplastic particles in subsurface waters compared to surface waters. This pattern may increase the risk of ingestion by marine organisms with varying feeding strategies (Cole et al., 2011; Timilsina et al., 2023; Iwalaye and Maldonado, 2024). In particular, primary consumers such as zooplankton are known to ingest microplastics, which can lead to physiological, systemic, and embryological damage. This poses a potential threat to a critical link in the food chain, with significant implications for the stability of food webs and carbon cycling in marine ecosystems (Botterell et al,. 2020; He et al., 2022).
Of the four chemically identified microplastic clusters, the largest corresponded to a polyester and cotton (2:1). This aligns with previous studies attributing such fibers to garment washing processes (Periyasamy and Tehrani-Bagha, 2022). The second most common polymer, polyethylene terephthalate (PET), may result from the fragmentation of common plastic items, including boat paint (Li et al., 2020: Garcés-Ordóñez et al., 2022). PET often contains plasticizers such as dioctyl phthalate (DOP), a compound also found in polymers like PVC (Valton, 2014).
These plastic additives can adsorb organic pollutants, such as polycyclic aromatic hydrocarbons (PAHs), polychlorinated biphenyls (PCBs), and polybrominated diphenyl ethers (PBDEs), as well as heavy metals (e.g., Cd, Zn, Cu) and pathogens, significantly increasing their toxicological risk to marine organisms and potentially humans (Acosta-Coley et al., 2019; Zhao et al., 2020; Yee et al., 2021).
The remaining clusters were polypropylene and polyethylene, likely linked to industrial activities in the Bay of Cartagena, including food processing, plastic manufacturing, oil refining, and pharmaceuticals (Garcés-Ordóñez et al., 2022; Romero-Murillo et al., 2023). These polymers are consistent with those previously reported in other areas of the Caribbean and the Colombian Pacific (Garcés-Ordóñez et al., 2021).
Understanding microplastic pollution levels across different regions is essential for informed environmental management. While plastic contamination has been widely acknowledged as a global issue, the Caribbean region still lacks sufficient scientific data to inform the development of effective governmental policies and strategies aimed at reducing plastic waste discharged into river basins and subsequently transported across the Greater Caribbean (Clayton et al., 2021). The data presented in this study underscore the pressing need for systematic monitoring and mitigation of microplastic impacts on marine ecosystems, in order to safeguard both vulnerable species and the critical ecosystem services provided by Marine Protected Areas (MPAs).
CONCLUSIONS
This study offers an integral diagnosis of the presence, characteristics, and spatial distribution of microplastics in a Marine Protected Area (MPA) of the southwestern Caribbean. The abundance of microplastics recorded in the Rosario and San Bernardo Archipelagos is comparatively lower than that reported in other parts of the Caribbean and in MPAs globally. Fibers and fragments were the most common shape found, primarily composed of polyester-cotton (2:1), PET, polypropylene, and polyethylene.
Our findings demonstrate that the oceanographic dynamics of the Caribbean Sea play a determining role in the transport and dispersion of microplastics. The rainy season exhibited higher microplastic concentrations, strongly influenced by freshwater and sediment discharges from the Magdalena River. Conversely, the dry season was characterized by higher abundances associated with the Panama-Colombia cyclonic gyre and riverine inputs along the Colombian Caribbean coast. Notably, the highest concentrations were found in subsurface waters, which may enhance bioavailability and increase the risk of ingestion by marine organisms, a key component in trophic dynamics and carbon cycling.
The application of k-means clustering combined with PCA of ATR-FTIR spectra proved effective for classifying potential microplastic types. The Silhouette coefficient and Dunn’s index confirmed both the quantity and quality of the resulting clusters, while the method’s computational simplicity and convergence make it a practical tool for future large-scale analyses.
We conclude that microplastic pollution does not currently pose an environmental risk in the surface and subsurface layers in the MPA. Continued monitoring is instrumental to identify marine regions that may require increased attention for mitigation measures. The Caribbean region, still lacking sufficient baseline data, would greatly benefit from the implementation of public policies focused on improving waste management, regulating industrial discharges, and fostering environmental education to reduce the input of plastic waste into coastal and marine ecosystems.

