




 English (pdf)
 Article in xml format
 Article references
 Automatic translation
 Send this article by e-mail
 Cited by SciELO
  Cited by Google
  Similars in
SciELO
Similars in
SciELO  Similars in Google
 Permalink
1. Introduction
Construction projects are increasingly complex, and this situation has generated different alternatives that promote an integrated project management approach that takes all interested parties into consideration. One of the alternatives that has spread with great force in the past decade is the BIM methodology or “Building Information Modeling”, which consists of the generation and management of data for a project (usually a building project) during its life cycle (Bryde et al., 2013). The adequate implementation of BIM can have a positive impact on the profitability of a project and on the compliance with specifications (Xu et al., 2014). A BIM model is the digital representation of the components of a construction project generated by creating associated graphs, data attributes, and parametric rules that promote the integrated work of all involved professionals. This diminishes incompatibilities in the design, generating value in the construction projects. Advantages such as an improved calculation of the labor amounts, optimization of the implementation programming, and diminished administration costs associated with the project and contingencies are evident (Barlish & Sullivan, 2012; Cao et al., 2015). These models initially include three dimensions that represent the proposed project in a digital model, to which the necessary dimensions can be added according to the planned analysis of the building project. These dimensions include cost and timing of the project, analysis of sustainability, construction operations, analysis of comfort, and lighting among others. This provides a clear, detailed and concise perception of the building project during the planning and construction stages (Love et al., 2014).
Another challenge faced by the construction sector in recent years is how to minimize the environmental impact of its activities. According to the Intergovernmental Panel on Climate Change (IPCC) established by the UN, there is unequivocal evidence that the world’s buildings account for 32% of the global energy consumption and 19% of greenhouse gas emissions. According to projections, the energy consumption of buildings at a worldwide level could be duplicated or even triplicated by the year 2050. This report also revealed that the immediate application of surveillance rules both for new and remodeled buildings would attenuate the existing risk. The main mitigation strategies address the efficiency of carbon, the energy efficiency of the technology, the system and infrastructure efficiency, and a reduction of the demand for services through the implementation of behavioral and lifestyle changes. (Intergovernmental Panel on Climate Change (IPCC), 2014). These two challenges should not be addressed in a separate manner, as an adequate management and the integration of the parties involved in the construction projects will generate interesting future impacts. BIM is a powerful tool for dynamic decision making during the entire life cycle of projects and has become an avant-guard trend regarding the concept of integration of projects known as Integrated Project Delivery or IPD (Kent & Becerik-Gerber, 2010), enabling and improving collaboration and communication among the parties involved in a project. This leads to the generation of more efficient designs as a result of the cooperation between the different interested parties (Tenget al., 2012; Baiden & Price, 2011). In addition, several companies consider the IPD concept as the most efficient method to integrate BIM as a design tool to determine the performance of buildings in terms of sustainability (Bynum et al., 2013; Jones, 2014).
The sustainability dimension of the BIM model includes different aspects, such as the analysis of indoor thermal comfort, the simulation of energy costs such as those associated with lighting, the simulation of sources of renewable energy, and the determination of the carbon footprint among others. These novel trends for the application of BIM methodology to the analysis of sustainability have been termed GREEN BIM (Azhar et al., 2011; Wong & Zhou, 2015; Sadeghifam et al., 2015). Previous studies report that construction companies use BIM methodology with the support of specialized software for the analysis of sustainability, with the aim to reduce the environmental impact of the construction sector, and in many cases, this has become a prerequisite of the projects on the part of the client (Hwang & Ng, 2013; Zuo & Zhao, 2014; Wong & Zhou, 2015). At a global scale, there is definitely a need to invest in environmentally sustainable designs to reduce the potential progression of global warming (Hertwich & Peters, 2009). Another recent study highlights the importance of considering the carbon footprint when choosing a system for the construction of buildings. Five construction systems were compared by estimating the carbon footprint of each one and by considering the emissions during the extraction and transport of materials, the construction, operation, and end of the life of the building using a computational method. The results showed significant differences among the different designs, justifying the importance of considering the carbon footprint as a variable in the selection of a construction system (Moussavi-Nadoushani & Akbarnezhad, 2015).
In Colombia, this trend has not been foreign to the construction sector, and projects are currently applying for international sustainability certification systems. Additionally, Colombia is the fourth country in Latin America with the largest number of registered projects to achieve Leadership in Energy & Environmental Design (LEED) certification, a system proposed by the US GREEN BUILDING COUNCIL (USGBC) for the certification of buildings (USGBC, 2016). The present study is a case analysis of sustainability of a building using BIM methodology, with the support of software tools for the analysis of the applicability of this methodology in the country. The limitations, advantages and disadvantages of the proposed tools and the results achieved are described. The research focused on determining the performance in terms of sustainability, considering the Global Warming Potential (GWP) index, which corresponds to an estimation of the equivalent kilograms of CO2, as the main indicator of the environmental impact of buildings. This analysis considered global warming as the main challenge faced by society (Ortiz et al., 2009) and that at a global scale, there is a need to invest in reducing the GWP associated with construction (Bynum et al., 2013). In this way, it was possible to determine the consumption of electrical energy, the carbon footprint of materials, and the total energy associated with the project under the original design and by analyzing alternative designs.
2. Methodology
The project was designed for a building in the city of Bogotá D.C. that consists of nine floors and a basement in a total building area of 11 400 m2 and a lot of 1100 m2. According to the information provided, this building is intended for use mainly as office space. The foundation of the building consists of several deep foundation piles constructed by manually digging caissons using an inverted cone ring system, embedded at a depth of 8 to 14 meters. The caissons are connected by grade beams. Additionally, there is a containment system consisting of conventional walls in 30 cm thick reinforced concrete with a height of 4 to 7 meters. The structure of the building is based on reinforced concrete and a metallic structure, with glass façades and floating façades with a sandwich-type cover. The interior consists of rooms separated by walls of concrete masonry, although there are also glass and prefabricated walls to a lesser extent. A BIM model of the building was generated initially, followed by an analysis of the energy consumption and carbon footprint.
2.1 BIM model
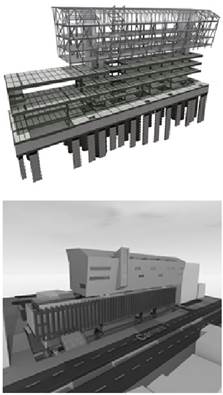
The BIM model was developed using the ArchiCAD 18 software based on previous information on the architectural and structural plans of the building. This provided information on the stairs, façades, the type of metallic structure, and the types of doors and windows among others. An image of the model is presented in Figure 1.
When the architectural modeling was finished and linked to the structural model, several inconsistencies between the two designs were identified, especially at a higher level, where the structure is metallic. Although the analysis and reporting of these inconsistencies was not included in the planned work, as an additional experience, this information was shared with the persons in charge of the construction, which provided feedback on the construction process of the work underway. This is one of the advantages of the early implementation of the BIM model during the design integration phase.
Additionally, information was collected on lighting and the mechanical ventilation and air conditioning systems that were considered for this building. For the lighting, the values used as design parameters were derived from the technical design of the lighting system to be installed, such as potency, useful life, color temperature, luminosity (lumens), and reference values. These are the basic criteria that were used as a starting point to search for design alternatives.
In this model, the types of material used and budgeted in the construction of the building were considered, and the database was consolidated with the physical properties required by the ArchiCAD program, which are as follows:
Thermal conductivity: this refers to the amount/velocity of the heat transmitted by a material. Units of measurement: W/mK (watts per Kelvin meter).
Density: Mass per unit of volume. Unit of measurement: Kg/m3.
Incorporated energy: “The sum of all primary energy consumed in the fabrication and supply of products, including extraction, processing and refining, transport, production, packaging and shipping to the destination in immediate use conditions without the need for further manipulation”. Unit of measurement: J/Kg K (Joule per kilogram Kelvin).
Incorporated carbon: defined as “the total amount of carbon dioxide emission or that of equivalent gases associated with the energy incorporated into a product”. Unit of measurement: KgCO2/Kg.
Thermal transmittance or U value: This is one of the most important physical properties that defines environmental design. It corresponds to the measurement of the heat that flows per unit of time and surface through an element of construction. According to the type of material, the covering structure and the thickness, a greater or lesser thermal bridge is generated. The U value represents the speed of the transfer of heat, with a greater thickness and smaller thermal conductivity generating a lower thermal flow. Unit of measurement: W/m2 K (watt per square meter Kelvin).
It is important to clarify that information on incorporated energy and carbon was not found in either the project documents or the technical specifications provided by the suppliers or under consultation with the latter; therefore, the default values included by ArchiCAD in its library of materials, which are derived from international research, were used.
2.2 BEM model
The term Building Energy Model or BEM refers to a simulation tool for the calculation of thermal charge and energy utilization for residential and commercial buildings. These models are normally used in the design of new buildings and in the renovation of existing buildings with the objective of predicting the use of energy based on the architecture and ventilation systems, heating, and air conditioning. This type of model has existed since the 80s and has been further developed to become more detailed and precise. Therefore, current programs have the capacity to perform simulations taking into consideration the construction materials in combination with ventilation, heating and air conditioning systems. In addition, it is possible to model methods for energy conservation, such as the use of renewable energy (Ryan & Sanquist, 2012).
2.2.1 Surrounding definitions
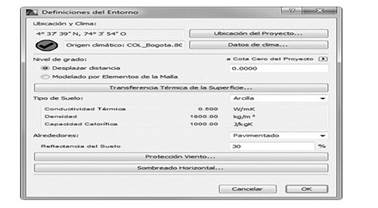
To generate the BEM model, the project was first georeferenced using Google Earth (.kmz), with the coordinates latitude, longitude, and elevation (Figure 2).
2.2.2 Weather data
The Ecodesigner STAR® platform, which was used for the sustainability analysis, automatically included general weather data for the city of Bogotá imported from ASHRAE IWEC (International Weather for Energy Calculation). These data were provided by EERE (Energy Efficiency & Renewable Energy) of the United States Department of Energy.
2.2.3 Definition of thermal block
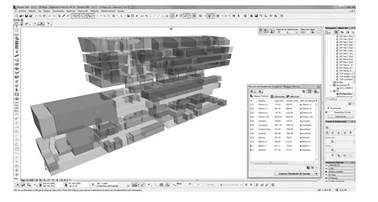
A thermal block for the Ecodesigner STAR® platform is the collection of zones (spaces) that have similar energy demands, human load, and usage. These spaces are included in the three dimensional model, with the tool “Zone” representing the air contained in the interior of the structure that is in contact with architectural elements such as walls, doors, and windows among others. Each thermal block is assigned independent energy demand and usage parameters; for the building analyzed, a total of 152 zones were defined that were contained in 12 previously proposed thermal blocks. The generation of zones is illustrated in Figure 3.
2.2.4 Definition of operation profiles
Operation profiles determine the type of usage of the thermal block as well as the thermal demands and human load. Then, the hours of usage or operation for each zone are introduced into the daily schedule. In the first place, the range of dates of operation of the thermal blocks was defined according to their usage. This information allows calculation of the thermal gain per person, which refers to the amount of energy emitted by the persons in the interior of the building. This value varies according to the physical activity level of the individuals included and ranges from approximately 72 to 990 Watts per person. The internal thermal gain due to lighting can also be calculated, which refers to the potency of the lighting system assigned to each thermal block. The initial potency values were obtained from the current design of the building, and lastly the thermal gain due to equipment is added, which consists of the total energy expenditure of computers and other electrical devices per unit of area. Table 1 shows the entry data corresponding to the initial design.
Table 1 Internal heat gain of the operation profiles for the different thermal blocks used.
| Thermal Block | Human Heat Gain (W/m2) | Lighting Data (W/m2) | Equipment Data (W/m2) |
| Auditoriums | 22.84 | 7.57 | 3.72 |
| Bathrooms x 1 | 39.99 | 7.46 | 2.00 |
| Bathrooms x 5 | 41.92 | 9.98 | 2.00 |
| Dining Hall | 53.24 | 8.20 | 30.45 |
| Hallways | 24.77 | 6.75 | 2.00 |
| Storage Area | 24.89 | 4.45 | 2.00 |
| Offices + 20 | 31.00 | 11.65 | 36.49 |
| Offices x 3 | 31.68 | 12.33 | 25.34 |
| Offices x 5 | 29.47 | 10.58 | 25.91 |
| Offices x 9 | 25.92 | 12.20 | 32.77 |
| Halls | 59.24 | 10.10 | 9.44 |
2.2.5 Definition of construction systems - Ventilation and refrigeration
Later, construction systems associated with the ventilation and refrigeration equipment of the building were taken into account. Information was collected on the mechanical ventilation and air conditioning systems included in the design. Regarding the specifications of the mechanical ventilation system used in the design of the building, information on flow and external pressure of the building were mainly included in the mechanical ventilation data. Data on flow or air volume, capacity of the equipment, and external static pressure were considered for the refrigeration system.
2.2.6 Factors affecting the origin and cost of electrical energy
The Ecodesigner STAR® platform enables the entry of factors as percentages according to their involvement in the production of electrical energy. On the basis of these resources, the Ecodesigner STAR® platform estimates the CO2 carbon footprint emission (Kg/kWh). Despite the fact that the electrical energy in Colombia is mostly derived from hydraulic sources, the energy consumption of a building constitutes one of the main sources of carbon footprint associated with the construction of buildings.
2.2.7 Link between BIM and BEM models - Energy modeling
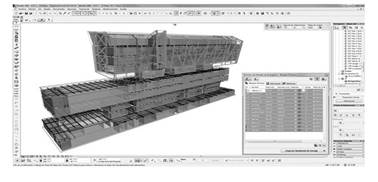
To generate a complete model that enables energy simulation, a connection must be established between the architectural parameters and the zones representing the interior air of the structure. The Ecodesigner STAR® platform recognizes the architectural elements that cover the surface of the zones as structures and/or openings that directly affect the thermal behavior of a building. Therefore, it is essential to verify that the architectural model covers the interior volumes of the structure; otherwise, the results obtained with the energy simulation are obsolete because of false air currents and unknown volumes and temperatures. Figure 4 shows the link between the BIM model and the zones representing the BEM model.
In the link between the BIM and BEM models, the program automatically calculates the U value of each element according to the previously determined thermal properties of the materials and the thickness.
2.2.8 Possible alternatives to improve the performance of a building
To perform simulations representative of alternative scenarios, the following alternatives were defined to improve the performance of the building.
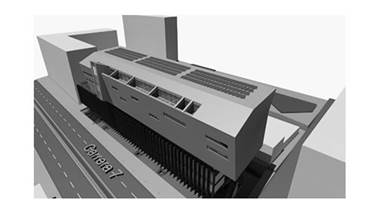
Scenario 1 - Implementation of solar panels for the supply of renewable energy: The first scenario was based on the use of the renewable energy of the building through the installation of solar panels on the shell of the building. The maximum possible number of panes was modeled, excluding the areas of circulation and maintenance of the roof. The installation of 228 solar panels was modeled with the characteristics listed in Table 2:
Table 2 Characteristics of the simulated panels.
| Type of cell of the panel | Polycrystalline |
|---|---|
| Nominal power (W) | 250 |
| Efficiency of the panel P (%) | 15.2 |
| Temperature power coefficient (% / ºC) | -0.47 |
| Panel length (m) | 1.652 |
| Panel width (m) | 0.994 |
| Total area of the panel | 1.642 |
The simulated placement of the panels is shown in Figure 5:
Scenario 2 - Lighting change: The second alternative scenario proposed a change from the fluorescent lighting system proposed in the design to LED type lighting. The modification of approximately 50% of the total lighting system was planned while maintaining the same lighting requirements of the interior of the building.
Alternative design proposal: This is the combination of the two previously mentioned scenarios.
3. Results and analysis
3.1 Temperature and thermal comfort of the building
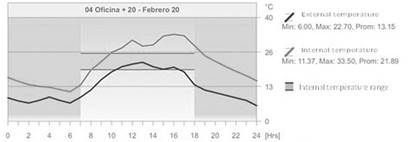
Within the architectural design, an analysis of the building temperature was not considered, which could affect the thermal comfort of the final users and the operation of the ventilation and refrigeration systems of the building. This calculation can be performed for the different zones of the building, taking into consideration the environmental conditions of the project and the thermal properties of the materials. For the case in study, in many instances the simulation resulted in a temperature that was higher than the estimated thermal comfort in a range of 20 to 26°C. Figure 6 shows an example of an analysis of the office zone.
3.2 Energy consumption and CO2 emissions
Regarding scenario 1, the savings are shown in Table 3.
Table 3 Savings generated through the use of solar panels. Own source.
| Electrical energy (kWh/a) | CO 2 emission (kg/a) | |
|---|---|---|
| Initial design | 592,698 | 106,685 |
| Solar panels | 508,646 | 91,556 |
| Savings | 14.18% | 15,129 |
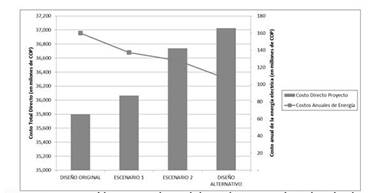
A comparison of the total direct cost of the design budget indicates that an additional investment of 1% of this value is needed to produce renewable energy through the installation of solar panels. Regarding scenario 2, the implementation of the LED design represents considerable savings on the electrical consumption as shown in Table 4:
Table 4 Savings generated through the use of LED lighting.
| Electrical energy (kWh/a) | CO 2 emission (kg/a) | |
|---|---|---|
| Initial design | 592,698 | 106,685 |
| LED lighting | 474,359 | 85,384 |
| Savings | 20.0% | 21,301 |
A comparison of the total direct cost of the original design budget indicates that an additional investment of 2.6% of this value is needed for the implementation of the changes. It is important to note that this type of lighting lasts 2 to 3 times longer than the lighting proposed in the original design. Regarding the results of scenario 3 of the alternative design, the savings are shown in Table 5:
Table 5 Savings generated through the use of LED lighting and solar panels.
| Electrical energy (kWh/a) | CO 2 emission (kg/a) | |
|---|---|---|
| Initial design | 592,698 | 106,685 |
| Alternative design | 396,084 | 71,295 |
| Savings | 33.2% | 35,390 |
A comparison of the total direct cost of the original design budget indicates that an additional investment of 3.4% of the total cost of the project is needed to implement the proposed changes. Figure 7 shows a comparison of the necessary investment for each case analyzed and the savings in terms of energy.
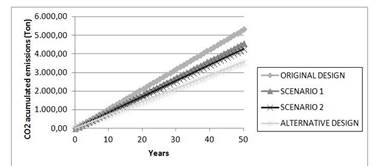
The operation of the building generates carbon dioxide emissions that are registered annually in the reports. In addition to contamination derived from usage, the building generates a carbon footprint associated with its own construction; this includes the materials used and the construction processes planned for the total development of the project. The construction area of the project occupied a total of 11,400 m2, and after distributing the contaminating load over the entire surface, the contamination associated with the building was calculated as 358.37 Kg/m2. The contaminating load per unit of construction area for the suggested alternative was 355.14 Kg/m2. The contaminating load for the alternative design could reach significantly lower values compared with that of the initial design if sufficient information is available regarding the materials used in our country. Figure 8 shows a comparative analysis of CO2 emissions for each scenario, including the original design, taking into account that these emissions are generated starting in the year in which the building becomes fully functional, which is the year 2016. This analysis is performed considering a life cycle for this building of 50 years.
To determine the feasibility of the design proposal, it is necessary to perform a projection of the cost of the energy demand of the building. For this purpose, a cash flow statement was drawn considering the parameters included in Table 6:
Table 6 Input parameters for the cash flow statement of the alternative design.
| Lifecycle of the building (years) | 50 |
| Investment for the implementation of the alternative proposal (COP) | 1,228,795,550 |
| Energy cost (COP/kWh) | 270 |
| Annual electrical energy savings (kWh) | 53,085,780 |
| Annual increase in public services (%) | 3.0% |
| Capital cost for the entity of project development (%) | 3.0% |
In this manner, variables important for the determination of the viability of the investment can be calculated, such as the present net value, the internal return rate, and the return period. Similarly, it was assumed that the income in this cash flow was the annual savings in terms of electrical energy according to the proposed alternative design. The expenditure considered for this cash flow was a value corresponding to the investment necessary for the implementation of the elements that compose the alternative design (Figure 9).
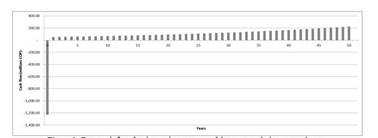
According to this cash flow, the following financial indicators were calculated for the year 2015 (Table 7):
4. Conclusions
The construction sector currently has virtual tools available that are not widely used that enable the optimization of designs to better respond to client requests and to the environmental impact generated by its activity. Digital models should be required by project developers because they add value to projects by analyzing different scenarios, the analysis of which would be complex without these models.
The present study indicated that the annual consumption of the original design of the building was 592.698 kWh/a and the CO2 emission was 106.685 Kg CO2/a. The combined alternative design, which requires an additional investment of 3.4%, was predicted to have an annual energy consumption of 396.084 kWh/a and a CO2 emission of 71.295 Kg CO2/a. This suggests a potential savings in the consumption of electrical energy of up to 33.2%.
The two proposed scenarios would also independently generate considerable savings with minimal investments. Additional investments of 0.8% and 2.6% of the budget of the original design are required to implement scenarios 1 and 2, respectively, achieving savings in the consumption of electrical energy of 14.2% and 19.97%, respectively. These percentages can be implemented if sustainability is considered as a factor from the time of conception of the project.
Under the economical terms, the construction of the building with the proposed alternative design is feasible under the financial indicators of NPV and ITR, since the NPV is greater than the additional investment costs, and the ITR is greater than the capital commitment costs.
The implementation of energy models with the tools used in this case requires special care from the start of the BIM model by defining the thermal blocks and becoming familiar with the properties of the materials to be used. In this manner, it is possible to perform an adequate and rapid BEM modeling with the objective of achieving a precise, consistent, and error free energy simulation that can provide information on the energy and thermal comfort aspects.
To improve the accuracy of the incorporated energy and carbon values for the buildings in our country it is necessary to conduct studies on these values for the construction materials used in Colombia, as these depend directly on the processes of extraction of raw matter, production, and transfer among others. In addition, to perform a more precise energy simulation, it is necessary to have the Total Solar Transmission (TST, %) and Direct Solar Transmission (DST, %) values for the window system used.
An important advantage of the Ecodesigner STAR platform is the generation of comparative reports addressing the energy simulations in comparison with a basic line. This allows an analysis of the type “What if”. In addition, it allows the combination of different scenarios in a virtual surrounding that imitates reality, and it permits consideration of additional data that may aid decision making to achieve the construction of sustainable buildings that can respond to the specific needs of the environment while minimizing the carbon footprint.

