




 English (pdf)
 Article in xml format
 Article references

 Automatic translation
 Send this article by e-mail
 Cited by SciELO
 Cited by Google
 Similars in
SciELO
 Similars in Google

 Permalink

1. Introduction
In many Latin-American countries, especially in Colombia, several problems have been related to the management and treatment of water resources due to the significant increase in its demand as society resource. One part of the problem is the inability of the treatment plants to remove 100% of emerging contaminants in sewage, such as personal care and health care products, besides various drugs, among others. Henríquez 1 said that although the concentrations of these contaminants are relatively low, they are constantly joining water sources due to their high consumption and its excretion, for this reason there is a high probability of causing adverse effects on human health and the aquatic ecosystem. According to OMS the presence of pharmaceuticals in drinking water are due to being introduced into water bodies due to high consumption of drugs that are excreted almost unchanged by the body; which are not found in high concentrations, but with prolonged exposure, can present potential health risks 2.
For contaminants removal present in wastewater, different techniques have been used such as coagulation-flocculation, chemical precipitation, sedimentation, and ion exchange; but when treating large volumes with low concentrations of pollutants, these processes reflect high costs and often become inefficient. Because of this, technologies such as adsorption have come up, which consists in retention of ion atoms or molecules in the biomass surface 3. Recently, researches have been done about possible high potential residual biomasses for being used in the process of removing pollutants after their subsequent conversion into activated carbon, within which we find fungi and sawdust 4-6.
Subha & Namasivayan studied the adsorption of 2,4-Dichlorophenol with activated carbons synthetized from coconut fiber chemically modified with ZnCl2, obtaining a maximum amount removed of this pollutant 131.6 mg/g, showing the viability of the material as an adsorbent 7. Meanwhile, Adebayo & Ribas used cocoa shell to compare the performance of activated carbons synthesized by them activated with HCL with commercial activated carbons. Adsorption tests were carried out in solution with presence of Reactive Violet 5 dye (RV-5), founding that the amounts adsorbed by the commercial activated carbon were lower than the ones from activated carbon prepared 8.
Rangabhashiyam and collaborators studied the adsorption capacity of activated carbons activated with H3PO4, ZnCl2 and KOH and prepared from agricultural wastes like shell of cocoa, almond, sugarcane, among others; for toxic dyes removal from the textile industry, achieving adsorption capacities up to 147 mg/g 9. In the same year, Siew used African palm shell to produce activated carbon, activated with steam and modified by adding bacteria like Bacillus subtilis and Asperguillus niger. Adsorption tests were done in Nitrate solutions of Lead [Pb(NO3)2], Zinc [Zn(NO3)2], Cadmium [Cd(NO3)2], and Copper [Cu(NO3)2]. The results revealed that the absorptivity of biomodified material increased significantly 10.
The preparation, characterization, and application of activated carbons in the amoxicillin has been studied by many reasearchers. Chayid & Ahmed, studied the performance of activated charcoals with microwave assisted KOH from Arundo donax Linn to remove this contaminant 11. Moussavi et al. on the other hand, used dry pomegranate wood to prepare activated carbons induced by NH4Cl, obtaining a coal with specific surface area of 1029 m2/g, an average pore volume of 2.46 nm, that is a good adsorbent of amoxicillin with Removal percentages of up to 99% at pH 6 12. Pezoti et al. prepared charcoal from guava seeds activated with NaOH to remove amoxicillin achieving an adsorption capacity of 570.48 mg/g 13.
The aim of this research is to apply cocoa shell for the synthesis of activated carbon using the method of low temperature to remove Amoxicillin present in solution.
2. Methodology
2.1 Conditioning of biomass
In first instance, the biomass size was reduced using a blade grinder to achieve more uniformity in its later warm-up and washing with deionized water. Finally, it was dried for 48 h at 105 °C followed by grinding and sieving until reaching particle size between 1 and 2 mm 14.
2.2 Biomass impregnation ZnCl 2
In order to increase the carbon surface area, the samples were impregnated with ZnCl2. Process was made for dissolution ratios 1:3 and 1:4, adding 5 g of biomass to 5 mL of prepared solution, and treated in the shaker at 60 °C, 150 rpm during 3h. Later, they were warmed-up from 150 °C to 350 °C with a heating rate of 5 °C/min 14.
2.3 Carbon activation with HCl
After reaching 350 °C the carbon was activated with HCl 0.1 M for 3 h. After taking samples at ambient temperature, they were washed with distilled cold and hot water alternately until reaching a pH between 6 and 7, subsequently they were left to dry for a period of 24 h at a temperature of 105 °C 14.
2.4 Impregnated biomass and carbons characterization
The prepared biomass underwent an experimental analysis to determine the compounds content responsible for adsorption. Carbon and Hydrogen contents of the biomass were quantified according to AOAC 949 methods. Nitrogen, Sulfur, pectin, lignin, cellulose and hemicellulose were determined for acid digestion according to Kjeldahl method, which consists in the destruction of the sample with concentrated sulfuric acid in boiling, thus separating the nitrogen from its bond matrix and transforming into ammoniacal nitrogen, with a heating period of 4.5 h at 400 ° C 15. Sodium, potassium, iron, copper, magnesium and chromium were analysed using a UV/VIS Shimadzu UV 1700spectrophotometer at 540 nm 16. On the other hand ashes were determined by Term-gravimetric, placing the biomass to be heated in a tared crucible at 550°C for one hour in an oven Model IFA-54-8 Mark Escode (400-600°C), allowing to cool in a desiccator to room temperature and weighing the mass of the crucible in a scale analytics 17.
Analytical tests like SEM, DRX and BET were carried out to determine surface chemical composition, inorganic composition, and apparent surface areas, respectively. For the biomass and activated carbons SEM analysis, was used and Denton Vacum Model Desk IV equipment, subsequently those were inspected in a microscopy JEOL Model JSM 6490 LV in secondary electron mode (magnifications of 50, 250, 500, and 1000 were used and gains with 20 kV). Additionally, the chemical composition of the samples in various points or inspection areas was evaluated through the probe EDS from Oxford Instrument Model INCAPentaFETx3.
Determining the surface area of the biomass and carbons was performed with BET analysis by adsorption isotherms, using N2 as adsorbate at 77 K (-196 °C) through the equipment MicroActiveTriStar II plus 2.03, and then to the obtained data was applied BET method. The DRX analysis of the lignocellulosic material samples and activated carbons was carried out in a XPERT-PRO of PANalytical equipment. The measures were done with a copper tube with a voltage of 45 V and current of 40 mA, time step was 215.790 seconds and the size step 0.0197 º. The data collected by the team were graphed to obtain diffractograms.
2.5 Adsorption assays
Adsorption tests were done for the different factors of dilution impregnation agent (1:3 and 1:4) and for two pH values (6 and 9) as of standard solution of 100 mL obtained from Amoxicillin 500 mg capsules (55.6 % of Amoxicillin) with a concentration of 20 ppm, adding 0.5 g of modified biosorbent. The samples were placed in a shaker at 120 rpm and ambient temperature until adsorption equilibrium. Periodic aliquots were taken every 10 minutes with their respective replica to keep track of the amount of pollutant adsorbed by activated carbon modified over time. Every concentration measurements were taken using a spectrophotometer UV-VIS (Spectrum UV-2650) at a wavelength of 273 nm 18.
After adsorption tests the type of model that better set to the data was determined, in order to have a closer idea about amounts of contaminant adsorbed by the activated carbon in each of the tests, this was done relying on rigorous mathematical analysis of the data taken along experiments. All tests were performed with replicas.
3. Results and discussion
3.1 Characterization of the biomass and activated carbons
Content of Carbon, Hydrogen, Nitrogen and Sulphur, ashes, among other natural polymers like pectin, lignin, cellulose, and hemicellulose were determined by elemental analysis as showed in Table 1.
Table 1 Percentages and ppm amounts of C, N, S, H, ashes, and biopolymers present in the biomass.
| Parameters | Methods | |
|---|---|---|
| Carbon, % | 50.35 | AOAC 949.14 |
| Hydrogen, % | 5.08 | AOAC 949.14 |
| Nitrogen, % | 1.28 | AOAC 949.13 KJELDAHL |
| Sulfur, ppm | 0.59 | Digestion-Nephelometry |
| Ashes, % | 7.75 | Term-gravimetric |
| Pectin, % | 9.54 | Acid Digeston-Term-gravimetric |
| Lignin, % | 12.66 | Photo colorimetry |
| Cellulose, % | 19.82 | Digestion - Term-gravimetric |
| Hemicellulose, % | 9.45 | Digestion - Term-gravimetric |
| Calcium, mg/g as Ca2+ | 11.20 | EAA |
| Sodium, mg/g as Na+ | 0.50 | EAA |
| Potassium, mg/g as K+ | 47.00 | EAA |
| Iron, mg/g as Fe2+ | 0.0014 | EAA |
| Copper, mg/g as Cu2+ | 0.008 | EAA |
| Magnesium, mg/g as Mg2+ | 2.20 | EAA |
| Chromium, mg/g as Cr3+ | 0.0006 | EAA- Graphite Furnace |
As expected, due to the plant-origin nature of the organic material, there is a high carbon content corresponding to 50.35% of the sample, values that promote the synthesis of activated carbon with good porosity, as reported in previous investigations of activated carbons synthesis from palm pit and beech wood whose carbon content values were around 48.7% and 52.8%, respectively, with surfaces areas that reached 748 m2/g. Although there is a direct relationship between large surface areas when the material presents high porosities, not always at the greater the Carbon content can be inferred that greater porosity will be obtained in the activated carbon, since this will depend on the type of carbon and the synthesis method 19.
3.1.1 Scanning Electron Microscopy (SEM)Table 2
The images from biomass SEM analysis are shown in Figure 1:

Table 2 Biomass chemical composition- Microscopy with magnification x500.
| Area | C | O | K | Total |
| 1 | 52.24 | 44.86 | 2.89 | 100.00 |
| 2 | 45.68 | 44.83 | 9.49 | 100.00 |
| 3 | 57.16 | 41.10 | 1.74 | 100.00 |
| 4 | 52.27 | 44.83 | 2.90 | 100.00 |
As evidenced in Figure 1 and Table 2, the biomass has a high content of carbon and oxygen, because lignocellulosic materials generally have a high content of polysaccharides as cellulose and hemicellulose. Furthermore, there is presence of minerals as potassium and magnesium, which does not belong to the characteristic porous surface of the activated carbon, for this reason it was chemically modified with ZnCl2 followed by the material carbonization 20.
3.1.2 Activated carbon analysis by Scanning Electron Microscopy (SEM)
Figures 2 and 3 and, Tables 3 and 4 show the image obtained for carbon of impregnation ratio 1:3 and 1:4 and their surface chemical composition, respectively:


Table 3 Activated carbon (1:3) chemical composition- Microscopy with magnification x500.
| Area | C | O | Cl | Zn | Total |
| 1 | 62.48 | 23.17 | 1.88 | 12.46 | 100.00 |
| 2 | 60.01 | 23.14 | 1.80 | 15.05 | 100.00 |
| 3 | 55.24 | 24.20 | 1.69 | 18.87 | 100.00 |
| 4 | 64.59 | 22.00 | 1.68 | 11.74 | 100.00 |
| 5 | 61.34 | 25.95 | 1.24 | 11.47 | 100.00 |
3.1.3 Biomass surface area analysis by Brunauer Emmett Teller (BET) method
After applying the BET method shown in Figure 4, a surface area of 0.021 m2/g was obtained for the unmodified biomass; whose value is a little lower compared to biomass of wood and bamboo chips, which according to researches, reached surface areas of 4.2 m2/g and 3.5 m2/g, respectively 21.
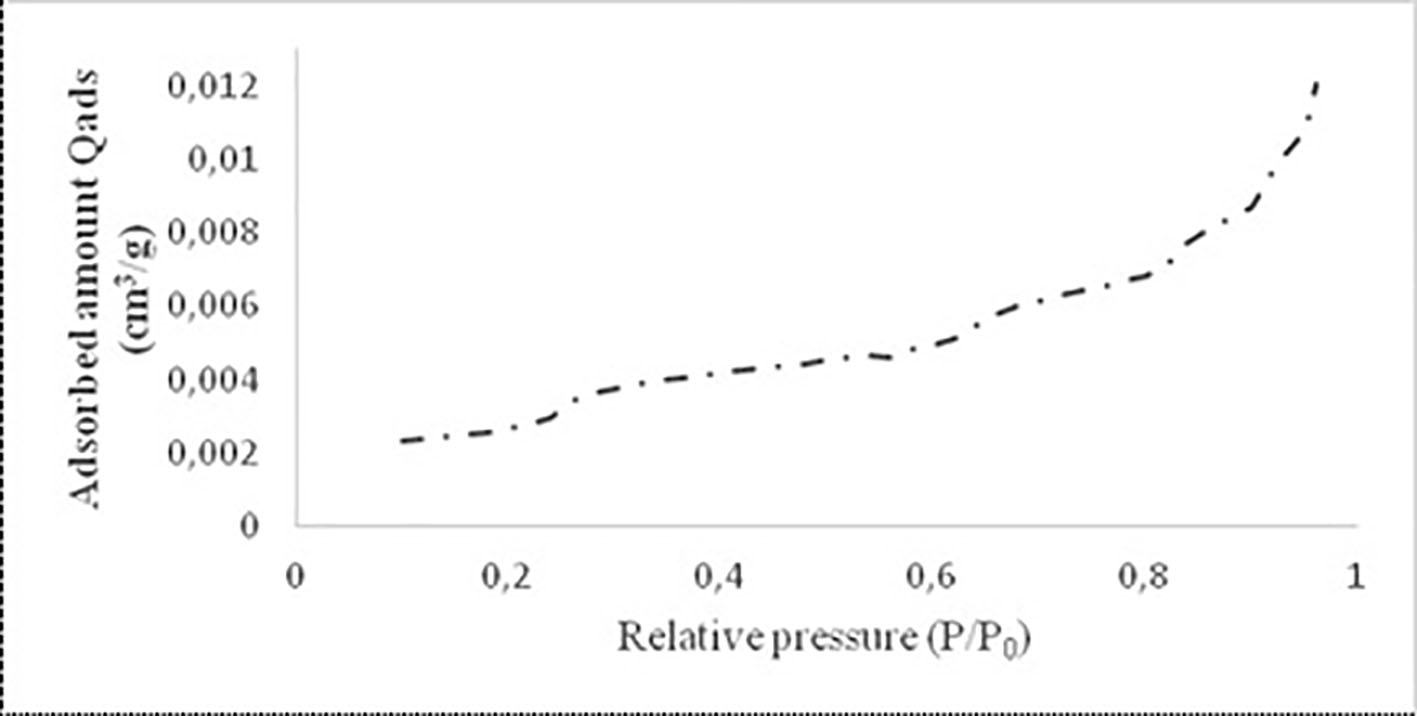
The adsorption isotherms for carbon 1:3 and 1:4 are presented in Figure 5:

As isotherms show in Figure 5, there was greater adsorption by the activated carbon 1:3 which achieved adsorption of 103.7 cm3 of Nitrogen per material gram (P/P0 =1), while carbon 1:4 only managed to adsorb 62.5 cm3 of Nitrogen per material gram (P/P0 =1). After applying the BET method, surface areas of 287.5m2/g and 205.4m2/g were obtained for the activated carbons with impregnation ratios 1:3 and 1:4, respectively. These values represent a considerable increase in the surface area of the material, since before being impregnated and carbonized; the material presented a 0.021 m2/g surface area. Literature has reported activated carbons with areas from 248 m2/g modified in CO2 atmospheres, to carbons with areas higher than 775 m2/g chemically modified with ZnCl2 and carbonized at temperatures above 500°C, which gives an acceptable range for the values of surface area of activated carbon from cocoa shell synthesized at low temperature 22,23.
3.1.4 X-ray Diffraction Analysis (DRX) of carbons
Diffractograms for carbons monoliths1:3 and 1:4 are shown in Figures 6 and 7 respectively:
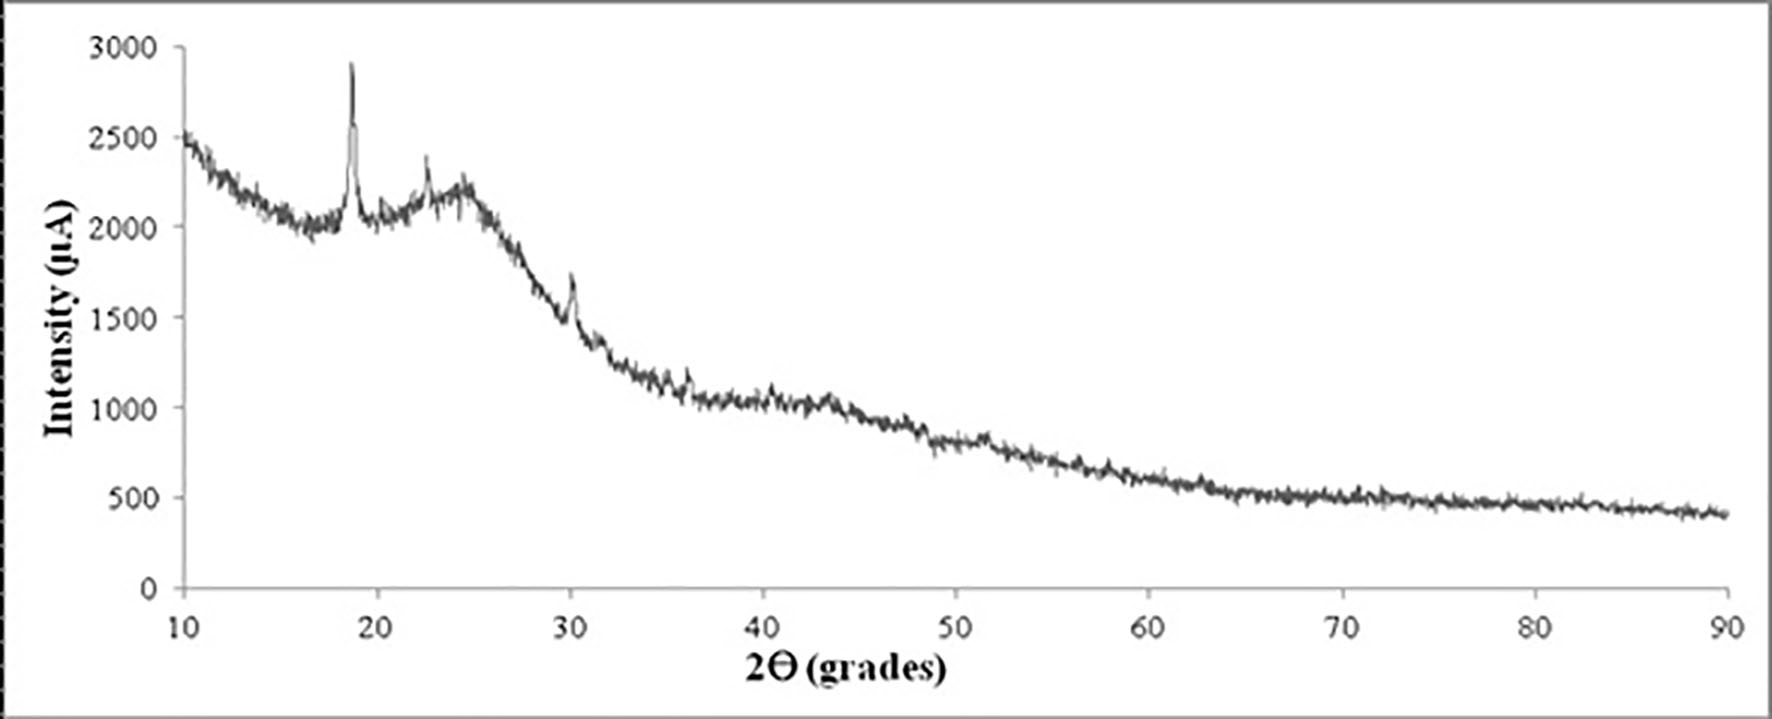
X-ray Diffraction (XRD), elemental analysis and thermogravimetric analysis (TGA) were used to characterize the influence of ClZn2 treatment of activated carbons. The diffraction spectrum of the 1:3 and 1: 4 activated carbons, calcined from 150°C to 350°C with a heating rate of 5°C/min, shown in Figures 6 and 7 did not show any obvious crystalline peak in the 10-80 ° scanning range, which evidences the amorphous phase of the adsorbents.
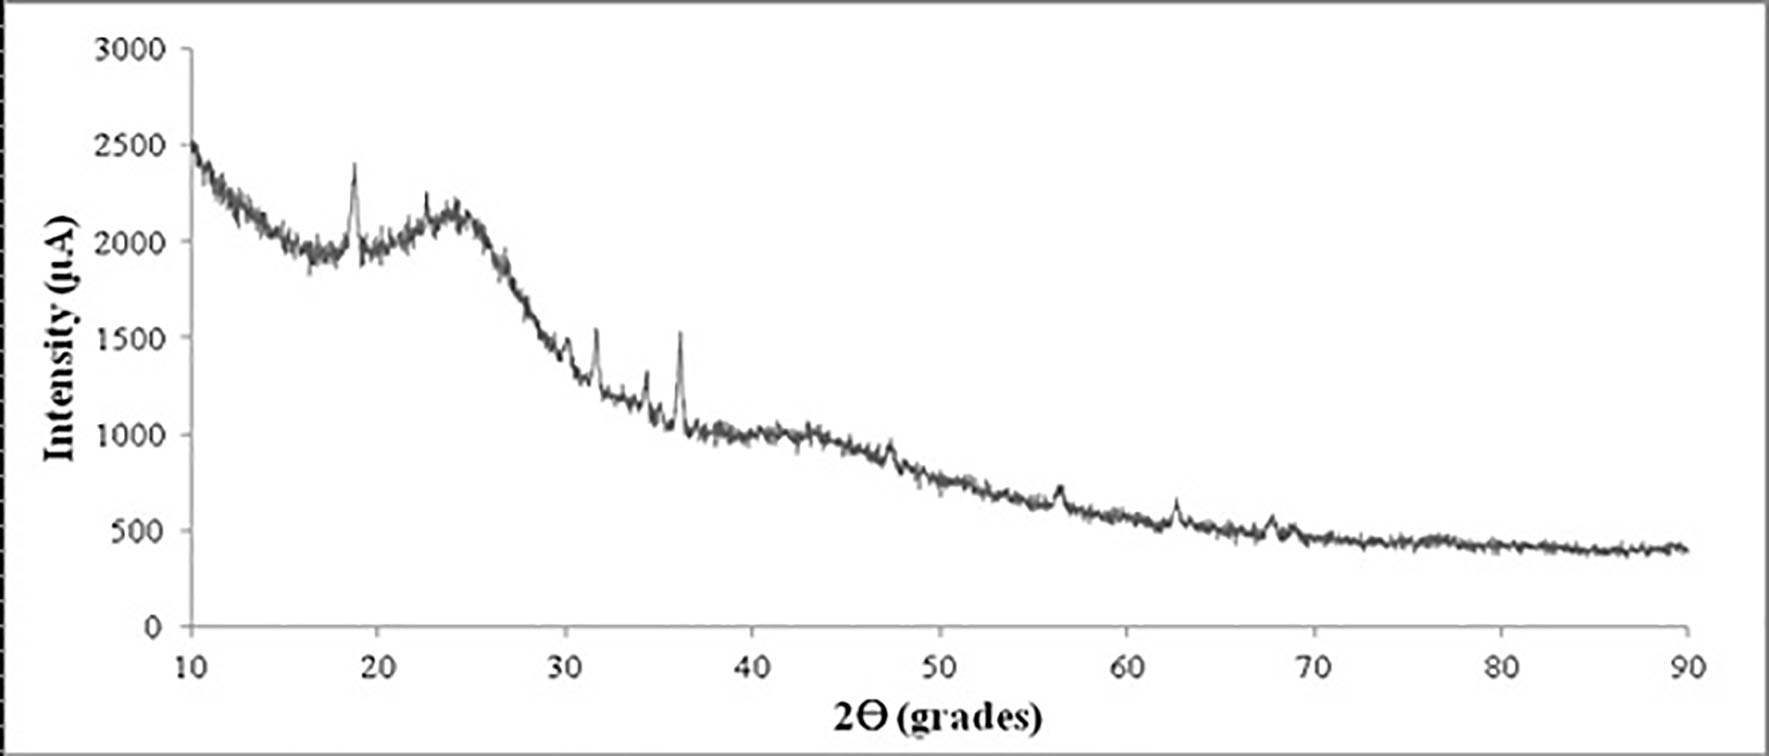
There was a significant difference observed between coal 1:4 compared to charcoal 1:3 in Figures 6 and 7, since the former showed higher intensity of diffraction peaks suggesting that zinc chloride activation induced bulk phase changes in it, this coincides with the studies carried out by Rangabhashiyam & Selvaraju in preparing activated carbons from Sterculia guttata impregnated with ZnCl224. Furthermore, according to Yang and companions the weak diffraction peak indicates that the grain size was little and the grain shape was not complete 25. When analyzing the XRD spectra, bands are observed around 18° and 24°. Researches done in 2011 reflected that these bands correspond to the presence of cellulose as shown in Figure 8 26,27.
3.2 Adsorption assays
A curve of calibration of absorbance (nm) vs concentration (ppm) was built as showed in Figure 8, with Amoxicillin concentrations range from 26 to 0 ppm, including Amoxicillin concentration to be removed (20 ppm), in order to measure the exact pollutant concentration that is left after the adsorption process.

As illustrated in Figure 8 was obtained a perfect linear relationship with a multiple correlation coefficient of 0.998 and R2= 0.9968, the concentration value was determined from the standard calibration curve.
3.3 Effects of pH
The absorbance data obtained in terms of time for both carbons at different pHs are shown in Figure 9:
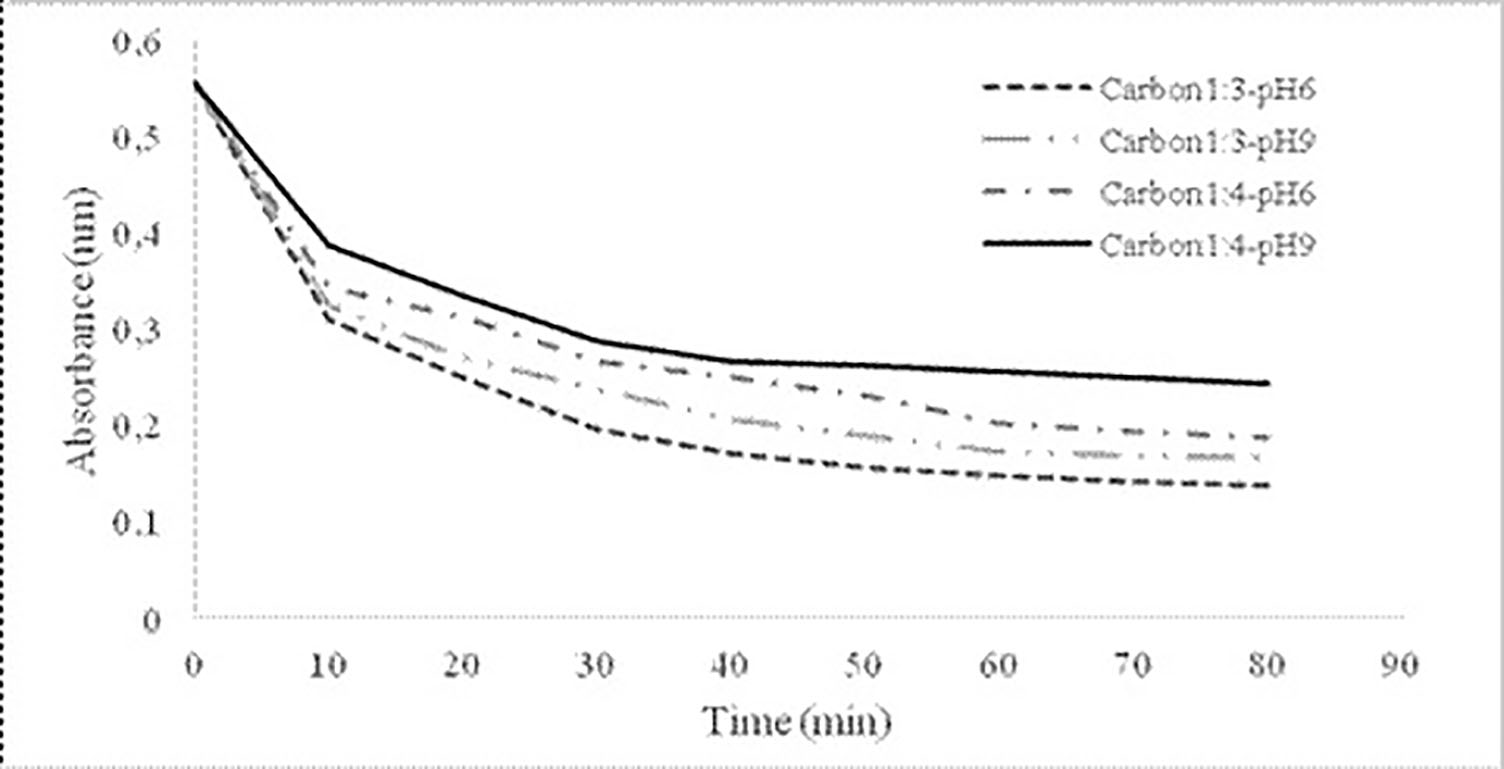
In Figure 9 was observed the decrease in absorbance with respect to time for each of the samples, and the adsorption equilibrium was reached approximately after 80 minutes in all tests.
Applying the equation provided by the calibration curve (C = 37.368 *Abs + 0.0704), every absorbance value could be converted to concentration values of amoxicillin for the carbons with impregnation ratios 1:3 and 1:4, obtaining Figures 10 and 11, respectively:
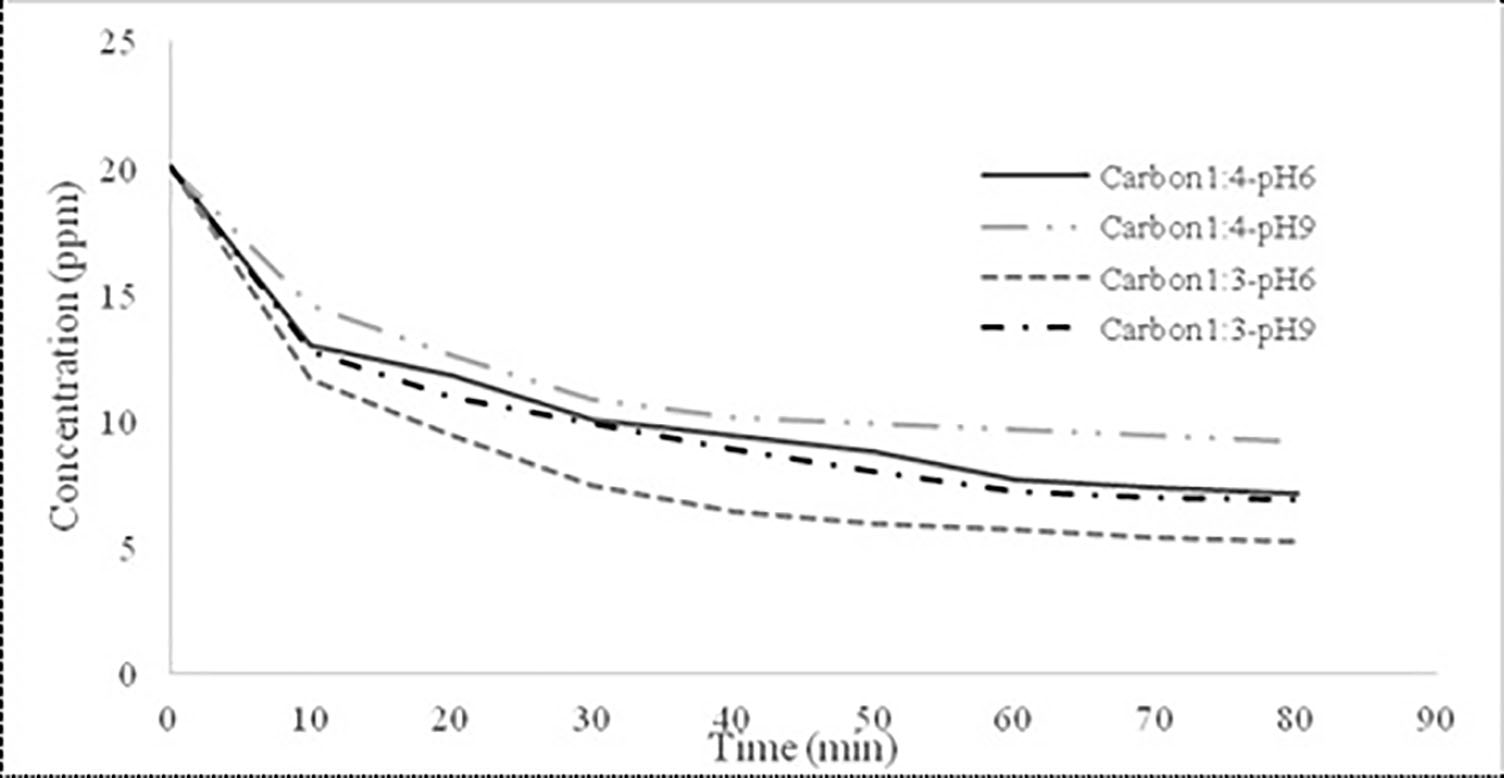
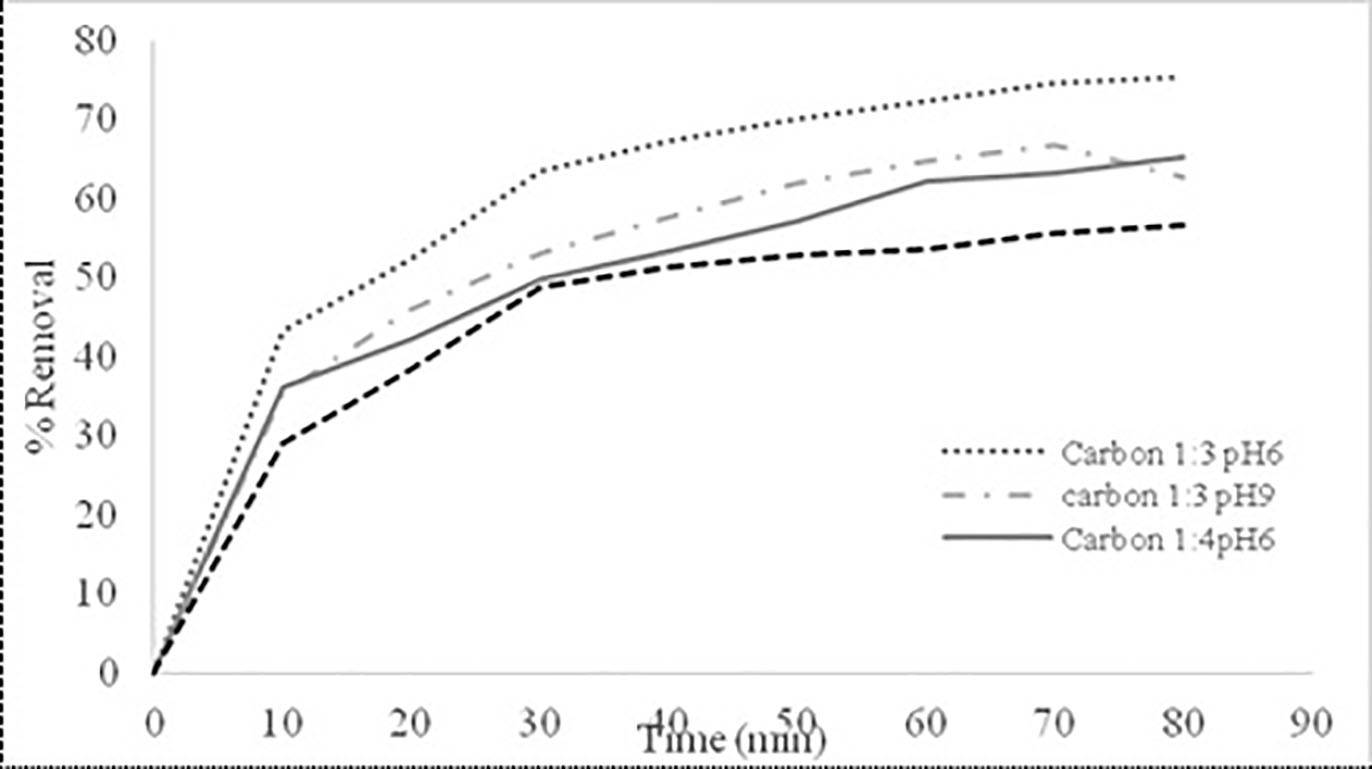
Having established the concentration values, the removal percentage of amoxicillin from activated carbon in terms of time was obtained; whose data are reported in Figure 11.
It was observed that the activated carbon 1:3 presented the highest percentages of removal reaching a value of 75.4% for pH 6 solution and 67.2 % for pH 9 solution. On the other hand, activated carbon 1:4 reached a value of 65.2% for the solution with pH 6 and 56.7% for the solution with pH 9. As expected from the activated carbon 1:3, due to its greater surface area, it presented in all cases greater percentage of removal than the activated carbon 1:4. Moreover, the influence of pH in adsorption mechanism is evident, seeing the latter favored in acidic environment. Previous researches have achieved percentages of removal of amoxicillin from 70.5%, with activated carbons from almond shell and basic pH conditions (pH > 7) up to 83.7% using activated carbon derived from coconut shell in acidic pH conditions (pH 2-6), being acceptable the removal values of amoxicillin reached by activated carbons synthesized in this investigation, considering that these have been obtained at low temperatures, which represents a decrease in energy expenditure 18,28.
4. Conclusions
Elemental analysis done to biomass (cocoa shell) showed a high carbon content, which favors its use as raw material for the synthesis of activated carbon given the ability of these species to acquire high porosity. Given the SEM and BET characterizations that were carried out, it was perceived a substantial change in the surface area of activated carbons synthesized, being the impregnation ratio of 1:3 the one that had the highest increase in the value of its surface. Based on the percentages of removal of amoxicillin, it can be described the adsorption mechanism as a process of monolayer formation, wherein the antibiotic covered the carbon surface until reaching equilibrium; during the adsorption process the pH of the solution to be treated had a strong influence on the adsorption mechanism of activated carbons seeing favored by acidic environments (pH 6). It was determined that the best conditions for the removal of amoxicillin were the carbons with impregnation ratios of 1:3 and the solution of amoxicillin at pH 6, reaching removal percentage of 75.4%, in contrast to activated carbon synthesized with impregnating ratio 1:4 and pH 9, which removal percentage of amoxicillin was 56.7%. Therefore, it can be concluded that the activated carbons obtained at low temperature from the cocoa shell (Theobroma cacao) are a viable biomaterial for removal of amoxicillin in aqueous solution.

